Exploring pathways to late-Holocene increased surface wetness in subarctic peatlands of eastern Canada
Simon van Bellen1* Michelle Garneau1,2 Andy Baird3
Marc-André Bourgault1,4 Anne Quillet5
1Geotop-Université du Québec à Montréal, Montreal, Canada
2Département de géographie, Université du Québec à Montréal, Montreal, Canada 3School of Geography, University of Leeds, Leeds, UK
4Département des sciences de la Terre et de l'atmosphère, Université du Québec à Montréal, Montreal, Canada
5Geography, University of Exeter, Exeter, UK
*Correspondence author: [email protected], +1 514 742-8204 1 2 3 4 5 6 7 8 9 10 11 12 13 14 15 16 17 18 19 20 21 22
ABSTRACT
The poor fens of the Laforge region, northeastern Canada, have developed under subarctic conditions. They are characterized by a microtopography of large pools and low, narrow strings. Paleorecords suggest some of these systems were once ombrotrophic and relatively dry. Taking account of their current ecoclimatic position, we aimed to explore the possible pathways towards the current wet state, a process referred to as ‘aqualysis’. We combined paleoecological methods applied to a peat core with conceptual modelling to identify factors that might plausibly explain aqualysis. Reconstructions showed the Abeille peatland became minerotrophic with high water tables between 2400 and 2100 cal yr BP. Conceptual modelling, supported by simulations using the numerical DigiBog model, allowed us to identify the effects of cooling and increased precipitation on productivity, decay, peat hydraulic conductivity and vertical peat accumulation. Both cooling and increased precipitation were required for aqualysis to occur and for wet surface conditions to persist to the present day. Increased recharge from the catchment, which also restricted drainage from the peatland center laterally, was likely critical for the development of minerotrophic conditions. The scenario of cooling and wetting in these peatlands is supported by available paleoclimate records for eastern Canada.
Keywords: fen, minerotrophy, testate amoeba, DigiBog, water table, Neoglacial, aqualysis, accumulation 23 24 25 26 27 28 29 30 31 32 33 34 35 36 37 38 39 40 41 42 43 44
INTRODUCTION
Linkages between peatland water tables and climate variability have been studied in a wide range of northern peatlands (e.g. Arlen-Pouliot and Payette, 2015; Booth and Jackson, 2003; Magnan and Garneau, 2014; Marcisz et al., 2015; Sillasoo et al., 2007; Swindles et al., 2010; Väliranta et al., 2007; van Bellen et al., 2011; van Geel and Renssen, 1998). Past studies have identified the climate variables that explain the variability in reconstructed water-table level at decadal timescales in various climatic settings (Booth, 2010; Charman et al., 2009; Schoning et al., 2005). For instance, in western Europe, these variations in water-table position are best explained by summer water deficit (precipitation minus evapotranspiration), which was driven mostly by variations in precipitation (Charman et al., 2009), whereas in continental North America, they are best correlated to precipitation-driven drought intensity (Booth, 2010). Information on peatland water-table dynamics at decadal to millennial timescales can be obtained using peat cores (e.g. Lamentowicz et al., 2015; Mauquoy et al., 2008). Quantified at such timescales, water-table levels are generally expressed with the peatland surface as the reference height. Using the peatland surface as a reference height implies a high interdependence between water-table dynamics and peat accumulation, and a strong feedback effect has been established between these processes in contemporary process-based studies (Belyea and Clymo, 2001; Bridgham et al., 2008). Interactions between peat accumulation and reconstructed water tables 45 46 47 48 49 50 51 52 53 54 55 56 57 58 59 60 61 62 63 64 65 66
suggest the existence of various pathways towards changes that may hinder the interpretation of proxy records in terms of climate change (Morris et al., 2015b; Swindles et al., 2012). Experimental studies (e.g. Bridgham et al., 2008) and peatland development models, such as DigiBog (Baird et al., 2012; Morris et al., 2012) and the Holocene Peat Model (HPM) (Frolking et al., 2010), show the importance of both autogenic and external factors (e.g. climate) as controls on peat accumulation.
The subarctic patterned fens of the Laforge region in northern Quebec, Canada, are characterized by a structure of alternating strings and pools, with pools occupying up to half of the surface (Arlen-Pouliot and Payette, 2015; Cliche Trudeau et al., 2012; White and Payette, 2016). Similar surface patterning has been found to be dominant in peatlands within a ~200 000-km2 region in eastern Canada, from the southern limit of the permafrost boundary towards northern and eastern Labrador (Foster et al., 1988a). At a global scale, patterned fens are characteristic of the northernmost section of the boreal region corresponding to a distinct bioclimatic zonation over the northern hemisphere (Payette and Rochefort, 2001) and similar ecosystems have been documented in Sweden (Foster and Fritz, 1987; Sjors, 1983) and Finland (Ruuhijärvi, 1983). The general abundance of pools and the short growing season contribute to emissions of methane, and in some years, net emissions of carbon, as carbon dioxide, to the atmosphere (Cliche Trudeau et al., 2012, 2014; Rinne et al., 2007). Stratigraphical analyses of multiple peat cores collected in three subarctic patterned fens in northern Quebec showed that peat accumulation initiated under relatively dry and ombrotrophic 67 68 69 70 71 72 73 74 75 76 77 78 79 80 81 82 83 84 85 86 87 88
conditions from ~6500 cal yr BP (Garneau et al., 2017) and converged to near-surface water tables between 4000 and 2000 cal yr BP in an initial shift (Figure 1; van Bellen et al., 2013). A second wet shift was registered during the Little Ice Age (van Bellen et al., 2013). The widespread, regional water-table rise, causing tree mortality, pool expansion and physical degradation of strings, has been referred to as ‘aqualysis’ (Dissanska et al., 2009; Tardif et al., 2009; White and Payette, 2016). Aqualysis may be driven by an increase in precipitation that exceeds any loss via evapotranspiration or liquid flow, until a new, relatively stable state is reached. In an attempt to identify the driving factors that influenced this increased surface wetness, we considered possible pathways towards aqualysis, as found in the Abeille peatland (van Bellen et al., 2013), in the Laforge region of Quebec, using a conceptual modelling approach.
Pool formation in peatlands may be explained by a range of factors. Studies on basin geomorphology attributed an important effect of mineral substrate on pool distribution (Comas et al., 2011). Belyea and Lancaster (2002) showed the influence of peatland slope and patterns of water flow on pool formation and distribution, suggesting that pool size was related to pool age. Additional, autogenic mechanisms have been proposed to explain pool development: hollows may degrade and form pools due to differential peat accumulation between hummocks and hollows, which exacerbates initial, small microtopographical gradients (Foster et al., 1988b; Ohlson and Økland, 1998). Patterns of pool distribution and relationships with geomorphological variables have been explored specifically in the Laforge region (White and Payette, 2016) where 89 90 91 92 93 94 95 96 97 98 99 100 101 102 103 104 105 106 107 108 109 110
pool presence and formation appeared to be positively related to peatland surface slope, size of the watershed and peat deposit thickness. White and Payette (2016) suggested that, in addition to geomorphological and topographical factors, climate change may affect the water supply to these peatlands and contribute to ponding and pool expansion. Besides an initial large-scale surface wetting in the Laforge region that initiated around 4200 cal yr BP (Garneau et al., 2017; van Bellen et al., 2013), pool expansion was reported during the Little Ice Age as evidenced by tree-ring dating of tree mortality (Arlen-Pouliot and Payette, 2015).
Although the presence and development of peatland pools may be explained by a range of geomorphological, hydrological and biological forcings, and feedbacks among these, the timing of the regional water-table rise after 4200 cal yr BP in the Laforge region (Figure 1; Garneau et al., 2017; van Bellen et al., 2013) suggests a common, external forcing. The late-Holocene cooling, or Neoglacial, characterized by gradually declining summer insolation (Berger and Loutre, 1991) and colder conditions (Viau and Gajewski, 2009; Viau et al., 2006), has been identified as the main climatic period influencing peatland dynamics in eastern Canada and this forcing was, therefore, considered as an explanation for aqualysis.
In this paper, we aimed to explore the possible pathways towards peatland aqualysis under changing climate conditions. To do so, we combined existing reconstructions from Abeille peatland, located in the Laforge region (van Bellen et al., 2013), new paleodata 111 112 113 114 115 116 117 118 119 120 121 122 123 124 125 126 127 128 129 130 131 132
from these sites, and conceptual modelling. We developed six conceptual ecohydrological models, or scenarios, to investigate the factors that might explain sustained pool expansion, and used numerical experiments with a peatland development model to indicate, in broad terms, the explanatory power of these scenarios. Finally, we used the detailed reconstructions and information on the regional climate and environmental history as established by earlier studies to help identify the most plausible explanation for aqualysis.
STUDY REGION
Located in the Laforge region of subarctic Quebec, the Abeille peatland (54.11°N, 72.50°W) is an oligotrophic fen that covers an area of 3.5 ha. The region belongs to the
Picea mariana-dominated lichen woodland zone, near the boreal-tundra ecotone (Figure
2). Extensive anthropic activity in this region did not start until the second half of the 20th century, with the development of the infrastructures associated with hydroelectricity facilities. Peatlands in this region generally do not exceed a few hectares as they are confined to topographic depressions in the Precambrian shield, which restrict lateral expansion. During the 1971-2012 period, the regional mean annual temperature was -3.6°C and the mean annual precipitation was 748 mm, of which 468 mm fell during the growing season, defined as the period with daily average temperatures > 0°C (Natural Resources Canada’s interpolated gridded datasets; Hopkinson et al., 2011; Hutchinson et 133 134 135 136 137 138 139 140 141 142 143 144 145 146 147 148 149 150 151 152 153 154
al., 2009; McKenney et al., 2011). The Laforge region experiences relatively wet and cold conditions which define the current northern bioclimatic limit of ombrotrophic peatlands (Figure 2). Despite mean annual temperatures well below 0°C, no clear signs of permafrost have yet been found in this region. Currently, average snowfall attains 280 mm as water equivalent, which represents ~120 cm of snow cover. This relatively high amount of snowfall insulates the surface from frost penetration (Zoltai, 1995), which probably explains the current absence of permafrost.
METHODS
Conceptual models may be defined as simplified theoretical representations of a system and of the links and feedbacks between the system's main components (Robinson, 2008). They are often seen as a first stage in describing the system of interest and the main factors that may affect the system, and usually provide the basis for more formal, quantitative, i.e. mathematical or numerical, models. We developed six conceptual models (hereafter referred to as ‘scenarios’) describing potential conditions for aqualysis in an attempt to identify the conditions necessary for this change. Currently, there are insufficient data to apply numerical models to the site, but we used the numerical DigiBog model (e.g. Morris et al., 2015b) as an exploratory tool to help identify and assess our scenarios; therefore, we used a novel combination of the conceptual and numerical modelling approaches. The six scenarios were identified from multiple runs of 155 156 157 158 159 160 161 162 163 164 165 166 167 168 169 170 171 172 173 174 175 176
the DigiBog model in which we looked at how changes in net rainfall (precipitation-evapotranspiration), temperature, and exchange of water between the peatland and the surrounding catchment affect peatland function. Changes in both net rainfall and
temperature have likely been implicated in aqualysis (van Bellen et al., 2013). More detail on our model runs, including the rationale for looking at changes in climatic wetness and temperature, is provided below (see ‘Developing conceptual models to explain aqualysis using DigiBog as an exploratory tool’). Before that, we provide more information on DigiBog and explain what is known about the site from the paleorecord.
DigiBog
DigiBog is an ecohydrological model based on mathematical representations of feedbacks between ecological processes, such as plant organic matter production, and hydrological processes, such as water flow through the peat. The model is useful in indicating how a peatland might respond over decadal to millennial timescales to changes in, for instance, climate, and, because of its mathematical basis, allows a more formal (quantitative) assessment of such responses than is possible in conceptual models. We used DigiBog to create a hypothetical peatland with general properties similar to those of Abeille peatland. The hypothetical peatland was simulated first under constant climate conditions. We then considered whether changes in (i) climatic 177 178 179 180 181 182 183 184 185 186 187 188 189 190 191 192 193 194 195 196 197
wetness, (ii) temperature, and (iii) inputs of water from surrounding hillslopes could plausibly explain aqualysis in the hypothetical peatland.
DigiBog simulates peatland development over timescales of decades to millennia. It takes account of organic matter production by peatland plants, peat decay and the hydrological dynamics of the system. As well as modelling the change in peat thickness, it simulates peatland water-table dynamics and the changing properties, i.e. the degree of decomposition and permeability, of the peat. The recent versions of DigiBog are fully transient; the water table may constantly vary, as may rates of organic matter production and decay (Morris et al., 2015b; Young et al., 2017). In these recent editions, both productivity and decay vary with temperature as well as with peat wetness. For the exploratory modelling of a hypothetical peatland we used the latest 1-D version reported in Morris et al. (2015b). Although the model cannot currently simulate pool development, it can simulate shifts in water tables relative to the surface and can help identify the conditions needed to cause long-lasting wet shifts consistent with aqualysis.
In DigiBog rates of organic matter production increase with temperature and peak for water-table depths of 20-40 cm (Belyea and Clymo, 2001). For water tables closer to the peatland surface (depths of 0-20 cm) and for deeper water tables (depths > 45 cm), plant productivity is lower. Organic matter production parameters can be set to give plausible thicknesses of peat for a study site. Peat decay in the model is simulated using an exponential decay model, which removes a given proportion of peat from each 198 199 200 201 202 203 204 205 206 207 208 209 210 211 212 213 214 215 216 217 218 219
annual cohort per unit of time. Decay rates are modified by temperature, using a Q10 function, and vary according to the position of the water table; i.e. the presence of oxic or anoxic conditions. In addition, a recalcitrance effect on rates of decay is included (Morris et al., 2015b). The resulting peat profile is composed of annual cohorts of peat. Lateral water flow from the column of peat representing the center of the peatland (in the 1-D version of the model) depends on the permeability of the peat and on the difference in the height of the water table between the center of the peatland and its margin. Peat permeability is dynamic and varies in each peat cohort according to the degree of decomposition; the permeability declines as the peat becomes more decomposed. In the model, the relationship between permeability and decomposition is one of the feedbacks between ecological processes, such as decay, and physical processes, such as water flow. Permeability affects water-table position, which determines the relative proportion of oxic and anoxic decay and also the rate of organic matter production.
Reconstructions from peat cores
Aqualysis is a widespread, regional phenomenon, the timing of which was established using five peat cores sampled in lawns of three peatlands in the Laforge region (van Bellen et al., 2013). Based on the premise that changes in water-table levels in hollows coincide with those in adjacent lawns, we assumed the reconstructions from peat cores extracted from lawns reliably reflect the water-table dynamics in hollows. To help 220 221 222 223 224 225 226 227 228 229 230 231 232 233 234 235 236 237 238 239 240 241
interpret the scenarios (conceptual models) describing potential conditions for aqualysis, we combined the initial reconstruction of Abeille peatland development from van Bellen et al. (2013) with new core data on peat bulk density, humification, plant productivity and charcoal abundance, as well as reconstructions of carbon (C) accumulation rates. The new, detailed record from the Abeille-5 core was considered a benchmark for the Laforge region and was therefore used to interpret the possible pathways towards aqualysis.
The chronology for the Abeille-5 core was based on accelerator mass spectrometry 14C dating, which included six samples, and 210Pb dating using -spectrometry. The previously published chronology of the core (van Bellen et al., 2013) was updated using Bacon in R (Blaauw and Christen, 2011; R Core Team, 2016), applied to the original dates (all details of sample composition and raw data in van Bellen et al., 2013). The ecohydrological reconstructions were based on plant macrofossil and testate amoeba records. Past water-table positions were inferred from testate amoeba assemblages using the transfer function of Lamarre et al. (2013) and expressed as a depth below the surface of the peatland, with positive values representing water table levels below the peat surface. Peat bulk density and loss-on-ignition were quantified using 1-cm3 subsamples (Dean, 1974), which allowed, when combined with the chronologies, for the calculation of C accumulation rates. Charcoal fragments larger than 1 mm were counted using 3-cm3 subsamples and expressed as an influx (# of pieces yr-1). Because of the size of the charcoal fragments, resulting records were assumed to represent local (peat) fire 242 243 244 245 246 247 248 249 250 251 252 253 254 255 256 257 258 259 260 261 262 263
incidence, yet a minor contribution from the watershed could not be excluded. Peat humification, interpreted as an approximation of the amount of organic matter lost through decay, was quantified using the protocol of Blackford and Chambers (1993). Raw transmissivity values were detrended for the catotelm section only, because the acrotelm is still subjected to oxic decay rates, the limit of which was identified using the age-depth model. The humification residuals were interpreted as a measure of the state of decay. An index for plant productivity was calculated by subtracting the humification values from the C accumulation rate values after rescaling both records to z-scores.
Late-Holocene development of Abeille-5
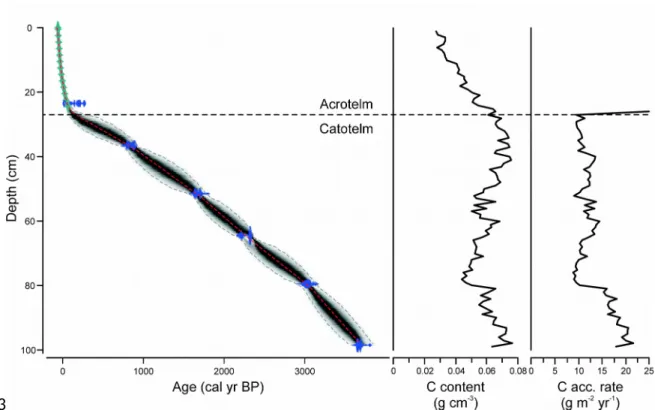
The age-depth model of Abeille-5 showed that vertical accumulation rates were generally low and declined gradually during the late-Holocene (Figure 3). No major hiatus associated with peat erosion or major or recurrent burning could be identified. Due to the high-resolution dating using 210Pb, age control was highest for the near-surface section. C accumulation rates were highest at the base of the sequence, with values between 15 and 20 g m-2 yr-1, declining to 8-15 g m-2 yr-1 between 80 cm depth and the top of the catotelm (Figure 3).
The lower section of the record contained woody peat with occasional Sphagnum
fuscum and a high charcoal influx suggesting repeated fires (98-78 cm depth; 3690-2940
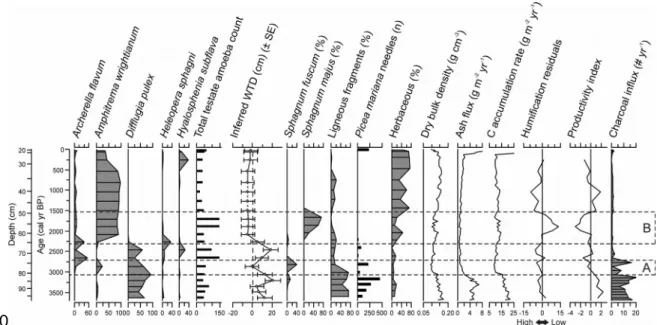
cal yr BP). Testate amoeba and plant macrofossil records indicated an initial sharp 264 265 266 267 268 269 270 271 272 273 274 275 276 277 278 279 280 281 282 283 284 285
increase in water-table levels between 3200 and 2800 cal yr BP (period A; Figure 4). During this period, ligneous vegetation was gradually replaced by S. fuscum and fires likely became less prevalent, while C accumulation rates declined. As humification values, and therefore decay loss, were relatively stable, the decrease in C accumulation rates may be the result of declining organic matter production. The reconstructed wetter conditions only lasted a few centuries as surface wetness decreased again around 2700 cal yr BP. A second period of increasing water-table levels occurred around 2400 cal yr BP, reaching the surface around 2100 cal yr BP (period B; Figure 4) and remaining close to or above the surface until the second half of the 20th century. This period was characterized initially by low peat humification and by the presence of Sphagnum majus, which is a species characteristic of hollows and pools (Laine et al., 2009). In contrast with period A, water tables remained close to the surface for the following centuries. After 1500 cal yr BP, S. majus was replaced by herbaceous species. The disappearance of
Sphagnum coincided with increasing peat humification and decreasing productivity as
suggested by the productivity index (Figure 4). Lowest C accumulation rates of 9 g m-2 yr -1 and low productivity indices occurred after 900 cal yr BP, when local vegetation remained dominated by herbaceous species and water tables persisted near the peatland surface. Between 2000 and 600 cal yr BP, local mineral influx rose gradually as indicated by the ash influx reconstruction (Figure 4), attaining 2 g m-2 yr-1. This trend, together with the abundance of Sphagnum subsecundum, minerotrophic mosses and herbaceous plants, suggests that the last 2000 years have been characterized by a degree of minerotrophy (van Bellen et al., 2013). A sharp increase in mineral influx up to 286 287 288 289 290 291 292 293 294 295 296 297 298 299 300 301 302 303 304 305 306 307
29 g m-2 yr-1 was recorded during the second half of the 20th century, associated with the start of anthropic activity in the region. Hence, the paleoecological record shows two specific episodes of increasing water-table levels which may be evaluated in terms of climate change and through use of conceptual models based on exploratory DigiBog simulations.
The detailed record from Abeille-5 confirms the previously reconstructed trend found in the minerotrophic peatlands of the Laforge region. Some of these ecosystems initially developed under ombrotrophic conditions, with water tables 10-20 cm below the surface, followed by a prolonged period of high water-table levels near the surface of the peat (Figure 1; van Bellen et al., 2013) which clearly exceeded the ecological resilience of the ecosystem (sensu Holling, 1996). Located at the northern biogeographic limit of ombrotrophic peatlands (Payette and Rochefort, 2001), the Laforge region peatlands have accumulated ≤ 150 cm of peat in more than 6500 years (Garneau et al., 2017; van Bellen et al., 2013), which implies that rates of organic matter production only marginally exceeded those of decay. Unlike temperate peatlands, which are sensitive to droughts, the ecohydrology of these subarctic peatlands in a relatively humid climate may be influenced primarily by temperature (Charman, 2007; Morris et al., 2015b) and the relatively short growing season likely limits plant productivity and thus peat accumulation (cf. Bartsch and Moore, 1985; Loisel et al., 2012).
308 309 310 311 312 313 314 315 316 317 318 319 320 321 322 323 324 325 326 327 328 329
Developing conceptual models to explain aqualysis using DigiBog as an exploratory tool
As noted above, we used DigiBog as an exploratory tool to help identify possible routes to aqualysis. It is important to stress that DigiBog was not applied directly to the study site; there is not enough known about the site for such an application. The use of DigiBog here should not be seen as a site-specific application of the model for which model-data (from cores) comparisons could be made. We used DigiBog instead to 'grow' a plausible ombrotrophic peatland under a constant climate, i.e. with a similar central peat thickness to the site prior to the onset of aqualysis. We then considered what factors might cause aqualysis: changes in peatland organic matter production and rates of peat decay, brought about by climatic cooling, an increase in climatic wetness, and changes in lateral water exchanges between the peatland and surrounding hillslopes.
An increase in climatic wetness might be expected to increase surface wetness. However, as suggested by Swindles et al. (2012) and Morris et al. (2015b), such changes may be relatively short-lived – perhaps no more than several centuries in duration – because of negative feedbacks within the ecosystem: increased organic matter production may allow the peatland surface to rise so that the original depth of the water table, relative to the peatland surface, is restored. Morris et al. (2015b) showed that changes in temperature in combination with changes in climatic wetness can cause much longer-lived changes in the state of a peatland. For instance, if the increase in climatic wetness is accompanied by climatic cooling, such as that associated with the 330 331 332 333 334 335 336 337 338 339 340 341 342 343 344 345 346 347 348 349 350 351
Neoglacial period, lower growing season temperatures may suppress organic matter production. In this case, the peatland surface does not increase in height and, instead, stays close to the water table. Cooling will also suppress decay rates; therefore, for overall rates of peatland growth to be curbed, organic matter production rates must be lowered more than peat decay rates. Given the geomorphological setting of the Laforge peatlands, characterized by landscape depressions surrounded by hillslopes, we also considered the possibility that a general raising of hillslope water tables caused either (i) water levels at the peatland margin to increase, limiting lateral water loss from the peatland center, or (ii) minerotrophic water to enter the base of the peatland via groundwater seepage or inflow from slopes. Wetter hillslopes may also have caused occasional flow of minerotrophic surface water into the peatland, perhaps during periods of sustained high precipitation. Including this aspect in the scenarios was also motivated by the slightly minerotrophic conditions reconstructed for the last 2000 years (van Bellen et al., 2013), which suggest that nutrients were able to enter the ecosystem.
In addition to a baseline setting (scenario 1), which represented a stable climate throughout peatland development, five scenarios were explored using DigiBog (Figure 5). Scenarios 2 to 6 all included a step-like, but persistent 20% increase in net precipitation, starting 2500 years after peatland initiation. Scenarios 3 and 5 were also characterized by a step-like, persisting drop in temperature (of 0.6°C) which caused a reduction in productivity of ~17% and a reduction in decay of ~4%, whereas a stronger temperature drop (of 1°C), causing a reduction in productivity of ~28% and a reduction 352 353 354 355 356 357 358 359 360 361 362 363 364 365 366 367 368 369 370 371 372 373
in decay of ~9%, was included in scenario 6. Scenario 4 presumed a stable temperature, but included groundwater seepage or increased hillslope runoff from the catchment to the peatland edge. This simulation was performed by reducing the rate of subsurface water flow from the peatland center to the margin by 30% after 2500 years. Finally, scenario 5 also included this effect of reduced lateral flow or increased catchment contribution; the difference between scenarios 4 and 5 being the drop in temperature that caused a reduction in productivity of ~17% and a reduction in decay of ~4%. This cooling effect was included in scenario 5, but not in scenario 4 (Figure 5).
RESULTS
In the DigiBog simulations of the hypothetical peatland, the different scenarios had distinct effects on peatland water tables (Figure 5). Under scenario 1, the water-table level relative to the peatland surface remained more or less stable for the entire 5500-year period considered. Scenario 2, which contained an increase in net precipitation of 20%, triggered a short-lived increase in water-table height, but not enough to create surface inundation. When a drop in temperature was added under scenario 3, causing a reduction in productivity of ~17% and a reduction in decay of ~4%, surface wetting was achieved and persisted ~1500 years after the initial climatic shift until the present-day. The importance of such a cold shift for persisting aqualysis was underlined by scenario 4: the combination of restricted lateral water flow and an increase in precipitation alone 374 375 376 377 378 379 380 381 382 383 384 385 386 387 388 389 390 391 392 393 394 395
did not lead to aqualysis as the simulated peatland showed a homeostatic response to these hydrological shifts. Indeed, when the cold shift was added (scenario 5), aqualysis was relatively rapid and persisted for millennia. Finally, scenario 6 also led to aqualysis, but the shift took ~600 years to be completed.
These scenarios suggest that a net reduction in rates of peat accumulation, caused by a reduction in temperature depressing organic matter production more than decay, was needed for aqualysis. In this situation, peat permeability declines as the slowly accumulating peat decays, so that the water table catches up, or keeps pace with the rising peat surface and aqualysis occurs. However, under scenario 3, the transition from a dry to a wet state was very slow, with the shift from relatively deep water tables to water tables at the peatland surface taking more than 1000 years. When the temperature effect on net peat accumulation was accompanied by an increase in net rainfall and increased flow from neighbouring hillslopes, rapid and persistent wetting of the peatland occurred. In this scenario, the additional increase in wetness caused by the contribution from the watershed produced a greater decline in organic matter production, i.e. an even greater decline in net peat accumulation, so that the water tables rose even more rapidly relative to the peatland surface.
DISCUSSION 396 397 398 399 400 401 402 403 404 405 406 407 408 409 410 411 412 413 414 415 416 417
Laforge peatland ecohydrology and Neoglacial climate reconstructions
Comparing the scenarios with the paleorecord from Abeille peatland, it appears that period A (Figure 6) corresponds broadly with scenario 4, which was defined by an increase in precipitation of 20% and a reduced lateral water flow. The reconstructed homeostatic response that follows the increase in water-table level may be more likely to occur when shifts in precipitation are of relatively minor intensity, as the peatland’s internal dynamics, including changes in decomposition, production and hydraulic properties, show resilience through a negative feedback mechanism (Morris et al., 2015b).
The conceptual model based on scenario 5 suggests the shift registered around 2100 cal yr BP (period B; Figure 6) was forced by an increase in precipitation, a reduction of temperature, a reduced water flow towards the margin and some flow of mineral water from the hillslopes into the peatland. Scenario 5 suggests all these changes were required for aqualysis. Aqualysis also occurred in scenario 6, yet cooling and a wet shift alone fail to explain the transition to partial minerotrophic conditions. Scenario 5 is therefore the more plausible of the two as an explanation of aqualysis and the establishment of poor fen conditions at Abeille.
Although we note above the temperature drops associated with the declines in organic matter production and decay rates, these should not be over-interpreted. Based on 418 419 420 421 422 423 424 425 426 427 428 429 430 431 432 433 434 435 436 437 438 439
multi-annual measurements of Sphagnum growth in a wide range of peatlands, Moore (1989) reported an average decrease in net primary productivity (NPP) of 17.2 g m-2 yr-1 for a 1°C decrease in mean annual temperature (r2 = 0.31), with lawns and hollows slightly more sensitive than hummocks. The dataset used by Moore (1989) included subarctic fens near Schefferville, ~350 km east of the Laforge region, and the hydrologic setting of the measured microforms was found to be important in explaining intra-site differences in annual NPP. Annual NPP for lawns and hummocks in these poor fens was in the order of 70-80 g m-2 yr-1 for Sphagnum, 30 g m-2 yr-1 for sedges and 40 g m-2 yr-1 for shrubs (Bartsch and Moore, 1985; Moore, 1989). Combining the NPP sensitivity values (Moore, 1989) with these annual NPP values suggests our assumption of a 1°C decrease in temperature causing a productivity reduction of 28% may not be unrealistic. No data is available on decay sensitivity to annual-scale temperature variations for these sites. It appears reasonable to expect productivity and decay to be affected to some degree by temperature; hence, their consideration in scenarios 3, 5, and 6. For a similar reason to the interpretation of temperature changes used in the model, we do not report on absolute water levels relative to the surface in the Results. The DigiBog output simply shows whether the water table was relatively deep, or close to the peat surface. As noted earlier, DigiBog is used here to help gauge what factors or combination of factors
may be required to cause persistent shifts in the surface wetness of the peatland such as
that at Abeille. 440 441 442 443 444 445 446 447 448 449 450 451 452 453 454 455 456 457 458 459 460 461
Paleoecological evidence in support of scenario 5 as the explanation of aqualysis
The output of the various scenarios suggest specific changes that were likely necessary for aqualysis to occur. Now we consider how the suggested cooling, wetting and decreased runoff may be translated into peatland processes, taking account of the bioclimatic position of the Abeille peatland and the regional geomorphology.
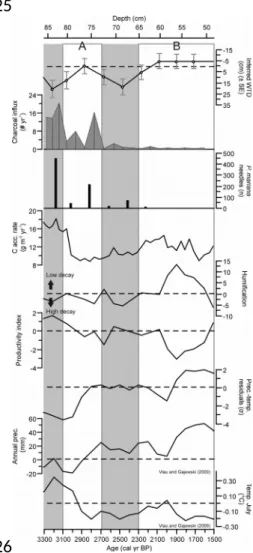
Reconstructed annual precipitation and average July temperatures for northern Quebec, using pollen data (Viau and Gajewski, 2009), show no clear shift at the onset of aqualysis, which occurred at Abeille around 2400-2100 cal yr BP, but they do indicate an increase in precipitation and a decrease in temperature around 2000 cal yr BP, which falls within the 95% confidence interval of the Abeille-5 age-depth model (Figures 3 and 6). Garneau et al. (2017) reconstructed pool formation in the Laforge region between 4200 and 2500 cal yr BP by dating peat horizons underneath the pools, but suggested the obtained ages may have been somewhat overestimated due to ongoing decomposition as pools deepen (Karofeld and Tõnisson, 2014). Other studies from northern Quebec suggest permafrost aggradation and a slowdown in C accumulation started in subarctic peatlands around 2000 cal yr BP (Allard and Seguin, 1987; Bhiry and Robert, 2006; Lamarre et al., 2012), which corroborates our scenario of cooling and the minimal age for aqualysis to occur.
462 463 464 465 466 467 468 469 470 471 472 473 474 475 476 477 478 479 480 481 482
The humification record of Abeille-5 shows a decrease in peat humification between 2090 and 1910 cal yr BP, with minimal values at 1910 cal yr BP (Figure 6). However, the timing of the events that generated this humification record may be delayed, due to secondary decomposition of peat in the zone where the water table fluctuates (Morris et al., 2015b). In this case of a decrease in humification, the apparent timing of the wet shift from the humification data is later than the actual timing of the event. A lagged limited humification, possibly driven by a wet shift around 2000 cal yr BP, coincides with the appearance of S. majus, which may be more resistant to decay than the herbaceous vegetation that it replaced (Scheffer et al., 2001). The rates of C accumulation during this period remained relatively stable; the combination of decreasing humification and these stable C accumulation rates suggests that productivity likely declined. This trend is in agreement with the cold shift and its effect on organic matter production that the exploratory modelling suggests is necessary for aqualysis to occur. In the remainder of the late-Holocene, C accumulation rates were stable, but relatively low: the cold climate and wet conditions likely limited decay, but probably more importantly, productivity.
In the conceptual models, rapid, persistent aqualysis was only achieved when a reduced flow towards the margins was included. This effect may also be interpreted as representing a flow into the peatland of water from the bounding slopes. Although DigiBog cannot currently simulate water quality effects on peatland processes, we estimate such an input would likely have had a positive effect on decay rates, countering to some extent the effects of reduced temperature. Such an increase in nutrient 483 484 485 486 487 488 489 490 491 492 493 494 495 496 497 498 499 500 501 502 503 504
availability and increased decay would have caused a lower permeability of the peat that resulted from this decay. The lower permeability would have further impeded water flow from the center of the peatland towards the margins (Hoag and Price, 1995) and possibly accentuated a water-table rise both in the center and at the margins of the peatland (Morris et al., 2015a).
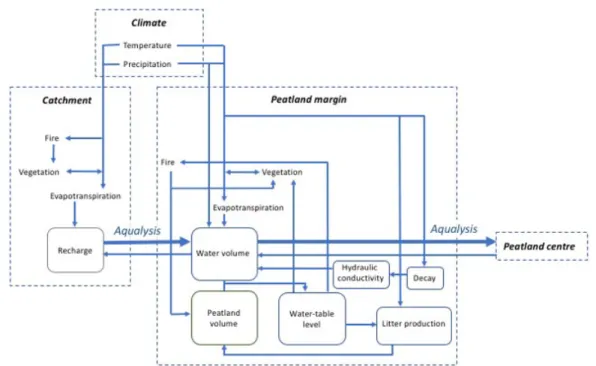
An enhanced minerotrophic input, which was suggested by paleoecological methods, may have been the result of an increase in precipitation, combined with a decrease in evapotranspiration both in the peatland and in the surrounding forest, together contributing to increasing recharge in the catchment (Figure 5). Catchment recharge can also be highly sensitive to the composition and density of the vegetation cover. Neoglacial forest opening was reconstructed in subarctic Quebec, likely driven by an intensification of fire regimes and slow, cold-limited post-fire regeneration (Asselin and Payette, 2005; Payette and Gagnon, 1985). If this phenomenon were extended to the Laforge region, a resulting sparse vegetation on hillslopes and cooler conditions may have allowed for enhanced water storage in the watershed as evapotranspiration was reduced. As a result, inflow towards the peatland may have further increased. Our charcoal influx record showed high values between 3700 and 3100 cal yr BP, when the peatland was ombrotrophic and dominated by stands of Picea and S. fuscum (Figures 4 and 6), but an absence after 2400 cal yr BP. Both the trend in the record and the size of the charcoal fragments quantified (> 1 mm) suggest peatland burning was more important before 3100 cal yr BP, yet this may be mostly a local (peatland) effect, driven 505 506 507 508 509 510 511 512 513 514 515 516 517 518 519 520 521 522 523 524 525 526
by a peatland vegetation cover initially dominated by a presence of Picea; inferences on the fire frequency at the scale of the catchment or beyond are therefore uncertain. The gradually increasing mineral influx during the last 2000 years, attaining ~2 g m-2 yr-1 at 200 cal yr BP (Figure 4), likely reflects enhanced mineral input at the watershed scale or reduced peat accumulation, because an estimate of dust influx in an ombrotrophic complex ~350 km west of this region showed no clear late-Holocene trend (Pratte et al., 2017).
Our conceptual modelling suggests that, besides shifts in temperature and precipitation, aqualysis may have been caused by an increase in surface and groundwater inflow, driven by an increase in precipitation but combined with the opening of the forest cover. The latter trend was possibly influenced by an intensified fire regime, which reduced regeneration (Figure 7). The importance of processes at the scale of the catchment for aqualysis is supported by the positive relationship between degree of aqualysis and catchment area, explained by a higher potential water supply (White and Payette, 2016). The current influence of catchment drainage was also indicated by a measured sustained positive hydraulic gradient between upland forest and the Abeille peatland (Carrer et al., 2015). The relatively permeable fluvioglacial sediments underlying and surrounding the peatland may also have facilitated aquifer flow towards the ecosystem (Reeve et al., 2000), contributing to the rise in water tables.
527 528 529 530 531 532 533 534 535 536 537 538 539 540 541 542 543 544 545 546 547 548
Implications and recommendations
Our results suggest that subarctic poor fens are sensitive to climatic variability and may therefore be useful archives of climate change, but also that hydrological processes at the scale of the watershed may need to be considered while interpreting paleorecords. They also underline the importance of modelling for evaluating ecosystem sensitivity to environmental change. We showed that, for ecosystems located at the bioclimatic limit of ombrotrophic peatlands, the specific sensitivity to climatic cooling and wetting, increased water flow and mineral input may determine whether the ecosystem is vulnerable to aqualysis. We suggest future studies in these types of ecosystems consider climate effects on hydrology beyond the peatland ecosystem itself, i.e. at the scale of the catchment.
CONCLUSION
The conceptual models, applied to a subarctic fen and in part evaluated using DigiBog, suggest that the ecosystem shift from a treed, ombrotrophic Picea-Sphagnum bog to a poor minerotrophic state with abundant pools likely occurred under cooler and wetter climatic conditions, combined with an enhanced water flow from the catchment towards the peatland. The various scenarios included in this study allowed us to identify the cold shift as being essential for a relatively rapid and persisting aqualysis to occur. This cooling 549 550 551 552 553 554 555 556 557 558 559 560 561 562 563 564 565 566 567 568 569 570
likely caused a reduction in organic matter production that exceeded the negative effect on decay rates, which therefore resulted in a decrease in vertical accumulation rates. Enhanced input of minerotrophic water would have been necessary to explain the increase in minerotrophy during the late-Holocene. The conceptual models suggest that climatic forcing was essential for aqualysis to occur, but the catchment topography of the Laforge region likely contributed to the potential for aqualysis.
ACKNOWLEDGEMENTS
Funding was provided by an Engage NSERC project to Michelle Garneau (EGP492141-15) in collaboration with the industrial partner Stornoway Diamond Corporation. Thanks to our industrial partner, and specifically Benjamin Jacob, for support in the field. We are grateful to Dr André Viau (University of Ottawa) for providing data on climate reconstructions. We highly appreciate the comments of Peter Langdon (Associate Editor) and two anonymous reviewers which improved the initial manuscript.
REFERENCES
Allard, M., Seguin, M.K., 1987. The Holocene evolution of permafrost near the tree line, on the eastern coast of Hudson Bay (northern Quebec). Canadian Journal of Earth
Sciences 24, 2206-2222. 571 572 573 574 575 576 577 578 579 580 581 582 583 584 585 586 587 588 589 590 591 592
Arlen-Pouliot, Y., Payette, S., 2015. The influence of climate on pool inception in boreal fens. Botany 93, 637-649.
Asselin, H., Payette, S., 2005. Late Holocene opening of the forest tundra landscape in northern Québec, Canada. Global Ecology and Biogeography 14, 307-313.
Baird, A.J., Morris, P.J., Belyea, L.R., 2012. The DigiBog peatland development model 1: rationale, conceptual model, and hydrological basis. Ecohydrology 5, 242-255.
Bartsch, I., Moore, T.R., 1985. A preliminary investigation of primary production and decomposition in four peatlands near Schefferville, Québec. Canadian Journal of Botany 63, 1241-1248.
Belyea, L.R., Clymo, R.S., 2001. Feedback control of the rate of peat formation.
Proceedings of the Royal Society B: Biological Sciences 268, 1315-1321.
Belyea, L.R., Lancaster, J., 2002. Inferring landscape dynamics of bog pools from scaling relationships and spatial patterns. Journal of ecology 90, 223-234.
Berger, A., Loutre, M.F., 1991. Insolation values for the climate of the last 10 million years. Quaternary Science Reviews 10, 297-317.
Bhiry, N., Robert, É.C., 2006. Reconstruction of changes in vegetation and trophic conditions of a palsa in a permafrost peatland, subarctic Québec, Canada. Ecoscience 13, 56-65.
Blaauw, M., Christen, J.A., 2011. Flexible paleoclimate age-depth models using an autoregressive gamma process. Bayesian Analysis 6, 457-474.
Blackford, J.J., Chambers, F.M., 1993. Determining the degree of peat decomposition for peat-based palaeoclimatic studies. International Peat Journal 5, 7-24.
593 594 595 596 597 598 599 600 601 602 603 604 605 606 607 608 609 610 611 612 613 614
Booth, R.K., 2010. Testing the climate sensitivity of peat-based paleoclimate reconstructions in mid-continental North America. Quaternary Science Reviews 29, 720-731.
Booth, R.K., Jackson, S.T., 2003. A high-resolution record of late-Holocene moisture variability from a Michigan raised bog, USA. The Holocene 13, 863-876.
Bridgham, S.D., Pastor, J., Dewey, B., Weltzin, J.F., Updegraff, K., 2008. Rapid carbon response of peatlands to climate change. Ecology 89, 3041-3048.
Carrer, G.E., Rousseau, A.N., St-Hilaire, A., Jutras, S., 2015. Mosaic surface storages of a small boreal catchment. Hydrological Processes 29, 845-858.
Charman, D.J., 2007. Summer water deficit variability controls on peatland water-table changes: implications for Holocene palaeoclimate reconstructions. The Holocene 17, 217-227.
Charman, D.J., Barber, K.E., Blaauw, M., Langdon, P.G., Mauquoy, D., Daley, T.J., Hughes, P.D.M., Karofeld, E., 2009. Climate drivers for peatland palaeoclimate records.
Quaternary Science Reviews 28, 1811-1819.
Cliche Trudeau, N., Garneau, M., Pelletier, L., 2012. Methane fluxes from a patterned fen of the northeastern part of the La Grande river watershed, James Bay, Canada.
Biogeochemistry 113, 409-422.
Cliche Trudeau, N., Garneau, M., Pelletier, L., 2014. Interannual variability in the CO2 balance of a boreal patterned fen, James Bay, Canada. Biogeochemistry 118, 371-387. Comas, X., Slater, L., Reeve, A., 2011. Pool patterning in a northern peatland: Geophysical evidence for the role of postglacial landforms. J Hydrol 399, 173-184.
615 616 617 618 619 620 621 622 623 624 625 626 627 628 629 630 631 632 633 634 635 636
Dean, W.E., 1974. Determination of carbonate and organic matter in calcareous sediments and sedimentary rocks by loss on ignition; comparison with other methods.
Journal of Sedimentary Research 44, 242-248.
Dissanska, M., Bernier, M., Payette, S., 2009. Object-based classification of very high resolution panchromatic images for evaluating recent change in the structure of patterned peatlands. Canadian Journal of Remote Sensing 35, 189-215.
Foster, D., Wright Jr, H., Thelaus, M., King, G., 1988a. Bog development and landform dynamics in central Sweden and south-eastern Labrador, Canada. Journal of Ecology 76, 1164-1185.
Foster, D.R., Fritz, S.C., 1987. Mire development, pool formation and landscape processes on patterned fens in Dalarna, central Sweden. Journal of Ecology 75, 409-437. Foster, D.R., King, G.A., Santelmann, M.V., 1988b. Patterned fens of western Labrador and adjacent Quebec: phytosociology, water chemistry, landform features, and dynamics of surface patterns. Canadian Journal of Botany 66, 2402-2418.
Frolking, S., Roulet, N.T., Tuittila, E., Bubier, J.L., Quillet, A., Talbot, J., Richard, P., 2010. A new model of Holocene peatland net primary production, decomposition, water balance, and peat accumulation. Earth System Dynamics 1, 1-21.
Garneau, M., Tremblay, L., Magnan, G., 2017. Holocene pool formation in oligotrophic fens from boreal Québec in northeastern Canada. The Holocene.
Hoag, R.S., Price, J.S., 1995. A field-scale, natural gradient solute transport experiment in peat at a Newfoundland blanket bog. Journal of Hydrology 172, 171-184.
637 638 639 640 641 642 643 644 645 646 647 648 649 650 651 652 653 654 655 656 657
Holling, C.S., 1996. Engineering resilience versus ecological resilience. Engineering within
ecological constraints 31, 32.
Hopkinson, R.F., McKenney, D.W., Milewska, E.J., Hutchinson, M.F., Papadopol, P., Vincent, L.A., 2011. Impact of aligning climatological day on gridding daily maximum-minimum temperature and precipitation over Canada. Journal of Applied Meteorology
and Climatology 50, 1654-1665.
Hutchinson, M.F., McKenney, D.W., Lawrence, K., Pedlar, J.H., Hopkinson, R.F., Milewska, E., Papadopol, P., 2009. Development and testing of Canada-wide interpolated spatial models of daily minimum–maximum temperature and precipitation for 1961–2003.
Journal of Applied Meteorology and Climatology 48, 725-741.
Karofeld, E., Tõnisson, H., 2014. Spatio-temporal changes in bog pool bottom topography – temperature effect and its influence on pool development: an example from a raised bog in Estonia. Hydrological Processes 28, 958-968.
Laine, J., Harju, P., Timonen, T., Laine, A., Tuittila, E.-S., Minkkinen, K., Vasander, H., 2009. The Intricate Beauty of Sphagnum Mosses-a Finnish Guide to Identification. Department of Forest Ecology, University of Helsinki, University of Helsinki, Department of Forest Ecology.
Lamarre, A., Garneau, M., Asnong, H., 2012. Holocene paleohydrological reconstruction and carbon accumulation of a permafrost peatland using testate amoeba and macrofossil analyses, Kuujjuarapik, subarctic Québec, Canada. Review of Palaeobotany
and Palynology 186, 131-141. 658 659 660 661 662 663 664 665 666 667 668 669 670 671 672 673 674 675 676 677 678
Lamarre, A., Magnan, G., Garneau, M., Boucher, É., 2013. A testate amoeba-based transfer function for paleohydrological reconstruction from boreal and subarctic peatlands in northeastern Canada. Quaternary International 306, 88-96.
Lamentowicz, M., Gałka, M., Lamentowicz, Ł., Obremska, M., Kühl, N., Lücke, A., Jassey, V.E.J., 2015. Reconstructing climate change and ombrotrophic bog development during the last 4000 years in northern Poland using biotic proxies, stable isotopes and trait-based approach. Palaeogeography, Palaeoclimatology, Palaeoecology 418, 261-277. Loisel, J., Gallego-Sala, A.V., Yu, Z., 2012. Global-scale pattern of peatland Sphagnum growth driven by photosynthetically active radiation and growing season length.
Biogeosciences 9, 2737-2746.
Magnan, G., Garneau, M., 2014. Climatic and autogenic control on Holocene carbon sequestration in ombrotrophic peatlands of maritime Quebec, eastern Canada. The
Holocene 24, 1054-1062.
Marcisz, K., Tinner, W., Colombaroli, D., Kołaczek, P., Słowiński, M., Fiałkiewicz-Kozieł, B., Łokas, E., Lamentowicz, M., 2015. Long-term hydrological dynamics and fire history over the last 2000 years in CE Europe reconstructed from a high-resolution peat archive.
Quaternary Science Reviews 112, 138-152.
Mauquoy, D., Yeloff, D., van Geel, B., Charman, D.J., Blundell, A., 2008. Two decadally resolved records from north-west European peat bogs show rapid climate changes associated with solar variability during the mid-late Holocene. Journal of Quaternary
Science 23, 745-763. 679 680 681 682 683 684 685 686 687 688 689 690 691 692 693 694 695 696 697 698 699
McKenney, D.W., Hutchinson, M.F., Papadopol, P., Lawrence, K., Pedlar, J., Campbell, K., Milewska, E., Hopkinson, R., Price, D., Owen, T., 2011. Customized spatial climate models for North America. Bulletin of American Meteorological Society, 1612-1622.
Moore, T.R., 1989. Growth and net production of Sphagnum at five fen sites, subarctic eastern Canada. Canadian Journal of Botany 67, 1203-1207.
Morris, P.J., Baird, A.J., Belyea, L.R., 2012. The DigiBog peatland development model 2: ecohydrological simulations in 2D. Ecohydrology 5, 256-268.
Morris, P.J., Baird, A.J., Belyea, L.R., 2015a. Bridging the gap between models and measurements of peat hydraulic conductivity. Water Resources Research 51, 5353-5364. Morris, P.J., Baird, A.J., Young, D.M., Swindles, G.T., 2015b. Untangling climate signals from autogenic changes in long-term peatland development. Geophysical Research
Letters 42, 10,788-710,797.
Ohlson, M., Økland, R.H., 1998. Spatial variation in rates of carbon and nitrogen accumulation in a boreal bog. Ecology 79, 2745-2758.
Payette, S., Gagnon, R., 1985. Late Holocene deforestation and tree regeneration in the forest-tundra of Quebec. Nature 313, 570-572.
Payette, S., Rochefort, L., 2001. Écologie des tourbières du Québec-Labrador. Les presses de l'Université Laval, Ste-Foy.
Pratte, S., Garneau, M., De Vleeschouwer, F., 2017. Increased atmospheric dust deposition during the Neoglacial in a boreal peat bog from north-eastern Canada.
Palaeogeography, Palaeoclimatology, Palaeoecology 469, 34-46.
700 701 702 703 704 705 706 707 708 709 710 711 712 713 714 715 716 717 718 719 720
R Core Team, 2016. R: A language and environment for statistical computing. R Foundation for Statistical Computing, Vienna, Austria.
Reeve, A.S., Siegel, D.I., Glaser, P.H., 2000. Simulating vertical flow in large peatlands.
Journal of Hydrology 227, 207-217.
Rinne, J., Riutta, T., Pihlatie, M., Aurela, M., Haapanala, S., Tuovinen, J.-P., Tuittila, E.-S., Vesala, T., 2007. Annual cycle of methane emission from a boreal fen measured by the eddy covariance technique. Tellus B 59, 449-457.
Robinson, S., 2008. Conceptual Modelling for Simulation Part I: Definition and Requirements. The Journal of the Operational Research Society 59, 278-290.
Ruuhijärvi, R., 1983. The Finnish mire types and their regional distribution, in: Gore, A.J.P. (Ed.), Ecosystems of the World 4B. Mires: swamp, bog, fen and moor. Regional
studies. Elsevier Scientific Publishing Co., Amsterdam.
Scheffer, R.A., Van Logtestijn, R.S.P., Verhoeven, J.T.A., 2001. Decomposition of Carex and Sphagnum litter in two mesotrophic fens differing in dominant plant species. Oikos 92, 44-54.
Schoning, K., Charman, D.J., Wastegård, S., 2005. Reconstructed water tables from two ombrotrophic mires in eastern central Sweden compared with instrumental meteorological data. The Holocene 15, 111-118.
Sillasoo, Ü., Mauquoy, D., Blundell, A., Charman, D., Blaauw, M., Daniell, J.R.G., Toms, P., Newberry, J., Chambers, F.M., Karofeld, E., 2007. Peat multi-proxy data from Männikjärve bog as indicators of late Holocene climate changes in Estonia. Boreas 36, 20-37. 721 722 723 724 725 726 727 728 729 730 731 732 733 734 735 736 737 738 739 740 741 742
Sjors, H., 1983. Mires of Sweden, in: Gore, A.J.P. (Ed.), Ecosystems of the World 4B.
Mires: Swam, Bog, Fen and Moor. Regional Studies. Elsevier Scientific Publishing Co.,
Amsterdam.
Swindles, G.T., Blundell, A., Roe, H.M., Hall, V.A., 2010. A 4500-year proxy climate record from peatlands in the North of Ireland: the identification of widespread summer 'drought phases'? Quaternary Science Reviews 29, 1577-1589.
Swindles, G.T., Morris, P.J., Baird, A.J., Blaauw, M., Plunkett, G., 2012. Ecohydrological feedbacks confound peat-based climate reconstructions. Geophysical Research Letters 39.
Tardif, S., St-Hilaire, A., Roy, R., Bernier, M., Payette, S., 2009. Statistical properties of hydrographs in minerotrophic fens and small lakes in mid-latitude Québec, Canada.
Canadian Water Resources Journal 34, 365-380.
Väliranta, M., Korhola, A., Seppa, H., Tuittila, E.S., Sarmaja-Korjonen, K., Laine, J., Alm, J., 2007. High-resolution reconstruction of wetness dynamics in a southern boreal raised bog, Finland, during the late Holocene: A quantitative approach. The Holocene 17, 1093-1107.
van Bellen, S., Garneau, M., Ali, A.A., Lamarre, A., Robert, É.C., Magnan, G., Asnong, H., Pratte, S., 2013. Poor fen succession over ombrotrophic peat related to late Holocene increased surface wetness in subarctic Quebec, Canada. Journal of Quaternary Science 28, 748-760. 743 744 745 746 747 748 749 750 751 752 753 754 755 756 757 758 759 760 761 762
van Bellen, S., Garneau, M., Booth, R.K., 2011. Holocene carbon accumulation rates from three ombrotrophic peatlands in boreal Quebec, Canada: Impact of climate-driven ecohydrological change. The Holocene 21, 1217-1231.
van Geel, B., Renssen, H., 1998. Abrupt climate change around 2,650 BP in North-West Europe: evidence for climatic teleconnections and a tentative explanation, in: Brown, N., Issar, A.S. (Eds.), Water, Environment and Society in Times of Climatic Change. Kluwer Academic Publishers, pp. 21-41.
Viau, A.E., Gajewski, K., 2009. Reconstructing millennial-scale, regional paleoclimates of boreal Canada during the Holocene. Journal of Climate 22, 316-330.
Viau, A.E., Gajewski, K., Sawada, M.C., Fines, P., 2006. Millennial-scale temperature variations in North America during the Holocene. Journal of Geophysical Research 111. White, M., Payette, S., 2016. Pool size structure indicates developmental stages of boreal fens. Botany 94, 643-651.
Young, D.M., Baird, A.J., Morris, P.J., Holden, J., 2017. Simulating the long term impacts‐ of drainage and restoration on the ecohydrology of peatlands. Water Resources
Research 53, 6510–6522.
Zoltai, S.C., 1995. Permafrost distribution in peatlands of West-Central Canada during the Holocene Warm Period 6000 years BP. Géographie physique et Quaternaire 49, 45-54.
Figure 1: Laforge peatland reconstructed water tables since 4000 cal yr BP, pooled in 200-year bins. Boxes represent medians, upper and lower quartiles and outliers.
763 764 765 766 767 768 769 770 771 772 773 774 775 776 777 778 779 780 781 782 783 784
785 786
Figure 2: Bioclimatic positioning of patterned fens and documented aqualyzed peatland regions. Left: position of the Laforge region, Monts Otish region (1), Plateau du lac du Sable region (2) and the Foster et al. (1988b) patterned fen region within the Quebec ‘climate space’, as defined by annual precipitation and growing season cumulative shortwave radiation values. Each point represents a spatial unit for which climate data were available, with points marked according to the vegetation distribution from Payette and Rochefort (2001). Right: location of the patterned fen regions in Quebec. The approximate southern limit of peatland permafrost features (palsas) is based on Payette and Rochefort (2001). 788 789 790 791 792 793 794 795 796 797 798
Figure 3: Age-depth model, C density and C accumulation rate reconstruction for Abeille-5. The apparent increase in vertical accumulation near the surface represents the acrotelm, characterized by ongoing oxic decay.
799 800 801 802
Figure 4: Variations in testate amoeba assemblages, inferred water-table depths, main plant macrofossils and peat physical characteristics along the Abeille-5 core. Period A represents an initial, non-persisting increase in water-table levels while period B shows a persisting water-table rise (aqualysis) with testate amoeba assemblages and plant macrofossils suggesting surface inundation.
804 805 806 807 808 809
Figure 5: Conceptual model scenarios, DigiBog output and visual representation of ecosystem processes. The ecosystem dynamics resulting from model output, shown at the right, were not specifically modelled but represent interpretations of the trends. For instance, the ‘+’ sign indicates increased minerotrophy from enhanced catchment water inflow in scenarios 4 and 5. This inflow was not explicitly modelled but was represented by a reduced lateral loss of water from the peatland.
810 811 812 813 814 815 816 817
Model input 1 2 3 4 5 6
• Constant P-E and T
• 20% increase in P-E • 20% increase in P-E • 17% temperature-induced decrease in production • 4% reduction in decay • 20% increase in P-E • 30% reduced flow to margin • 17% temperature-induced decrease in production • 4% reduction in decay • 20% increase in P-E • 30% reduced flow to margin • 20% increase in P-E • 28% temperature-induced decrease in production • 9% reduction in decay
Scenario Water-table dynamics Ecosystem state
+ + + + ++ + P-E P-E P-E P-E P-E P-E + +++ + + + P-E P-E P-E P-E 818
Figure 6: Ecohydrological, C accumulation rate, charcoal influx, P. mariana needle abundance and humification records from Abeille peatland combined with climate reconstructions from northern Quebec (Viau and Gajewski, 2009). Temperature and precipitation records are expressed as anomalies. Climate reconstructions were obtained from Viau and Gajewski (2009) and the precipitation–temperature residuals of z-scores were recalculated from their published records.
819 820 821 822 823 824 825 826
Figure 7: Processes contributing to aqualysis. Inflow from the catchment to the peatland margin, also impeding drainage from the center to the margin of the peatland, may have contributed to the increase in minerotrophy and aqualysis.
827 828 829 830 831 832