Degradation Mechanism in La0.8Sr0.2CoO3 [La
subscript 0.8 Sr subscript 0.2 CoO subscript 3] as
Contact Layer on the Solid Oxide Electrolysis Cell Anode
The MIT Faculty has made this article openly available.
Please share
how this access benefits you. Your story matters.
Citation
Sharma, Vivek Inder, and Bilge Yildiz. “Degradation Mechanism
in La[sub 0.8]Sr[sub 0.2]CoO[sub 3] as Contact Layer on the Solid
Oxide Electrolysis Cell Anode.” Journal of The Electrochemical
Society 157, 3 (2010): B441. ©2010 The Electrochemical Society
As Published
http://dx.doi.org/10.1149/1.3288835
Publisher
Electrochemical Society
Version
Final published version
Citable link
http://hdl.handle.net/1721.1/66223
Terms of Use
Article is made available in accordance with the publisher's
policy and may be subject to US copyright law. Please refer to the
publisher's site for terms of use.
Degradation Mechanism in La
0.8Sr
0.2CoO
3as Contact Layer
on the Solid Oxide Electrolysis Cell Anode
Vivek Inder Sharma and Bilge Yildiz
*
,zLaboratory for Electrochemical Interfaces, Department of Nuclear Science and Engineering, Massachusetts Institute of Technology, Cambridge, Massachusetts 02139, USA
Detailed chemical and structural analyses are presented for the degradation mechanism of La0.8Sr0.2CoO3共LSC兲 as the contact
layer of solid oxide electrolysis cell共SOEC兲 anodes. SOEC stack cells, which were operated in the presence of Cr-containing interconnects, and reference half-cells, which were tested with Pt interconnects, were investigated. The as-prepared surface chemistry of LSC showed a spatially uniform A-site共La and Sr兲 enrichment. Undesirable secondary phases of Cr2O3, LaCrO3,
La2CrO6, and Co3O4were identified in the contact layer of the SOEC stack cells, which had significantly reduced electrochemical
performance after long-term testing. Auger electron spectroscopy and analytical transmission electron microscopy showed the presence of Cr throughout the layer cross section on the surface and in the bulk, respectively, with significant variations in the local chemistry at the micro- to nanoscale. Particularly, a long-range transport of Sr and Co cations out of the LSC phase to the top of the contact layer was evident. However, when tested with electrolytic potential and current without a Cr environment, the LSC contact layer composition remained stable. The dissociation of the LSC in the SOEC stack cells can be, most probably, driven by the La–Cr–O related thermodynamics under the electrolytic potential and oxygen pressure at the anode.
© 2010 The Electrochemical Society. 关DOI: 10.1149/1.3288835兴 All rights reserved.
Manuscript submitted September 30, 2009; revised manuscript received November 27, 2009. Published February 4, 2010.
High temperature electrolysis is one of the most efficient electro-chemical processes to convert electricity and steam or a mixture of steam and CO2 into H2 or syngas 共H2+ CO兲, respectively, using
electricity and heat from nuclear plants and concentrated solar plants.1,2 It is carried out in devices called solid oxide electrolytic cells 共SOECs兲 at high temperatures. High temperature decreases Gibbs’ free energy of the reaction and, thus, the electrical energy input required for the electrolysis in comparison to the electrolysis of water at room temperature. However, at the high temperature of operation共above 800°C兲, a loss in the rate of hydrogen 共or syngas兲 production due to material degradation has been observed. This ar-ticle investigates the mechanisms of degradation in the contact layer of SOECs, focusing on the diffusion of Cr species from the stainless steel interconnects into the cell structure and the long-range trans-port and segregation of cations in the contact layer.
The basic principle of operation of SOECs is similar to that of solid oxide fuel cells共SOFCs兲; the difference being the reverse di-rection of current. An electrolytic cell consists of the hydrogen elec-trode共cathode兲 and the oxygen electrode 共anode兲 with an oxygen ion conducting electrolyte sandwiched between them. For the SO-ECs investigated in this paper, the hydrogen electrode consists of a Ni–scandia stabilized zirconia 共ScSZ兲 cermet. ScSZ 共10% Sc2O3–ZrO2兲 constitutes the electrolyte. Oxygen electrolyte
is composed of a perovskite oxide, A0.8Sr0.2MnO3共ASM兲.aAnother
perovskite oxide, La0.8Sr0.2CoO3 共LSC兲, is used as a contact layer between the oxygen electrode and the stainless steel interconnects. Ceramatec Inc. provided SOECs under analysis in this paper after 2000 continuous hours of their operation at 830°C.3,4
Degradation Mechanisms: Background
While a high operating temperature increases the efficiency of the SOECs, it also accelerates the degradation rate. This is princi-pally caused by the chemical interactions between the SOEC mate-rial constituents, as in SOFCs, resulting in the formation of second-ary phases that either block the active electrocatalytic sites or completely transform into inactive local phases.5 The secondary phases block the reaction and diffusion paths in the perovskite-type electrodes and contact layers, leading to a decrease in their conduc-tivity and electrocatalytic acconduc-tivity. For example, O’Brien et al. mea-sured an 18% loss in H2production rate over 1000 h of operation of
SOECs.6The SOECs investigated in this paper were operated at a constant thermal neutral voltage共1.3 V兲 at a temperature of 830°C, and the current density共initially at 400 mA/cm2兲 decreased by 40%
over 2000 h of operation, indicating severe degradation of the cells.3,4However, research to date has enabled a better understand-ing of the SOFC degradation mechanisms and has helped control the degradation rate in SOFC stacks down to lower than 2%/1000 h.7 On the other hand, a thorough investigation on the governing deg-radation mechanisms for SOECs is yet at its infancy, with recent attempts to elucidate and control the high degradation rate of the SOECs compared to SOFCs.8,9A recent study has presented a silica-related poisoning of the hydrogen/steam electrodes in SOEC, differ-ent from that expected in SOFC conditions.8This paper focuses on the material degradation on the oxygen electrode side of SOECs.
Cr poisoning of the oxygen electrode,10-21segregation of cations to the surface of the catalyst,22-24and interdiffusion of cations be-tween the electrolyte and oxygen electrode grains25were identified to be crucial processes leading to the degradation of SOFCs. At a high level, SOECs are expected to be subject to similar causes of degradation, which are of interest here. However, the exact mecha-nisms and the consequent secondary phases could be different from those in an SOFC operation because of the different thermodynamic and electrochemical conditions and the reverse path of ionic and electronic transport in SOECs compared to SOFCs.
The Cr-poisoning of the SOEC materials is the focus of this paper. Therefore, it is worth providing the main messages at this point from the extensively documented studies on the oxygen side 共cathode兲 of SOFCs on the Cr poisoning question10-21. Three main
hypotheses are found in literature to explain the progression of the Cr-poisoning mechanisms. The first hypothesis suggests that this process is initiated through the formation of Cr6+-containing gas-eous species, such as CrO3 or CrO2共OH兲2, from the oxidation of
chromium oxide on the interconnect.12,13The volatile Cr species are then reduced at the triple phase boundaries of electrode, electrolyte, and air and form solid Cr2O3 and other Cr-rich phases, thereby inhibiting the electrochemistry of the electrode and leading to polar-ization losses.14,16For example, the solid Cr2O3species could react with the perovskite cathode La1−xSrxMnO3 共LSM兲 to form
La1−xSrxMn1−yCryO3 and 共Cr1−yMny兲O1.5−␦, with the formation of
共Cr1−yMny兲O1.5−␦ spinel being the driving force for the reaction.16 Furthermore, Matsuzaki and Yasuda found that not only the SOFC cathode but also the electrolyte could influence the reduction of the volatile Cr-containing species due to the electrochemical state at the cathode/electrolyte interface.10The second hypothesis suggests that, along with the vapor phase reduction, solid-state diffusion of the Cr-containing species into the oxygen electrode and chemical
disso-*Electrochemical Society Active Member.
zE-mail: [email protected] a
The cation A is a proprietary information belonging to Ceramatec Inc. and is not disclosed here.
ciation of the electrode material are underlining mechanisms in the deposition of Cr.17Finally, the third and a more recent hypothesis by Zhen et al.18and Chen et al.19suggests that the Cr deposition pro-cess at the oxygen electrode is thermodynamically driven and kineti-cally limited by a nucleation reaction between the Cr species that is being transported and a “nucleation agent” on the electrode. In the LSM electrode, the nucleation agent was identified to be the man-ganese species共Mn2+兲, and for 共La,Sr兲共Co,Fe兲O
3共LSCF兲 electrode,
it was suggested to be the SrO species segregated at the electrode surface.18References also assert that the driving force for the depo-sition of Cr species at the LSM cathode is the generation of Mn2+ species, which then react with gaseous Cr species, forming Cr– Mn–O nuclei and, subsequently, the共Cr,Mn兲3O4spinel. In addition
to the electrode, the effects of Cr-related degradation have also been reported for the contact layer of SOFC cathodes. In that case, the formation of a less conducting oxide layer forming between the contact layer and the interconnect was suggested to be responsible for the degradation of the cells due to loss in the electronic path from the interconnect to the cathode.21Clearly, there is still no con-sensus about the exact and global mechanism of how Cr poisons the electrochemical performance of the electrodes due to the compli-cated dependencies on structure, operating temperature, atmosphere, and ionic and electronic conductivities. Furthermore, the stability of the possible reaction products between Cr and a given oxygen elec-trode material can differ between the SOFC and SOEC due to the different thermodynamic conditions at the corresponding electrodes. In addition to Cr poisoning, cation interdiffusion and segregation can adversely affect the performance of the cells through local ad-verse changes in the composition and structure. The cation interdif-fusion between the oxygen electrode and the electrolyte can lead to an electrochemically inferior layer or microstructure formation and has been the subject of detailed studies due to its importance in electrode activity and stability.22-24Similar to interdiffusion, but dif-ferent in location, segregation of cations in the electrodes of SOFCs is well documented.25Simner et al. observed that LSCF cathodes, operated for 500 h at 750°C, experience Sr enrichment at the cathode–electrolyte and cathode–current collector interfaces.25 In this study, the Sr/共La + Sr兲 ratio increased from 0.4 to 0.9 upon testing and was suggested to account for the increase in both the ohmic and non-ohmic resistances observed for the tested SOFCs. If the extent of such cation interdiffusion and segregation is small, it may not result in drastic changes in the bulk microstructure, and the original bulk phases could be retained, while the adverse effects would be limited to共critical兲 interfaces where segregation accumu-lates. However, if the movement and flux of cations is significant over the microstructure, these processes can as well compromise the phase stability and the global electrochemical properties of the cell materials.
Objective
The goal of the research presented in this paper is to identify the governing mechanisms for the loss in the electrochemical perfor-mance of the anode共oxygen electrode兲 contact layer 共LSC兲 leading to the performance degradation of the SOECs. Our specific objective is to identify how the Cr species from the stainless steel intercon-nects leads to the formation of electrochemically inactive phases dissociated from the LSC contact layer of the tested SOECs. In doing so, consideration of the A-site cation segregation on LSC in the context of Cr reactions is of importance.
Approach
We present the approach used in characterizing the materials’ chemistry and structure and the corresponding analyses. We em-ployed spectroscopy and microscopy techniques in an integrated manner, from a high level to a high resolution postmortem analysis. TableIdefines the nomenclature for the cells, which are presented in this article. We carried out the analysis on two batches of samples. One batch consisted of the 10 cm⫻ 10 cm full-cell SOECs pro-vided by Ceramatec Inc., both as-prepared and tested共referred to as
CER#1 and CER#2, respectively兲. This batch of samples was inves-tigated to identify the changes in microstructure and chemical com-position that were accompanied by their operation in the demonstra-tion tests at Idaho Nademonstra-tional Laboratory.3,4 The second batch of samples consisted of reference samples as half-cells that were oper-ated under controlled electrochemical conditions in air. This batch was analyzed to differentiate the mechanism of degradation of an LSC contact layer, as hypothesized, based on the findings from CER#1 and CER#2. These cells, denoted by REF#1 and REF#2, are comprised of ASM as both the anode and the cathode, LSC as the contact layer on both electrodes, and ScSZ as the electrolyte. A schematic of the reference cells is shown in Fig.1. REF#1 under-went both heat and electrochemical treatment, while REF#2 was subjected to heat-treatment alone. This distinction was made to fa-cilitate the identification of any changes occurring in the microstruc-ture of reference half-cells due to electrochemistry or thermal treat-ment conditions.
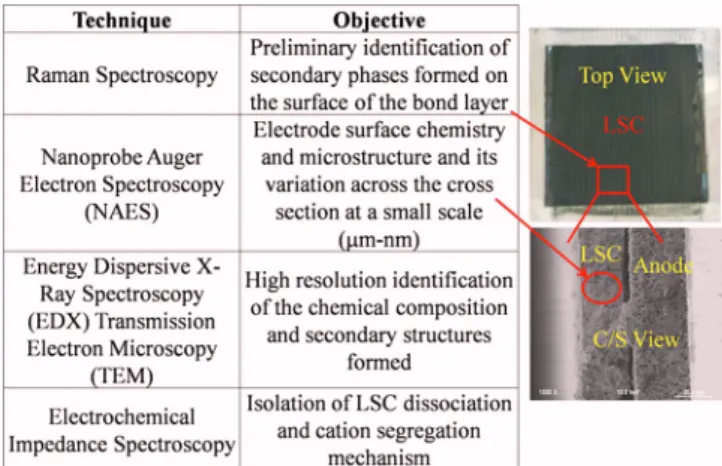
The techniques used and our particular objectives in utilizing each technique are summarized in Fig. 2. The first target of the research was the preliminary identification of the phases present on the top of the LSC contact layer near the interconnect. For this purpose, we performed Raman spectroscopy26measurements using a Kaiser Optical Instruments’ Halogram 5000 series Raman spec-trometer. A laser wavelength of 785 nm and collection fibers provid-ing a spot size of 80 m were employed. References 27-33 were used to identify the Raman peaks of the phases of interest found in our data.
We investigated the variation in the surface chemistry and micro-structure of the LSC contact layer across its cross section and on its top using scanning nanoprobe Auger electron spectroscopy 共NAES兲.34
NAES was performed using the Physical Electronics model 700 scanning Auger nanoprobe. Incident electrons having an
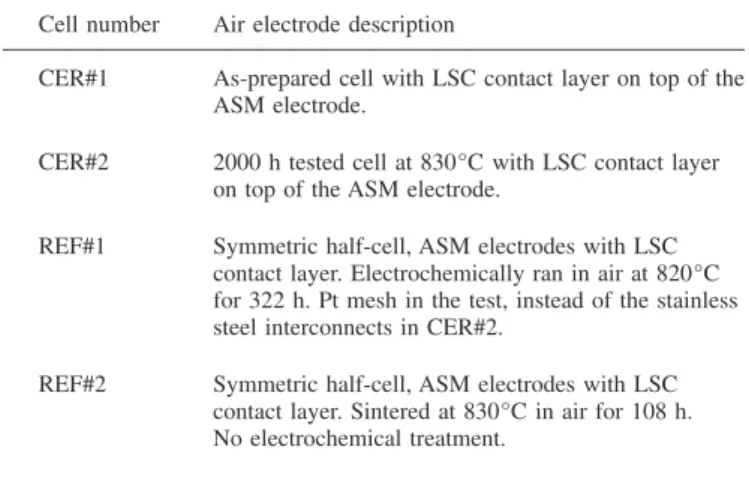
Table I. Nomenclature for the cells studied in this paper.
Cell number Air electrode description
CER#1 As-prepared cell with LSC contact layer on top of the ASM electrode.
CER#2 2000 h tested cell at 830°C with LSC contact layer on top of the ASM electrode.
REF#1 Symmetric half-cell, ASM electrodes with LSC contact layer. Electrochemically ran in air at 820°C for 322 h. Pt mesh in the test, instead of the stainless steel interconnects in CER#2.
REF#2 Symmetric half-cell, ASM electrodes with LSC contact layer. Sintered at 830°C in air for 108 h. No electrochemical treatment.
Figure 1. 共Color online兲 Schematic drawing of the reference half-cells in
this investigation:共a兲 cross-sectional view and 共b兲 top view.
B442 Journal of The Electrochemical Society, 157共3兲 B441-B448 共2010兲
energy of 10 keV were used, and smoothing and differentiation of the Auger electron spectroscopy共AES兲 spectra collected were car-ried out using the Savitsky–Golay algorithm.
To identify the length scale of the cation segregation and phase dissociation in the bulk of LSC grains at high resolution, transmis-sion electron microscopy共TEM兲35coupled with energy dispersive X-ray spectroscopy共EDX兲 was used. This technique complements the findings obtained from the NAES results: TEM/EDX provides information from the bulk of the microstructure, while data in NAES are essentially from the surface. The investigations of the different secondary phases formed at the LSC/interconnect and LSC/ASM interfaces were facilitated by preparing TEM samples from both regions. To prepare the TEM samples, a small portion of the LSC layer was physically lifted from the cells and glued to standard TEM grids made of Cu. The glued sample was then thinned down to electron transparency using a Gatan ion miller, with Ga ions accelerated through a potential of 5 kV. Scanning transmission elec-tron microscopy共STEM兲 elemental maps were carried out using a JEOL 2010F microscope having a field-emission electron source. The incident electron energy was 200 keV. The EDX microanalysis system, Oxford Instruments INCA, was used for collecting the EDX spectra. The point EDX spectra were acquired with an acquisition time of 300 s and a spot size of 2.4 nm. The quantification of the EDX data was obtained by a standardless analysis using the Cliff– Lorimer correction. For the STEM elemental maps, a JEOL detector was used. A probe of size 0.2 nm with a camera length of 15 cm was employed. The elemental maps were collected within 60–120 s each. To distinguish the possible causes of long-range cation transport and segregation in the LSC contact layer microstructure, electro-chemical tests were conducted on reference half-cells, where Cr and its species were taken out of the system by replacing the stainless steel interconnects used in CER#1 and CER#2 with Pt contact meshes on the LSC layer. To replicate the operating conditions, REF#1 was run in air under a constant current density of 0.40 A/cm2 共same as the initial current density for CER#1 and
CER#2兲 at 816°C for 13.5 continuous days. We carried out AES and electrochemical impedance spectroscopy 共EIS兲 on the reference cells: on REF#1, after the electrochemical operation and on REF#2, after the thermal treatment without electrochemistry.b
Results
A comparison between the Raman spectra from an as-prepared cell共CER#1兲 and a tested cell 共CER#2兲 is presented in Fig.3. Ra-man spectroscopy results showed that the LSC contact layer had
degraded, and the poorly conducting secondary phases were formed. Raman peaks belonging to Cr2O3,27 C,28 ZrO2,29 LaCrO3,30 La2CrO6,31LaCoO3,32and Co3O433were identified from previously
published literatures. The comparison between the conductivities, showing 2–6 orders of magnitude decrease in the conductivity of the secondary phases compared to the original LSC contact layer, is summarized in TableII.
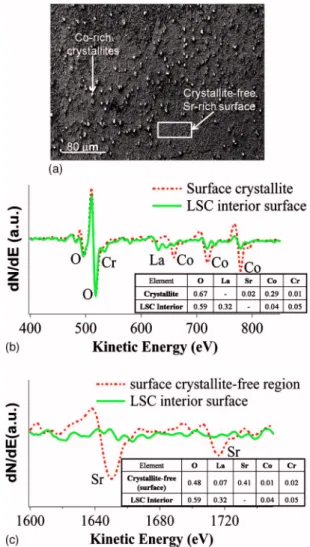
Figure 4a is an SEM image from the LSC cross section of CER#2 followed by the AES spectra from the three marked areas in Fig.4b. AES results show an average Cr fraction共averaged over all the sets of measurements兲 of approximately 7% 共normalized with respect to the sum of La, Co, and Cr content兲 on the surface of the LSC contact layer grains. Furthermore, the LSC layer exhibited lo-cal variation in chemilo-cal constituents on the surface of its grains with the La/Co ratio varying from 0.62 to 9.50 for the data shown in Fig.4. Over all the sets of measurements, the La/Co ratio for CER#2 varied to as high as 16.65. There was no detectable Sr signal, and only a small fraction of Co was identified as remaining on the LSC cross-sectional surface. Contrary to the LSC cross-sectional surface, the AES spectra at the top of LSC 共LSC/interconnect interface兲 showed the presence of Co-rich crystallites and a Sr-rich surface layer, as shown in Fig.5a. The Co-rich crystallites on the top lack La, whereas the LSC cross section had approximately 70% La 共nor-malized with respect to the sum of La, Co, and Cr content兲. Sr content in the crystallite-free top region varied from 15–81% with an average of 42%共normalized with respect to the sum of La, Sr, and Cr content兲. The AES spectra for Co and Sr showing this con-trast for the top and the cross section of LSC are presented in Fig.5b andc.
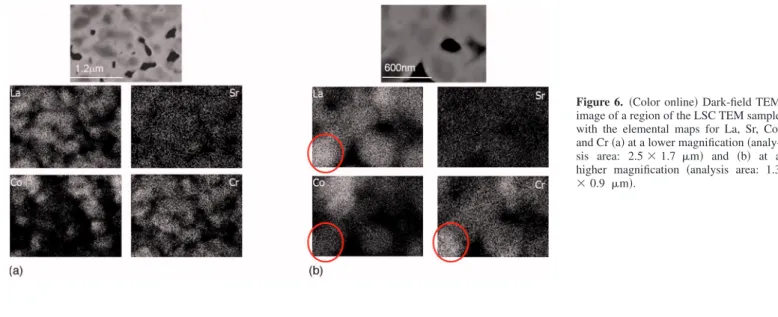
The dissociation of the LSC contact layer at a scale from a few micrometers to nanometers was studied by STEM elemental map-ping on the TEM samples taken from the contact layer both near the anode and the interconnect interfaces. The dark-field TEM images of different regions of a TEM sample prepared from the LSC/ interconnect interface region and the elemental maps for La, Sr, Co, and Cr at different length scales are shown in Fig.6. The point EDX analysis on the samples showed that Cr content in the LSC bulk 共normalized with respect to the sum of La, Sr, Co, and Cr content兲 varied from 10 to 33%. It is evident from Fig.6that regions rich in Cr are associated with a high La content and a low Co content and vice versa. Similar to the surface of the LSC grains probed by AES, the LSC bulk was also deficient in Sr with the maximum Sr content in the bulk being 4%. TableIIIpresents the chemical composition of one of the Cr-rich and Co-rich regions found in TEM samples pre-pared both from the LSC/interconnect and LSC/ASM interfaces. The La/Cr ratio in the bulk was nearly 2 and 1.5 for the regions representative of the LSC/interconnect interface and the LSC/ASM interface, respectively.
The Raman spectroscopy, AES, and TEM results indicate the inhomogeneous dissociation of the LSC contact layer accompanied by the segregation of the cations of LSC. We performed controlled bFor reference half-cells, because the LSC was sintered in situ, as in stack tests, the
AES measurements on them was not possible before their heat-treatment. There-fore, REF#2 serves the purpose of comparing only the electrochemical effects to the thermal effects on LSC.
Figure 2. 共Color online兲 Summary of the characterization techniques used
and their purpose.
Figure 3. 共Color online兲 Raman spectra from an as-prepared cell, CER#1,
compared to a tested cell, CER#2. The formation of secondary phases during the 2000 h test of the cell is evident from the difference in the two spectra with Raman peaks identified for the secondary phases.
EIS experiments on the reference half-cells, avoiding the presence of Cr in the electrical contacts to isolate the mechanism of cation segregation and LSC dissociation. The performance history curve for REF#1 is shown in Fig. 7. Under a constant applied current density of 0.40 A/cm2, the potential difference across the cell in-creased with time from an initial value of 0.23 V and stabilized at 0.42 V after 4.5 days of operation. Figure8compares the Nyquist plot for the anode共electrolytic mode兲 of REF#1 before and after the operation. The impedance of the anode increased from 0.07 to 0.83 ⍀ during operation. To identify whether the REF#1 degrada-tion was due to a similar composidegrada-tional dissociadegrada-tion as in CER#2, we compared the effects of just the thermal treatment without elec-trochemistry共REF#2兲 to that of electrochemistry at high tempera-ture共REF#1兲 on the surface chemical compositions of REF#1 and REF#2. Figure9 shows AES spectra from an area in each of the anodic contact layer of these two cells. Both REF#1 and REF#2 had similar chemical compositions on the contact layer surface, although the ratio of the A-site to B-site cations is 6.00 and 5.71, respectively, indicating a significant but similar level of segregation of the A-site cations to the surface. To investigate the differences in the CER#2 and REF#1 compositions, we compared their final surface chemistry after the electrochemical tests. The A-site to B-site ratio for REF#1 varied from 5.71–6.71 throughout the AES measurements made across the cross section of its anode-side contact layer. This indi-cates uniformity and stability of the near-surface compositions in
REF#1 as opposed to CER#2. A comparison between the AES spec-tra from an area in each of the cross section of the anodic contact layer of REF#1 and CER#2 is presented in Fig.10. The AES peak corresponding to Cr is evident in the spectrum from CER#2 and missing from REF#1, as expected, because CER#2 had stainless steel interconnects.
Discussion
Raman spectroscopy results clearly showed that the LSC contact layer had dissociated into secondary phases having a lower conduc-tivity than the original composition. The presence of Cr-containing phases, Cr2O3, LaCrO3, and La2CrO6, indicated Cr migration from the stainless steel interconnects into the originally LSC contact layer. The consequent severe decrease in the electronic conductivity of the contact layer, as shown in TableII, suggests that the degra-dation of the oxygen electrode performance should, in part, be due to the loss in its electronic activation because the contact layer no longer serves for its purpose.
In the SOFC cathode, due to a locally reducing environment, the formation and stability of La2CrO6is not expected. Regarding the thermodynamics of the La–Cr–O system, a recent study of thermo-dynamic calculations using CALPHAD 36showed that LaCrO3 is
stable up to 1000°C in an atmosphere ranging from pure O2 to PO
2= 10
−16.1 Pa. However, La
2CrO6forms within a wide
tempera-ture range above 700°C at PO
2 at and above 10
5 Pa. While the
Table II. Conductivity data for the secondary phases that were identified in the Raman spectra on the tested SOEC anode con-tact layer. Constituent Conductivity 共S/cm兲 Reference La0.6Sr0.4CoO3at 800°C 1.6⫻ 103 38 LaCoO3at 900°C 7.6⫻ 102 39 8 mol % Sc2O3–ZrO2at 800°C 4.8⫻ 10−2 40 Co3O4at 800°C 3.9⫻ 101 41 Cr2O3at 1000°C 1.0⫻ 10−3 42 LaCrO3at 800°C 3.4⫻ 10−1 43
Figure 4.共Color online兲 共a兲 SEM image of the cross section of cell CER#2,
LSC region.共b兲 AES data from points 1, 2, and 3 in 共a兲 with fractional content of the constituent elements in the inset table.
Figure 5. 共Color online兲 共a兲 SEM image of the top surface of the LSC
contact layer cell CER#2, showing Co-rich and Sr-rich phases. AES data from共b兲 one of the Co-rich crystallites on the top surface of LSC and 共c兲 the Sr-rich surface region free of Co-rich crystallites shown in共a兲 compared with the AES data from the LSC cross-sectional surface.
B444 Journal of The Electrochemical Society, 157共3兲 B441-B448 共2010兲
SOEC stacks are operated at atmospheric pressure, the local PO2in
the anode and contact layer of the cells can be greater than 105 Pa due to the generation and evolution of O2.37Such high PO2favors
the stability of La2CrO6, as shown in Ref.36, while the exact value
of local PO
2in the anode and LSC contact layer is not determined in
this paper. Thus, the findings reported in Ref.36 support that the secondary phases of lanthanum chromite and chromate formed were stable at the operating conditions of SOECs. This decomposition of the LSC perovskite structure leads to an adverse change in the elec-tronic properties of the contact layer. Thus, the decomposition of the
LSC perovskite into secondary, low conducting, and less active phases can be a chief cause for the SOEC performance degradation. The chemistry and microstructure of the surface of LSC grains significantly varied throughout the LSC cross section, as was shown by AES results. Figure4shows that significant differences in the local compositions and chemical signature at the surface of LSC grains existed even within a micrometer scale. The ratio of La to Co experienced a drastic departure from its stoichiometric value of 0.8 and varied from 0.65–9.50共for the data shown in Fig.4兲 and 0.65– 16.65 overall. The lack of Sr and only weak presense of Co in the cross section of LSC accompanied by Sr- and Co-enriched regions on the top of LSC共Fig.5兲 indicate that, in particular, the Sr and Co Table III. Chemical composition from the point EDX analysis on the TEM samples from the LSC/interconnect and the LSC/ASM interfaces and AES analysis on a representative area. TEM and AES results represent the bulk and surface compositions, respectively.
Element
Atom % LSC Bulk共TEM兲
TEM sample A共near the interconnect兲 TEM sample B共near the anode兲 LSC Surface共AES兲 Cr-rich region Co-rich region Cr-rich region Co-rich region Cr-rich region Co-rich region
La 54.9 22.4 50.0 23.1 28.0 37.0 Sr 2.8 2.8 4.2 3.8 — — Co 15.5 63.6 12.5 57.6 44.6 56.5 Cr 27.0 10.2 33.3 15.4 27.4 6.4 Co/Cr 0.57 6.24 0.38 3.74 1.63 8.78 La/Cr 2.03 2.20 1.50 1.50 1.02 5.75
Figure 6. 共Color online兲 Dark-field TEM
image of a region of the LSC TEM sample with the elemental maps for La, Sr, Co, and Cr共a兲 at a lower magnification 共analy-sis area: 2.5⫻ 1.7 m兲 and 共b兲 at a higher magnification 共analysis area: 1.3 ⫻ 0.9 m兲.
Figure 7. Cell performance and overpotential as a function of time for the
half-cell REF#1. Under a constant current density of 0.4 A/cm2at 816°C in
air, the potential difference across the cell increased with time and stabilized after about 120 h.
Figure 8.共Color online兲 Electrochemical impedance as Nyquist plot for the
anode of REF#1 before and after its operation. The impedance of the elec-trode increases from 0.07 to 0.83 ⍀ over the test period, indicating degra-dation on the “electrolytic” electrode共anode兲 of the cell.
cations migrated from the contact layer structure to the LSC/ interconnect interface. This indicates a long-range共over ⬃20 m兲 transport and an inhomogeneous segregation of the A- and B-site cations from the LSC layer, consequently leading to the dissociation of the perovskite LSC phase in the contact layer. The directions of the cations and charge carriers involved across the SOEC are sche-matically shown in Fig.11.
Complementary to the surface-sensitive AES results, the bulk-sensitive TEM/EDX results showed that the Cr content in LSC var-ied at 10–33%, larger than at the LSC surface, indicating different mechanisms of Cr reaction at LSC surface vs bulk. Results for Sr were consistent with those from AES: a maximum of only 4% found in the bulk of LSC and below the detection limit on the surface. The results from TEM/EDX confirm the severe dissociation of LSC and show that the secondary phase formation was on the nanoscale共Fig. 6兲. The nanoscale Cr-rich regions were associated with enrichment of La and depletion of Co, indicating a new phase between Cr and La. The La/Cr ratio of 2 in the LSC/interconnect interface region indicates the presence of La2CrO6. The drop of the La/Cr ratio to 1.5
near the anode suggests the formation of different chemical phases
near the LSC/interconnect and LSC/ASM interfaces in the contact layer. An increase in the Cr content共relative to La兲 near the anode could suggest the presence of LaCrO3and/or Cr2O3near the anode.
Co-containing phase is likely to be Co3O4. This is consistent with the Raman spectroscopy results indicating their presence at the top of the contact layer upon long-term testing.
Upon these observations, we hypothesize that the long-range transport of Sr and Co can be driven by two primary mechanisms: 共i兲 Cr-related thermodynamics, where the Cr-containing species 共in the vicinity of the interconnect兲 could thermodynamically favor the presence of select cations共i.e., Sr and Co兲 at the region interfacing the interconnect and共ii兲 the electronic or oxygen ion current carry-ing the cations along the same direction. To test these hypotheses and isolate the actual mechanism共s兲 for severe cation segregation and phase separation in the LSC contact layer, REF#1 was operated in controlled electrochemical environments. The increase in poten-tial difference across the reference cell shown in Fig.7 indicated that cell REF#1 degraded with time even in the absence of Cr-containing interconnects or other possible Cr species in the testing environment. The cell potential doubled 共from 0.23 to 0.42 V兲 within 5 days before eventually stabilizing. Nyquist plot on the an-ode of REF#1 in Fig. 8 shows that the impedance of the anode increased by 0.76 ⍀ during its operation. The significant degrada-tion observed in this experiment suggests that there exists at least one other mechanism that contributes to the degradation even in the absence of Cr poisoning in this particular experiment. Figure9 sug-gests that there was no significant difference in the chemical com-positions and microstructure of the LSC contact layer of the heat-treated cells without electrochemistry 共REF#2兲 and the cells that were operated under a constant current density共REF#1兲. The A-site to B-site cation ratio for the contact layer of REF#1 and REF#2 varied from 5.71 to 6.71. Even though the contact layer composition for REF#1 and REF#2 was uniform, it was A-site enriched. How-ever, for CER#2, the dissociation of LSC across its cross section was drastically nonuniform, with A-site to B-site cation ratio for CER#2 varying from 0.65 to 16.65. Thus, cation segregation in CER#2 was far more severe than in REF#1 and REF#2. Further-more, as evident in Fig. 10, REF#1 has considerable Sr and Co content on the LSC cross-sectional surface, while the cross section of CER#2 was depleted in Sr and Co cations even though both the REF#1 constant current density and the CER#2 initial current den-sity were the same共0.4 A/cm2兲. Hence, electronic or ionic current
alone cannot be the dominating factor in the long-range migration of Sr and Co in CER#2 from the long-term stack tests. The presence of Cr 共in the stainless steel interconnect兲 in the vicinity of the LSC layer and the corresponding thermodynamic driving forces must be a major cause for the long-range transport of cations to the top of the LSC layer and the consequent nonuniform dissociation of the LSC perovskite phase. Thus, we suggest that the formation of the poorly conducting secondary phases is due to the LSC dissociation driven by the La–Cr–O related thermodynamics under the electrolytic po-tential and atmosphere at the anode. This result is consistent with the observations of Jiang et al. and Quadakkers et al.17that the oxygen electrode共or the contact layer here兲 could dissociate into secondary phases driven by Cr-related thermodynamics, and Cr-poisoning is not solely an electrochemically driven process. Such dissociation of the LSC contact layer into less conducting phases is the dominant cause for the degradation of the anode performance for the SOECs investigated here.
Based on the results from the Raman spectroscopy, AES, TEM, and electrochemical measurements in this research, we suggest the following mechanism as a likely path for the Cr-related degradation of the LSC contact layer. The process can be initiated by the vola-tilization of Cr to Cr+6-containing species, CrO
3 or CrO2共OH兲, at
the interconnect, a process already suggested for SOFCs.13A set of reactions between the CrO3or CrO2共OH兲 species and the LSC sur-face phase/species, serving as nucleation agents, initiates the forma-tion of secondary phases with low conductivity. The La–O and Sr–O segregates at the surface of LSC grains are the likely nucleation Figure 9.共Color online兲 Comparison of AES spectra from an area in each of
the LSC cross-sectional surface of cells REF#1 and REF#2.
Figure 10.共Color online兲 Comparison of the AES data from an area in each
of the LSC cross section of cell REF#1 with that of cell CER#2.
Figure 11.共Color online兲 Schematic for the transport of cations and charge
carriers across the SOEC.
B446 Journal of The Electrochemical Society, 157共3兲 B441-B448 共2010兲
agents in the latter theory. In this investigation, a clear enrichment in La and Sr on the surface of both the as-prepared and the tested reference half-cell LSC layer grains were found by AES. Consistent with Zhen et al.18and Chen et al.’s19theory, we hypothesize that this surface segregation of A-site species enhances the Cr deposition. Thus, the La-enriched La–O phase on the surface of LSC grains likely reacts with the CrO3species, leading to the formation of the LaCrO3or La2CrO6phases observed in the Raman spectroscopy and
STEM/EDX studies here. The proposed scheme governing the aforementioned reaction is shown in Eq.1, following the notation used by Zhen et al.18While a possible reaction scheme is depicted in Fig.12, the exact mechanism by which Cr drives such long-range transport of cations leading to La–Cr phase formations and the re-lation of this process to the electrochemical potential and gas pres-sure conditions in SOEC anode should be further quantified in terms of the thermodynamics involved in these reactions
Cr2O3→ CrO3共g兲 CrO3共g兲 + N → Cr–N–Ox
CrO3共g兲 + La2O3→ La2CrO6 关1兴
where N is the nucleation agent, here, a La-containing species, e.g., La2O3.
Conclusions
The degradation mechanism of LSC as the contact layer of SOEC anodes, particularly in the context of Cr poisoning, was in-vestigated here. The key observations obtained in this work are the following:
1. Raman spectroscopy at the LSC/interconnect interface showed that the LSC contact layer had at least partially dissociated, and the poorly conducting secondary phases of Co3O4, Cr2O3, LaCrO3, and La2CrO6 were formed. These observations indicated
that Cr transported from the stainless steel interconnects into the LSC layer, leading to electronic de-activation of the contact-layer.
2. AES results showed that the as-prepared surface chemistry of LSC showed a spatially uniform A-site共La and Sr兲 enrichment. In the tested SOEC stack cells, an average of 7% Cr on the cross-sectional surface of the LSC layer was found. The La/Co ratio showed a severe and nonuniform dissociation of the contact layer. Long-range transport of the Sr and Co cations to the top of the contact layer particularly prevailed with no detectable Sr remaining in the bulk of the layer. The top of the contact layer 共LSC/ interconnect interface兲 was decorated by Co-rich crystallites, possi-bly Co–Cr oxides, and a Sr-rich surface layer. This process could be associated with cation segregation and phase separation under the electrolytic potential and electronic and ionic current conditions and/or the presence of Cr species driving reactions to dissociate LSC.
3. STEM analysis confirmed the dissociation of the LSC contact layer due to the formation of secondary phases separated at the nanoscale. The bulk had a larger Cr content 共10–33%兲 than the surface of the layer grains, indicating different composition profiles for Cr reactions in the bulk and at the surface. Cr and La coexisted in phase-separated regions, identified as either LaCrO3or La2CrO6
in the bulk of the layer. Consistent with the AES results from the surface, Sr signal was absent from the bulk, indicating the complete separation of Sr from the bulk contact layer microstructure and mi-crochemistry.
4. EIS and AES analysis on the reference half-cells operated in controlled electrochemical environments in air showed that the cells degraded even in the absence of Cr in the system. However, the microstructure and surface composition of the LSC contact layer were stable and uniform throughout, although largely A-site en-riched, with clear presence of Sr in the structure. These observations show that the LSC contact layer stayed stable under electrolytic 共anodic兲 conditions when not subjected to Cr-containing species.
We conclude that the formation of poorly conducting secondary phases due to the dissociation of the LSC contact layer leads to the deterioration of the electronic activation of the anode and thus con-tributes to the significant degradation of the SOEC performance. Our results indicate that the dominant cause for the LSC dissociation is the inward transport of the Cr-containing phases from the stainless steel interconnects into the contact layer microstructure and is driven by the thermodynamics governing共La and Sr兲 Cr–O phases under electrolytic polarization and oxygen partial pressure condi-tions. The results suggest a mechanism for Cr deposition, which can nucleate between the volatile Cr-containing species 关CrO3 or
CrO2共OH兲兴 and the La–O and Sr–O segregates on the initial LSC
surface, initiating the formation of secondary phases. The exact mechanism by which Cr causes such long-range transport of Sr and Co cations and the consequent La–Cr–O phase formations and the relation of this process to the electrochemical potential and gas pres-sure conditions in SOEC anode should be further quantified in terms of the thermodynamics involved in these reactions.
Acknowledgments
We thank the DOE Office of Nuclear Energy for the financial support for the project, our research collaborators at Ceramatec Inc., and Idaho National Laboratory for providing us the SOECs for analysis in this work. We also thank E. L. Shaw, Tim McClure, and Dr. Yong Zhang for their support in using the instruments in the materials’ characterization facilities. This work was conducted in part at the Center of Materials Science共CMSE兲 at MIT.
Massachusetts Institute of Technology assisted in meeting the publication costs of this article.
References
1. B. Yildiz, K. J. Hohnholt, and M. S. Kazimi, Nucl. Technol., 155, 1共2006兲. 2. B. Yildiz and M. S. Kazimi, Int. J. Hydrogen Energy, 31, 77共2006兲.
3. M. S. Sohal, J. E. O’Brien, C. M. Stoots, J. S. Herring, J. Hartvigsen, D. Larsen, S. Elangovan, J. D. Carter, V. I. Sharma, and B. Yildiz, Report no. INL/EXT-09-16004, Report to the U.S. Department of Energy by Idaho National Laboratory 共2009兲.
4. J. Hartvigsen, S. Elangovan, C. M. Stoots, J. E. O’Brien, and J. S. Herring, Paper 173733 presented at ANS Embedded Topical: International Topical Meeting on the Safety and Technology of Nuclear Hydrogen Production, Control, and Manage-ment, Boston, MA, June 24–28, 2007.
5. High Temperature Solid Oxide Fuel Cells: Fundamentals, Design, and Applica-tions, S. C. Singhal and K. Kendell, Editors, p. 134, Elsevier, New York共2003兲. 6. J. E. O’Brien, C. M. Stoots, J. S. Herring, and J. J. Hartvigsen, Nucl. Technol., 158,
118共2007兲.
7. B. Borglum, in The 10th Annual Solid State Energy Conversion Alliance (SECA) Workshop, SECA共2009兲.
8. A. Hauch, S. D. Ebbesen, S. H. Jensen, and M. Mogensen, J. Electrochem. Soc.,
155, B1184共2008兲.
9. J. R. Mawdsley, J. D. Carter, A. J. Kropf, B. Yildiz, and V. A. Maroni, Int. J. Hydrogen Energy, 34, 4198共2009兲.
10. Y. Matsuzaki and I. Yasuda, J. Electrochem. Soc., 148, A126共2001兲. 11. Y. Matsuzaki and I. Yasuda, Solid State Ionics, 132, 271共2000兲. 12. J. W. Fergus, Int. J. Hydrogen Energy, 32, 3664共2007兲.
Figure 12.共Color online兲 Schematic of a possible reaction mechanism
be-tween Cr species and the LSC surface phases. The surface of the LSC grains is A-site segregated in the as-prepared condition. These A-site-enriched phases on the surface react with the Cr-containing species and form La2CrO6.
13. M. Stanislowski, E. Wessel, K. Hilpert, T. Markus, and L. Singheiser, J. Electro-chem. Soc., 154, A295共2007兲.
14. M. Stanislowski, J. Froitzheim, L. Niewolak, W. J. Quadakkers, K. Hilpert, T. Markus, and L. Singheiser, J. Power Sources, 164, 578共2007兲.
15. E. Konysheva, H. Penkalla, E. Wessel, J. Mertens, U. Seeling, L. Singheiser, and K. Hilpert, J. Electrochem. Soc., 153, A765共2006兲.
16. K. Hilpert, D. Das, M. Miller, D. H. Peck, and R. Weiß, J. Electrochem. Soc., 143, 3642共1996兲.
17. W. J. Quadakkers, H. Greiner, M. Hansel, A. Pattanaik, A. S. Khanna, and W. Mallner, Solid State Ionics, 91, 55共1996兲.
18. Y. Zhen, A. I. Y. Tok, F. Y. C. Boey, and S. P. Jiang, Electrochem. Solid-State Lett.,
11, B42共2008兲.
19. X. Chen, L. Zhang, and S. P. Jiang, J. Electrochem. Soc., 155, B1093共2008兲. 20. S. P. Jiang, J. P. Zhang, L. Apateanu, and K. Foger, J. Electrochem. Soc., 147,
4013共2000兲.
21. Z. Yang, G. Xia, P. Singh, and J. W. Stevenson, J. Power Sources, 155, 246共2006兲. 22. T. Kawada, N. Sakai, H. Yokokawa, and M. Dokiya, Solid State Ionics, 50, 189
共1992兲.
23. H. Taimatsu, K. Wada, H. Kaneko, and H. Yamamora, J. Am. Ceram. Soc., 75, 401 共1992兲.
24. A. Grosjean, O. Sanseau, V. Radmilovic, and A. Thorel, Solid State Ionics, 177, 1977共2006兲.
25. S. P. Simner, M. D. Anderson, M. H. Engelhard, and J. W. Stevenson, Electrochem. Solid-State Lett., 9, A478共2006兲.
26. N. Colthup, S. E. Wiberley, and L. H. Daly, Introduction to Infrared and Raman Spectroscopy, 3rd ed., p. 60, Academic, New York共1975兲.
27. H. Y. Chen and F. H. Lu, Thin Solid Films, 515, 2179共2006兲.
28. Y. Raitses, C. H. Skinner, F. Jiang, and T. S. Duffy, J. Nucl. Mater., 375, 365
共2008兲.
29. M. Li, Z. Feng, P. Ying, Q. Xin, and C. Li, Phys. Chem. Chem. Phys., 5, 5326 共2003兲.
30. M. N. Iliev, A. P. Litvinchuk, V. G. Hadjiev, Y. Q. Wang, J. Cmaidalka, R. L. Meng, and Y. Y. Sun, Phys. Rev. B, 74, 214301共2006兲.
31. D. L. Hoang, A. Dittmar, J. Radnik, K. W. Brzezinka, and K. Witke, Appl. Catal., A, 239, 95共2003兲.
32. N. Orlovskaya, D. Steinmetz, S. Yarmolenko, D. Pai, J. Sankar, and J. Good-enough, Phys. Rev. B, 72, 014122共2005兲.
33. X. P. Shen, H. J. Miao, H. Zhao, and Z. Xu, Appl. Phys. A: Mater. Sci. Process.,
91, 47共2008兲.
34. I. F. Ferguson, Auger Microprobe Analysis, p. 16, Hilger, New York共1989兲. 35. D. B. Williams and C. B. Carter, Transmission Electron Microscopy, Springer, New
York共1996兲.
36. E. Povoden, M. Chen, A. N. Grundy, T. Ivas, and L. J. Gauckler, J. Phase Equilib. Diffus., 30, 12共2009兲.
37. J. Hartvigsen, Ceramatec Inc., Personal communication.
38. P. Hjalmarsson, M. Soggard, A. Hagen, and M. Mogensen, Solid State Ionics, 179, 636共2008兲.
39. D. S. Tsvetkov, A. I. Vylkov, A. Y. Zuev, and A. N. Petrov, Russ. J. Phys. Chem.,
82, 855共2008兲.
40. S. Elangovan, Ceramatec Inc., Personal communication.
41. S. Sakamoto, M. Yoshinaka, K. Hirato, and O. Yamaguchi, J. Am. Ceram. Soc., 80, 267共1997兲.
42. A. Atkinson, M. R. Levy, S. Roche, and R. A. Rudkin, Solid State Ionics, 177, 1767共2006兲.
43. K. P. Ong, P. Wu, L. Liu, and S. P. Jiang, Appl. Phys. Lett., 90, 044109共2007兲.
B448 Journal of The Electrochemical Society, 157共3兲 B441-B448 共2010兲