IV International Conference on Particle-based Methods – Fundamentals and Applications PARTICLES 2015 E. Oñate, M. Bischoff, D.R.J. Owen, P. Wriggers & T. Zohdi (Eds)
MICROMECHANICAL ANALYSIS OF THE SURFACE EROSION OF A
COHESIVE SOIL BY MEANS OF A COUPLED LBM-DEM MODEL
PABLO CUÉLLAR¹, PIERRE PHILIPPE¹, STÉPHANE BONELLI¹, NADIA BENAHMED¹, FLORIAN BRUNIER-COULIN¹, JEFF NGOMA2, JEAN-YVES
DELENNE3 AND FARHANG RADJAI4,5
¹ IRSTEA, French Research Institute of Science and Technology for Environment and Agriculture 3275 route de Cézanne, 13100 Aix-en-Provence, France
pablo.cuellar@irstea.fr, pierre.philippe@irstea.fr, stephane.bonelli@irstea.fr, nadia.benahmed@irstea.fr, florian.brunier@irstea.fr, http://www.irstea.fr/
2 Institut Jean Lamour, CNRS - Université de Lorraine, Parc de Saurupt
CS 50840, 54011 Nancy, France
jeff.ngoma@univ-lorraine.fr, http://ijl.univ-lorraine.fr/
3 UMR IATE, INRA – CIRAD - Montpellier Supagro - Université Montpellier 2
2 place Pierre Viala, 34060 Montpellier, France delenne@supagro.inra.fr, http://umr-iate.cirad.fr/
4 Laboratoire de Mécanique et Génie Civil, CNRS - Université Montpellier 2
Place Eugène Bataillon, 34095 Montpellier, France Franck.Radjai@univ-montp2.fr, http://www.lmgc.univ-montp2.fr/
5 UMI 3466 CNRS – MIT, Department of Civil and Environmental Engineering, MIT, 77
Massachusetts Avenue, Cambridge CA 02139, USA fradjai@mit.edu, http://www. http://cee.mit.edu/
Key words: Surface erosion, cohesion, DEM, LBM.
Abstract. The elementary mechanisms driving the ubiquitous surface erosion of cohesive geomaterials can be analysed from a micromechanical perspective combining well-known numerical techniques. Here, a coupled model combining the Discrete Element and Lattice Boltzmann methods (DEM-LBM) provides an insight into the solid-fluid interaction during the transient erosion caused by a vertical fluid jet impinging on the surface of a granular assembly. The brittle cementation providing cohesion between the solid grains is described here by means of a simple bond model with a single-parameter yield surface. The initial topology of the surface erosion tends to mimic the profile of fluid velocity directly above the soil surface. We find that both the rate of erosion and the magnitude of eroded mass depend directly on the micromechanical strength of the single solid bonds.
1 INTRODUCTION
The geomechanical assessment of the surface erodibility of soils is usually performed empirically, often by means of standard experimental tests such as the Jet Erosion Test (JET, see e.g. [1]) and the Hole Erosion Test (HET, see e.g. [2] and [3]). The soils analysed by
2
means of these tests are generally cohesive geomaterials, while the water flowing on their surface behaves as eroding agent.
The erodibility is commonly quantified in terms of the average hydrodynamic shear stress at the soil surface with respect to a threshold, the critical shear stress, for the initiation of erosion. However, in practice the eroding process is much more complex and involves local transient flows such as turbulent jets with intermittent spikes of local hydrodynamic stress. On the other hand, the derivation of a reliable empirical expression for the critical stress has been hindered by the large variety of sediment properties that are relevant for the inter-particle forces of cohesive soils and their complex relationships [4]. All this has led to a general lack of consensus over the robustness of the different testing procedures as well as on the analysis methods, in particular on the assumptions for the assessment of the critical shear stress [5].
From the theoretical side, the starting point of most numerical approaches employed so far to study the erosion of geomaterials is merely macromechanical with both water and soil described as continuous media. Different techniques have therefore been proposed in order to track the transient evolution of their interface, where mass exchange between phases (i.e. the actual erosion) takes place [6]. On the one hand, the purely Eulerian approaches permit the use of a fixed mesh but they do not allow for a precise definition of hydro-mechanical variables at the interface. In a similar vein, hybrid Eulerian-Lagrangian methods may show a good precision at the interface but they often lead to severe and time-consuming remeshing issues [6].
The aim of the present work is to introduce an alternative approach based on discrete-element simulations of a cohesive granular bed impacted by a fluid jet modelled by the Lattice Boltzmann method. This is a micro-mechanical approach, which allows for the investigation of different factors driving the elementary mechanisms of erosion, such as the detachment of particle aggregates at the soil surface (surface erosion) or the dislodgement of lumps of material below the free surface (mass erosion) [7].
We introduce below our numerical approach and its application to a JET test on a granular bed with increasing cohesion between grains. A simple model of inter-particle cohesion will be considered, and its consequences for the bed’s erodibility will be discussed.
2 NUMERICAL METHOD
There are various coupled methods developed so far for the numerical simulation of fluid-solid interactions at the particle-scale. The approach adopted here combines the computational efficiency of the Lattice Boltzmann Method (LBM) for the simulation of fluids with the relative simplicity of the Discrete Element Method (DEM) for the simulation of solid particles. This approach has already been applied to several geomechanical problems (see e.g. [8-10]).
2.1 Solid phase. A DEM approach
The granular soil is described here by means of a smooth discrete element approach based on the Molecular Dynamics method [11]. We use a two-dimensional assembly of circular particles whose trajectories are computed by simple integration of Newton’s equations of motion. The smooth inter-particle contact and friction laws are supplemented by cohesive interactions (see e.g. [12-14]). Here, we consider a simple cohesive law depicted in Figure 1
3 for contact interactions [12].
Figure 1: Left: Rheological model of solid contacts, after [14]; Right: Yield surface of cohesive bonds in the
space of interaction forces
The interaction between two particles is thus formulated in terms of an interaction force F and an interaction moment M applied at the contact point. The interaction force is decomposed into its normal and shear components, Fn and Fsrespectively, corresponding to
the normal and tangential directions at the contact. The normal force Fn is described in terms
of the local interpenetration δn by means of a classical Kelvin-Voigt viscoelastic relationship
defined by the normal stiffness and damping coefficients, kn and ηn. On the other hand, the
shear force arising at a frictional (non-cohesive) contact is defined here by a viscous-regularized Coulomb law [15, 16] characterized by a static friction coefficient µ and a viscous coefficient of shear regularization ks. In this way, the shear force is computed as a function of
the sliding velocity s, which in practice never really vanishes. Due to the small time steps
considered here (in the order of 10-6 s), the quasi-static equilibrium of particles under the action of static friction forces is reached through residual micro-slips. The force moment acting on each particle’s centre is defined from the shear force with the particle’s radius as lever arm, and a rolling friction component that governs the rolling motion of the particles (relative rotation without sliding). The latter is analogous to the sliding friction in which the relative velocity of rotation replaces the sliding velocity, and the rolling friction coefficient µω
and the coefficient of regularization kω replace the sliding friction coefficient and its
regularization factor [13, 15].
The ingredients presented so far describe the purely frictional contacts. In order to introduce cohesion allowing for tensile normal forces between the solid particles, a simple elastoplastic model with parabolic yield surface in the space of contact forces has been employed (Figure 1). In this way, a solid bond is defined for all particles initially at contact, featuring a linear elastic rheology characterized by the normal and shear bond stiffnesses kn,b
and ks,b. When a contact force reaches the yield surface, the bond is broken and the contact
becomes purely frictional. For convenience, the normal and shear yield thresholds Cn and Cs
are assumed to depend only on a single parameter C = Cn = 2·Cs, which represents the
strength or degree of cementation of the solid bond. The relative strength of the bonds in the polydisperse assembly can be characterized by a dimensionless number defined as the ratio of bond cohesion to the particle’s own buoyant weight. This cohesive Bond number would then be expressed as:
4
(1) where ∆ρ is the submerged apparent density of the solid grains, g is the gravitational acceleration and V is the volume of the particle. In general it can be noted that B ≥ 0 and that solid bonds with B < 1 are unstable and short-lived since any slight rearrangement of the assembly under its own weight has the potential to cause bond rupture. Our numerical tests show that the granular bed remains completely bonded under gravity for B ≥ 3 for all particles in the sample.
2.2 Fluid phase. The LBM method
The transient flow of the fluid phase is described here by means of a classical D2Q9 scheme of the lattice Boltzman method, which is an explicit finite difference scheme of the continuous Boltzmann equation [18, 19]. The LBM is based on a Cartesian lattice grid in the space and a discrete set of probability density functions and velocities of fluid particles at each grid point. The fluid dynamics are then computed in just two basic steps for the collision and advection of the fluid particles following a set of rules that ensure the conservation of mass, momentum and energy (i.e. the incompressible Navier-Stokes behaviour). However this only holds for low Mach numbers, i.e. when fluid velocity is much lower than the lattice speed. We used the generalized formulation of d’Humières with a multiple relaxation time (MRT) in order to overcome the well-known shortcomings of the classical Bhatnaggar-Gross-Krook scheme (single relaxation time) [20, 21]. Hence, the fluid phase is fully defined by specifying the lattice grid size ∆x and lattice speed cs, the components sα of the diagonal
relaxation matrix S (inverse of the different relaxation times) and the fluid material parameters of density ρf and kinematic viscosity ν [10].
2.3 Solid-fluid coupling
The coupling between the fluid and solid phases and the computation of hydrodynamic forces on the particles are performed by means of the simple method for momentum exchange proposed by Bouzidi et al [22], which relies on a generalized bounce-back and linear interpolation strategy for arbitrary geometries in the LBM. The sub-cycling time integration technique proposed by Feng et al [23] was used to exploit the fact that the time step required for the fluid computation is generally much larger than that for particle dynamics. The number of DEM subcycles for each LBM step was nevertheless restricted to 2 in order to preserve the accuracy of the computed hydrodynamic forces on the solid particles. In order to account for fluid flow across a densely packed assembly of particles in two dimensions, a “hydraulic” radius slightly smaller than the particle radius was used [24, 25].
3 ANALYSIS OF JET EROSION
Figure 2 illustrates the general configuration of a jet erosion test and its relevant dimensions. The dimensions of the system were chosen to mimic our on-going physical tests [26] for a later comparison. We have an initial jet-bed distance H = 70 mm, a nozzle diameter of d0 = 5 mm and average grain size Dmean = 3 mm. A size polydispersity (Dmax/Dmin = 1.5)
was introduced in order to avoid crystalline configurations of the two-dimensional granular =∆
5 sample.
Figure 2: Left: Conceptual sketch of jet erosion test (source: [1]); Right: Spatial disposition of granular
assembly, jet’s nozzle and control section for fluid variables
The geometrical, material and rheological parameters of the system employed for these simulations are summarized in Table 1.
Table 1: Geometrical, material and model parameters adopted for the simulations
Solid phase Fluid phase
Particle mean size, Dmean 3x10⁻³ m Jet’s distance to surface, H 7x10⁻² m
Polydispersity, Dmax / Dmin 1.5 Jet’s nozzle size, d0 5x10⁻³ m
Length of granular sample, L 2.63x10⁻¹ m
Height of granular sample, Hs 8x10⁻² m Kinematic fluid viscosity, ν 5x10⁻⁵ m2/s
Fluid density, ρf 847 kg/m3
Particle density, ρs 2230 kg/m3
Normal contact stiffness, kn 1.1x10⁵ N/m Lattice grid size, ∆x 2.3x10⁻⁴ m
Shear contact stiffness, ks 1.1x10⁵ N/m Lattice speed, cs 10 m/s
Rolling stiffness, kω 0.1kn Hydraulic radius factor, Rh 0.8
Friction coefficients, µ=3·µω 0.3
Inlet fluid velocity, uj [0.8-1.5] m/s
Normal bond stiffness, kn,b 0.5kn
Shear bond stiffness, ks,b 0.2kn
Bond strength, C=Cn=2Cs [0-2.5] N
The fluid flow may be described as an inertial laminar flow (ReJET ~ 80 to 160), i.e. a flow
in the transition from a laminar to a turbulent regime. 3.1 Jet analysis
6
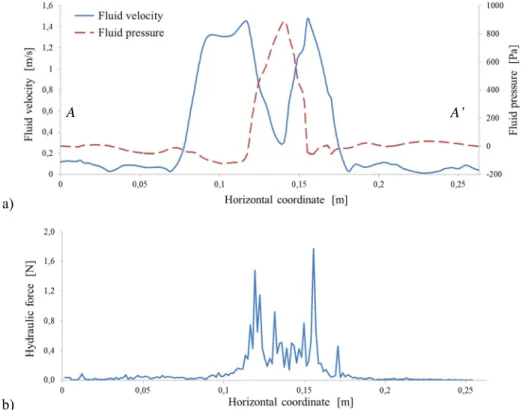
with a stagnation point under the jet’s axis and the two local maxima at some distance from it (r/H ~ 0.25). These features are nevertheless strongly conditioned by the actual shape and roughness of the bed surface.
a)
b)
Figure 3: a) Transversal profiles of fluid velocity and pressure at control section A-A’; b) Integrated resultant of
hydraulic forces acting on the solid particles at the soil’s surface
The viscous drag forces acting on the soil surface are proportional to the fluid velocity and thus show a similar pattern of stagnation under the jet’s axis and local maxima at r/H ~ 0.25 (Figure 3b).
3.2 Erosion process
The erosion process begins when the hydraulic shear stress at the soil surface exceeds a critical shear stress. For our configuration, this limit was reached for jet velocities equal to or greater than 0.6 m/s, in good agreement with our on-going experimental results [26]. As expected, the mobilization of solid particles then follows a pattern that is similar to the profiles of fluid velocity and hydraulic drag forces. Figure 4a shows the eroded profile of a cohesionless sample for a jet velocity of 0.8 m/s after 1.6 seconds of jet flow. At higher jet velocities and in the absence of cohesion, the picture becomes less clear due to the increased scouring depth, the ejection of solid particles and frequent avalanches of the scour pit walls.
In the presence of cohesive forces between particles, the erosion kinetics becomes slower but the initial topology of erosion does not change. Figure 4b shows the state of the granular sample for a cohesive strength of C = 2.0 N and a jet velocity of 1.5 m/s after roughly 0.5 seconds of jet flow. We observe a characteristic stagnation zone at the jet’s axis and the
7
contiguous local maxima of scour depth. It is also observed that the grains are now detached either as single particles or in multi-grain clusters preserving a number of internal bonds.
a)
b)
Figure 4: Initial topology of surface erosion; a) Cohesionless sample (bond strength C = 0 N), jet velocity
uj = 0.8 m/s; b) Cohesive sample (C = 2 N), jet velocity uj = 1.5 m/s
In order to quantify and evaluate the erosion kinetics in a consistent manner for both the cohesive and cohesionless samples, it is necessary to specify an erosion criterion allowing us to distinguish between eroded and non-eroded particles. The cumulative particle displacement can be misleading for this purpose since it integrates the persistent residual micro-displacements of the particles, which can add up to significant magnitudes. Therefore it seems more appropriate to differentiate the particles as a function of an instantaneous quantity such as the kinetic energy:
(2) =12 12
8
where m, I, vi and ωi are the particle’s mass, moment of inertia, translational velocity and
angular velocity, respectively. In this way, if a particle attains at any moment a kinetic energy above a given threshold, it is classified as eroded. In this study, a threshold of 2x10⁻⁵ Joules
allowed us to discriminate well the particles at the debonding front separating the cohesive assembly from the detached and re-settled particles (see Figure 5a), and thus was adopted as erosion criterion.
Figure 5b shows the time evolution of the relative eroded mass (i.e. the proportion of eroded particles compared to the total mass of the granular assembly) for different strengths of the cohesive bonds and a jet velocity of 1.5 m/s.
a)
b)
Figure 5: a) Eroded state of soil surface for C = 2 N after t = 5 s, with particle discrimination in terms of kinetic
energy (red: eroded particles; blue: intact particles); b) Erosion kinetics in dependence of the bond strength The purely frictional sample (C = 0 N) shows a sharp increase of eroded mass when the fluid jet reaches the soil surface and after 5 seconds half of the assembly has already been eroded. This proportion is significantly reduced by the introduction of cohesion, while the complete absence of erosion is achieved when the bond strength is C = 2.5 N. Therefore, the critical cementation degree for the beginning of erosion in the presented conditions should feature a micromechanical bond strength somewhere between 2 and 2.5 N.
9 4 CONCLUSIONS
We used a coupled DEM-LBM model to investigate the micromechanics of surface erosion of cohesive geomaterials under the action of a fluid jet flow. We showed that for a given jet flow, there is a critical value of inter-particle cohesion for which surface erosion occurs. We presently work on the influence of more complex cohesion laws and the relation between the micromechanical and macroscopic yield thresholds.
REFERENCES
[1] Hanson, G.J. and Cook, K.R. Apparatus, test procedures and analytical methods to measure soil erodibility in situ. Engineering in Agriculture, ASAE, 20(4): 455-462 (2004).
[2] Wan, C.F. and Fell, R. Investigation of Rate of Erosion of Soils in Embankment Dams. J.
Geotech. Geoenviron. Eng., 130(4), 373–380 (2004).
[3] Bonelli, S.; Brivois, O.; Borghi, R. and Benahmed, N. On the modelling of piping erosion.
Comptes Rendus de Mécanique, 8-9(334): 555-559 (2006).
[4] Xu, Y.; Jiang, H.; Chu, F. and Liu, C. Fractal model for surface erosion of cohesive sediments, Fractals 22(3), (2014).
[5] Cossette, D.; Mazurek, K.A. and Rennie, C.D. Critical shear stress from varied method of analysis of a submerged circular turbulent impinging jet test for determining erosion resistance of cohesive soils, Proc. 6th
Conf on Scour and Erosion ICSE6, Paris (2012). [6] Mercier, F.; Golay, F.; Bonelli, S.; Anselmet, F.; Borghi, R. and Philippe, P. 2D
axisymmetrical numerical modelling of the erosion of a cohesive soil by a submerged turbulent impinging jet, European Journal of Mechanics - B/Fluids, Vol. 45, pp. 36–50 (2014)
[7] Winterwerp, J. C. and Van Kesteren, W. G. M. Introduction to the physics of cohesive
sediment in the marine environment, Developments in Sedimentology Series no. 56.
Elsevier (2004).
[8] Mutabaruka, P.; Delenne, J.-Y.; Soga, K. and Radjai, F. Initiation of immersed granular avalanches, Phys. Rev. E. 89 (2014).
[9] Sibille, L.; Lominé, F.; Poullain, P.; Sail, Y. and Marot, D. Internal erosion in granular media: direct numerical simulations and energy interpretation, Hydrol. Process. 29(9), pp 2149–2163, Wiley & Sons (2015).
[10] Ngoma, J. Etude numérique et expérimentale de la déstabilisation des milieux
granulaires immergés par fluidisation, PhD thesis, Université d’Aix-Marseille (2015). [11]Cundall, P.A. and Strack, O.D.L. A discrete numerical model for granular assemblies,
Géotechnique, Vol. 29, pp. 47-65 (1979)
[12]Delenne, J.-Y.; El Youssoufi, M.S.; Cherblanc, F. and Bénet, J.-C. Mechanical behaviour and failure of cohesive granular materials, Int. J. Numer. Anal. Meth. Geomech., Vol. 28, pp. 1577–1594 (2004).
[13]Richefeu, V. Approche par éléments discrets 3D du comportement de matériaux
granulaires cohésifs faiblement contraints. PhD thesis. Université Montpellier II (2005). [14]Jiang, M.; Zhang, W.; Sun, Y. and Utili, S. An investigation on loose cemented granular
materials via DEM analyses, Granular Matter 15:65–84, (2013)
10
cohesion for numerical simulations of 3D polydisperse granular media, Int. J. Numer.
Anal. Meth. Geomech., Vol. 32, pp. 1365–1383 (2008).
[16]Schaefer, J.; Dippel, S. and Wolf, D. Force schemes in simulations of granular materials,
Journal de Physique I, 6 (1), pp.5-20, EDP Sciences (1996).
[17] McNamara, S. Molecular dynamics method, in Discrete-element modeling of granular
materials, Eds. Radjaï, F. and Dubois, F., Wiley-Iste, (2011)
[18] Succi, S. The Lattice-Boltzmann Equation for fluid dynamics and beyond. Oxford university press, Oxford (2001).
[19]Lallemand, P. and Luo, L.-S. Lattice Boltzmann method for moving boundaries, Journal
of Computational Physics, Vol. 184, pp. 406–421, (2003).
[20] Lallemand, P. and Luo, L.-S. Theory of the Lattice Boltzmann Method: Dispersion, Dissipation, Isotropy, Galilean Invariance, and Stability, ICASE Report No. 2000-17, NASA/CR-2000-210103 (2000).
[21]Yu, D.; Mei, R.; Luo, L.-S. and Shyy, W. Viscous flow computations with the method of lattice Boltzmann equation, Progress in Aerospace Sciences, 39: 329–367, (2003).
[22] Bouzidi, M.; Firdaouss, M. and Lallemand, P. Momentum transfer of a Boltzmann-lattice fluid with boundaries, Phys. Fluids, Vol. 13, No. 11, (2001).
[23]Feng, Y.T.; Han, K. and Owen, D.R.J. Coupled lattice Boltzmann method and discrete element modelling of particle transport in turbulent fluid flows: Computational issues,
Int. J. Numer. Meth. Engng72:1111–1134, (2007).
[24]Boutt, D.F.; Cook, B.K. and Williams, J. R. A coupled fluid–solid model for problems in geomechanics: Application to sand production, Int. J. Numer. Anal. Meth. Geomech. 35:997–1018 (2011).
[25] Cui, X.; Li, J.; Chan, A. and Chapman, D. A 2D DEM–LBM study on soil behaviour due to locally injected fluid, Particuology 10: 242– 252, (2012).
[26] Brunier-Coulin, F.; Cuellar, P. and Philippe, P. Local mechanisms of cohesive soil erosion, submitted to 13th
Int. Conf. on Cohesive Sediment Transport Processes,
![Figure 1: Left: Rheological model of solid contacts, after [14]; Right: Yield surface of cohesive bonds in the space of interaction forces](https://thumb-eu.123doks.com/thumbv2/123doknet/13923711.449971/3.892.121.759.183.371/figure-rheological-contacts-right-yield-surface-cohesive-interaction.webp)
![Figure 2: Left: Conceptual sketch of jet erosion test (source: [1]); Right: Spatial disposition of granular assembly, jet’s nozzle and control section for fluid variables](https://thumb-eu.123doks.com/thumbv2/123doknet/13923711.449971/5.892.119.773.177.447/figure-conceptual-erosion-spatial-disposition-granular-assembly-variables.webp)