EUROPEAN ORGANISATION FOR NUCLEAR RESEARCH (CERN)
Phys. Lett. B. 816 (2021) 136190 DOI:10.1016/j.physletb.2021.136190
CERN-EP-2020-165 16th March 2021
Observation of photon-induced 𝑾
+
𝑾
−
production
in 𝒑 𝒑 collisions at
√
𝒔 = 13 TeV using the ATLAS
detector
The ATLAS Collaboration
This letter reports the observation of photon-induced production of 𝑊 -boson pairs, 𝛾𝛾 → 𝑊𝑊 .
The analysis uses 139 fb−1of LHC proton–proton collision data taken at
√
𝑠 = 13 TeV recorded
by the ATLAS experiment during the years 2015–2018. The measurement is performed selecting one electron and one muon, corresponding to the decay of the diboson system as
𝑊 𝑊 → 𝑒±𝜈 𝜇∓𝜈final state. The background-only hypothesis is rejected with a significance of
well above 5 standard deviations consistent with the expectation from Monte Carlo simulation. A cross section for the 𝛾𝛾 → 𝑊𝑊 process of 3.13 ± 0.31(stat.) ± 0.28(syst.) fb is measured in a fiducial volume close to the acceptance of the detector, by requiring an electron and a muon of opposite signs with large dilepton transverse momentum and exactly zero additional charged particles. This is found to be in agreement with the Standard Model prediction.
© 2021 CERN for the benefit of the ATLAS Collaboration.
Reproduction of this article or parts of it is allowed as specified in the CC-BY-4.0 license.
Contents
1 Introduction 2
2 ATLAS detector 3
3 Data and simulated event samples 4
4 Event reconstruction and selection 6
5 Modelling of signal and backgrounds 7
5.1 Modelling of additional 𝑝 𝑝 interactions 8
5.2 Modelling of the underlying event 9
5.3 Signal modelling 11
6 Event categories and background estimation 12
7 Systematic uncertainties 13
8 Results 15
9 Conclusion 19
1 Introduction
The study of 𝑊 -boson pair production from the interaction of incoming photons (𝛾𝛾 → 𝑊𝑊 ) in proton– proton (𝑝 𝑝) collisions offers a unique window to a wide range of physical phenomena. In the Standard Model (SM), the 𝛾𝛾 → 𝑊𝑊 process proceeds through trilinear and quartic gauge-boson interactions. This process is unique in that, at leading order, it only involves diagrams with self-couplings of the electroweak
gauge bosons, as shown in Figure1. Hence, a cross-section measurement directly tests the SU(2)×U(1)
gauge structure of the SM. At the same time, as a process driven only by electroweak boson self-interactions,
it is sensitive to anomalous gauge-boson interactions [1] as parameterised in effective field theory (EFT)
with additional dimension-6 and dimension-8 operators [2, 3]. Thus, cross-section measurements of
𝛾 𝛾→ 𝑊𝑊 can in future provide valuable input for the global EFT fits.
W γ γ W− W+ γ γ W− W+
Figure 1: The leading-order Feynman diagrams contributing to the 𝛾𝛾 → 𝑊𝑊 process are the t-channel diagram (left) proceeding via the exchange of a 𝑊 boson between two 𝛾𝑊𝑊 vertices and a diagram with a quartic 𝛾𝛾𝑊𝑊 coupling (right). In addition, a u-channel diagram exists (not shown), which also proceeds via two 𝛾𝑊𝑊 vertices.
This letter presents a measurement in the 𝑊+𝑊− → 𝑒±𝜈 𝜇∓𝜈channel that results in the observation of photon-induced 𝑊𝑊 production. Previously, the ATLAS and CMS Collaborations found only evidence
for 𝛾𝛾 → 𝑊𝑊 production with the Run-1 data, ATLAS by using 8 TeV 𝑝 𝑝 collisions [4] and CMS by
combining their 7 TeV and 8 TeV 𝑝 𝑝 collision data [5,6].
The signal process proceeds through the 𝑝 𝑝 (𝛾𝛾) → 𝑝(∗)𝑊+𝑊−𝑝(∗) reaction, where 𝑝(∗) indicates that the final-state proton either stays intact or fragments after emitting a photon. Whilst the former occurs through a coherent photon radiation off the whole proton without disintegration, for the latter at least one of the photons can be considered as being radiated off a parton in the proton. These contributions are classified as elastic, single-dissociative, and double-dissociative 𝑊𝑊 production. Elastic 𝛾𝛾 → 𝑊𝑊 production with leptonic decays of the 𝑊 bosons results in a final state containing two charged leptons and no additional charged-particle activity. Even in the case of dissociative photon-induced production, the charged particles from the proton remnants often fall outside the acceptance of the tracking detector.
The suppressed activity in the central region of the detector in the 𝛾𝛾 → 𝑊𝑊 signal gives the means to control and significantly reduce background from quark- and gluon-induced 𝑊𝑊 production or top-quark production where the leptonic final state is typically produced in association with a substantial amount of hadronic activity. The analysis therefore selects events that have no additional charged-particle tracks reconstructed in the vicinity of the selected interaction vertex. The modelling of the hadronic activity in quark- and gluon-induced processes, as well as uncorrelated activity from additional 𝑝 𝑝 interactions, is constrained using same-flavour 𝑒𝑒 and 𝜇𝜇 Drell–Yan, DY(→ 𝑒𝑒/𝜇𝜇), events in data, reducing the associated uncertainties by a significant amount. Background from other photon-induced processes, mainly dilepton production 𝛾𝛾 → ℓℓ, is reduced by selecting only different-flavour lepton pairs, 𝑒 𝜇, leaving a smaller contribution from 𝛾𝛾 → 𝜏𝜏 production with leptonic 𝜏 decays. Since the contribution from the 𝛾𝛾 → 𝜏𝜏 process falls off rapidly with increasing transverse momentum of the dilepton system, 𝑝
𝑒 𝜇
T , it can be further suppressed by placing requirements on 𝑝
𝑒 𝜇
T . A fiducial cross section for the
𝑝 𝑝(𝛾𝛾) → 𝑝(∗)𝑊+𝑊−𝑝(∗) process through the decay channel 𝑊+𝑊−→ 𝑒±𝜈 𝜇∓𝜈is measured in a fit to the number of events in several kinematic regions with different signal and background contributions.
2 ATLAS detector
The ATLAS detector [7] at the Large Hadron Collider (LHC) is a multipurpose detector with a forward–
backward symmetric cylindrical geometry and nearly 4𝜋 coverage in solid angle.1 It consists of an inner
tracking detector surrounded by a thin superconducting solenoid providing a 2 T axial magnetic field, electromagnetic and hadron calorimeters, and a muon spectrometer.
The inner tracking detector (ID) covers the pseudorapidity range |𝜂| < 2.5 and is composed of three subdetectors. The high-granularity silicon pixel detector covers the vertex region and typically provides four measurements per track, the first hit normally being in the insertable B-layer [8,9]. It is followed by the silicon microstrip tracker (SCT), which usually provides eight measurements per charged-particle track. These silicon detectors are complemented by the transition radiation tracker, which enables radially extended track reconstruction up to |𝜂| = 2.0 and provides electron identification information. The resolution of the 𝑧-coordinate of tracks at the point of closest approach to the beam line is about 0.170 mm for tracks
1ATLAS uses a right-handed coordinate system with its origin at the nominal interaction point in the centre of the detector and
the 𝑧-axis coinciding with the axis of the beam pipe. The 𝑥-axis points from the interaction point to the centre of the LHC ring, and the 𝑦-axis points upward. The pseudorapidity is defined in terms of the polar angle 𝜃 as 𝜂 = − ln tan(𝜃/2), and 𝜙 is the azimuthal angle around the beam pipe relative to the 𝑥-axis. The angular distance is defined as Δ𝑅 =
√︁
with 𝑝T = 500 MeV and improves with higher track momentum [10]. For tracks with 𝑝T < 1 GeV, the
dominant contribution to the 𝑧-resolution is due to multiple scattering.
Lead/liquid-argon (LAr) sampling calorimeters provide electromagnetic (EM) energy measurements with high granularity. A steel/scintillator-tile hadron calorimeter covers the central pseudorapidity range (|𝜂| < 1.7). The endcap and forward regions are instrumented with LAr calorimeters for EM and hadronic energy measurements up to |𝜂| = 4.9. The muon spectrometer (MS) surrounds the calorimeters and is based on three large air-core toroidal superconducting magnets with eight coils each. The muon spectrometer includes a system of precision tracking chambers (|𝜂| < 2.7) and fast detectors for triggering (|𝜂| < 2.4). A two-level trigger system [11] selects the events used in the analysis.
3 Data and simulated event samples
The analysis uses proton–proton collision data recorded with the ATLAS detector during the Run-2 data-taking period (2015–2018) at
√
𝑠= 13 TeV with the number of interactions, 𝜇
int, per bunch crossing
(also referred to as pile-up) ranging from about 10 to 60 with an average of 33.7 [12].
The size of the region where the collisions occur, the so-called beam spot, is a result of the operating parameters of the LHC. Of specific importance for this analysis is its width along the 𝑧-direction, which determines the density of 𝑝 𝑝 interactions. The width is determined by fitting the distribution of the 𝑧 positions of the reconstructed vertices to Gaussian functions using an unbinned likelihood fit. It varied
between 30 and 50 mm during the Run-2 data-taking period [13]. The data correspond to an integrated
luminosity of L =139.0 ± 2.4 fb−1after data quality requirements [14] have been applied. This value is
derived from the calibration of the luminosity scale with the method explained in Ref. [12], using the
LUCID-2 detector [15] for the primary luminosity measurement.
Signal and background processes were modelled using Monte Carlo (MC) event generators to study kinematic distributions, to evaluate background contamination in the signal region and to interpret the results. To simulate the detector response, the generated events were passed through a detailed simulation
of the ATLAS detector [16] based on Geant4 [17] or on a combination of Geant4 and a parameterised
calorimeter simulation [18]. The present measurement relies only on tracking information from charged
hadrons, muons and electrons, which is simulated by Geant4 in either case, as well as the modelling of the calorimetric response of electrons which can be reliably parametrized. Multiple 𝑝 𝑝 interactions occurring in the same or adjacent bunch crossings are included in the simulation by overlaying several inelastic 𝑝 𝑝 collisions matching the average number of interactions per bunch crossing. The inelastic 𝑝 𝑝 collisions
were generated with Pythia 8.186 [19] using a set of tuned parameters called the A3 tune [20] and the
NNPDF2.3LO [21] set of parton distribution functions (PDF). All MC samples are corrected to the beam
conditions of the data as described in Section5.1. In all samples using Pythia8 or Herwig7 to simulate
the parton showering, underlying event and hadronisation, the decays of bottom and charm hadrons were
performed with EvtGen 1.2.0 [22].
The elastic component of the 𝛾𝛾 → 𝑊𝑊 signal process was modelled at leading order (LO) using Herwig
7.1.5 [23,24] interfaced with the BudnevQED photon flux [25] through ThePEG software [26]. This
sample is used to model the photon-induced processes in the fiducial region of the measurement as it
uses a photon flux, which is differential in both 𝑥 and virtuality 𝑄2. It is corrected to match the cross
section, including the dissociative as well as non-perturbative components, using a data-driven method
samples produced using MG5_aMC@NLO 2.6.7 [27] interfaced to Pythia 8.243. The default photon
flux in MG5_aMC@NLO and the CT14QED [28] PDF were used to model the photon radiation from
protons and quarks, respectively. The parametrized detector simulation was used in the generation of the MG5_aMC@NLO samples. They are used whenever regions with reconstructed track multiplicities larger than zero are studied.
The production of 𝛾𝛾 → ℓℓ, with ℓ = 𝑒, 𝜇, 𝜏, was modelled in the same way as for the 𝛾𝛾 → 𝑊𝑊 signal process. Additional generators were used to validate the modelling of the 𝛾𝛾 → ℓℓ dissociative
events. The single-dissociative processes were modelled using LPAIR 4.0 [29]. Alternative 𝛾𝛾 → ℓℓ
double-dissociative samples were produced with Pythia 8.240 using the NNPDF3.1NLOluxQED PDF
set [30]. Diffractive QCD-processes and 𝛾𝛾 → 4ℓ production were produced using Pythia 8.244 and
MG5_aMC@NLO 2.6.7 interfaced to Pythia 8.243 and studied using particle-level information only. The contribution of these processes was found to be negligible in the signal region of the measurement.
The dominant background from quark-induced 𝑊𝑊 production, also referred to as 𝑞𝑞 → 𝑊𝑊 , was
modelled at next-to-leading-order (NLO) accuracy using the Powheg-Box v2 [31–35] generator interfaced
to Pythia8 and alternatively to Herwig7. The Powheg-Box v2 sample employs the CT10 [36] PDF for
the matrix element calculation and is interfaced to Pythia 8.212 for parton showering and hadronisation
employing the parameter values of the AZNLO tune [37] and the CTEQ6L1 [38] PDF. Samples using a set
of variations in the tune parameters (eigentune variations) sensitive to initial- and final-state radiation, as well as further variations related to multiple parton interactions and colour reconnection, were produced to study the description of the parton showers and hadronisation. Herwig 7.1.6 was used as an alternative
parton shower, using the H7UE tune [24] and the MMHT2014LO PDF set [39] for events generated with
the Powheg-Box v2 generator. An alternative sample for quark-induced 𝑊𝑊 production was generated
using the Sherpa [40,41] event generator in order to evaluate modelling uncertainties. The Sherpa 2.2.2
sample uses matrix elements at NLO accuracy in QCD for up to one additional parton and at LO accuracy for up to three additional parton emissions. The matrix element calculations were matched and merged with
the Sherpa parton shower based on Catani–Seymour dipole factorisation [42,43] using the MEPS@NLO
prescription [40,44–46]. The virtual QCD corrections were provided by the OpenLoops 1 library [47–49].
The sample was generated using the NNPDF3.0NNLO set [50], along with the dedicated set of tuned
parton-shower parameters developed by the Sherpa authors.
DY production, 𝑝 𝑝 → 𝑍 /𝛾∗ → ℓℓ with ℓ = 𝑒, 𝜇, 𝜏, was modelled using the same settings for Sherpa,
Powheg+Pythia8 and Powheg+Herwig7 as for the quark-induced 𝑊𝑊 event generation described above.
DY(𝑍 /𝛾∗ → 𝜏𝜏) was modelled with Powheg interfaced to Pythia 8.186 using the NNPDF3.0NLO
PDF set [50] and the AZNLO tune together with the CTEQ6L1 PDF set for parton showering and
hadronisation.
The 𝑊 𝑍 and 𝑍 𝑍 background processes were modelled at NLO using Sherpa as well as Powheg-Box v2 interfaced to Pythia 8.212 with the same settings as employed for the 𝑊𝑊 event generation. 𝑊 𝛾 production, gluon-induced 𝑊𝑊 production including resonant and non-resonant contributions and 𝑊𝑊 𝑗 𝑗 production in vector-boson scattering were simulated using the Sherpa 2.2.2 generator with the NNPDF3.0NNLO PDF set. These samples use matrix elements at NLO QCD accuracy for up to one additional parton and LO accuracy for up to three additional parton emissions for 𝑊 𝛾 and gluon-induced 𝑊𝑊 production and LO-accurate matrix elements for 𝑊𝑊 𝑗 𝑗 production in vector-boson scattering.
The 𝑡 ¯𝑡 and 𝑊 𝑡 processes were simulated with the Powheg-Box [31–33,51,52] v2 generator at NLO with
of PDFs. For the 𝑊 𝑡 process, the diagram removal scheme [54] was applied to remove interference and overlap with 𝑡 ¯𝑡 production.
4 Event reconstruction and selection
Candidate events from 𝛾𝛾 → 𝑊𝑊 production are identified by the presence of an electron and a muon with high transverse momentum and the absence of additional reconstructed charged-particle tracks associated with the interaction vertex.
Tracks are reconstructed from position measurements (hits) in the ID caused by the passage of charged
particles [55, 56]. The track reconstruction consists of an iterative track-finding algorithm seeded by
combinations of at least three silicon-detector hits followed by a combinatorial Kalman filter [57] to build track candidates based on hits compatible with the extrapolated trajectory. Ambiguities between the track candidates are then resolved and quality criteria are applied to suppress combinations of hits unlikely to originate from a single charged particle. At least one hit in the two innermost layers is required if the extrapolated track crosses the sensitive region of an active sensor module. The number of silicon hits in the pixel and SCT detectors must be larger than 9 for |𝜂| ≤ 1.65 or larger than 11 for |𝜂| > 1.65, with no more than two missing SCT hits on a track if the respective SCT modules are operational. Additionally, a
selection is imposed on the transverse impact parameter, |𝑑0| < 1 mm, to reject tracks from secondary
interactions. Tracks are required to have 𝑝T >500 MeV and be within |𝜂| < 2.5. These selection criteria
result in an efficiency of 75–80% depending on the track 𝑝T. The largest source of inefficiency is hadronic
interactions with the detector material. In simulated events, reconstructed tracks can be classified as originating from the hard scatter or from additional 𝑝 𝑝 collisions by matching the hits that contributed to the track fit to the energy deposited by the charged particle in the Geant4 simulation. The respective tracks are counted as 𝑛HStrk and 𝑛PUtrk.
Electrons are reconstructed from energy clusters in the electromagnetic calorimeter that are matched to tracks reconstructed in the ID [58,59]. The best-matching track is selected using as criteria track–cluster
spatial distance and the number of hits in the silicon detectors [59]. Further tracks may be assigned
to the electron candidate if they are likely to originate from interactions with detector material. The pseudorapidity of electrons is required to be within the range of |𝜂| < 2.47, excluding the transition region between the barrel and endcaps in the LAr calorimeter (1.37 < |𝜂| < 1.52). Electron candidates are
required to have transverse momenta 𝑝T> 20 GeV.
Muons are built from tracks reconstructed using MS hits matched to ID tracks. A global fit using the hits
from both subdetectors is performed [60]. Each muon candidate is matched uniquely to exactly one ID
track and is required to satisfy |𝜂| < 2.4 and 𝑝T>20 GeV.
Identification and isolation criteria are applied to electron and muon candidates to suppress non-prompt leptons from hadron decays. Identification criteria are based on shower shapes and track parameters for the electrons, and on track parameters for the muons. The isolation criteria use information about ID tracks and calorimeter energy deposits in a fixed cone of Δ𝑅 = 0.2 around each lepton. Electrons must satisfy the ‘medium’ identification criteria as well as the loose isolation criteria described in Ref. [59], which have a
combined efficiency of 75–85 % depending on the electron 𝑝T. Muon candidates are required to satisfy
the ‘medium’ identification and loose isolation criteria introduced in Ref. [60], which have an efficiency
of about 95%. The significance of the transverse impact parameter, defined as the absolute value of 𝑑0,
divided by its uncertainty, 𝜎𝑑
The decision on whether or not to record the event was made by single-electron or single-muon triggers with requirements on lepton identification and isolation similar to those applied offline. The transverse
momentum thresholds for these triggers were 24 GeV for electrons [61] and 20 GeV for muons [62] in
2015, whilst during the 2016–2018 data-taking period the thresholds were both raised to 26 GeV and
requirements on lepton identification and isolation were tightened. Complementary triggers with higher 𝑝T
thresholds and no isolation or looser identification criteria were used to increase the trigger efficiency.
Events are required to contain exactly two leptons of opposite electric charge that satisfy the above criteria. One of the leptons must have transverse momentum exceeding 27 GeV and be matched to an object that provided one of the triggers used for the read-out and storage of the event. The invariant mass of the two
selected leptons must exceed 𝑚ℓ ℓ = 20 GeV. Both same-flavour (𝑒𝑒/𝜇𝜇) and different-flavour (𝑒𝜇) events
are accepted either for auxiliary measurements or for the signal extraction, respectively.
The interaction vertex is reconstructed from the two leptons in the event, ℓ1and ℓ2, as the weighted average
𝑧-position of the tracks extrapolated to the beam line:
𝑧ℓ ℓ vtx = 𝑧ℓ 1sin 2𝜃ℓ 1+ 𝑧ℓ2sin 2𝜃ℓ 2 sin2𝜃ℓ 1+ sin 2𝜃ℓ 2 ,
where sin2𝜃ℓ approximately parameterises the resolution of the 𝑧-position [10]. This definition of the
interaction vertex is not biased by the presence of additional tracks from hadronic activity in association with the dilepton pair production or by additional tracks from nearby pile-up interactions. It results in a 30% higher efficiency than a primary vertex selection based on the sum of squared track transverse
momenta [63]. Requirements are placed on each lepton to fulfil | (𝑧ℓ− 𝑧
ℓ ℓ
vtx) sin 𝜃| < 0.5 mm.
A window of Δ𝑧 = ±1 mm around 𝑧ℓ ℓvtxdefines the region in which ID tracks are matched to the interaction
vertex. The number of tracks in this window, excluding those used in the reconstruction of leptons, is
counted as 𝑛trk. Signal 𝛾𝛾 → 𝑊𝑊 event candidates are selected using the exclusivity requirement that
𝑛
trk = 0. Events with low track multiplicities, 1 ≤ 𝑛trk ≤ 4, are used to evaluate backgrounds. The
modelling of 𝑛trk is therefore vital to the extraction of the 𝛾𝛾 → 𝑊𝑊 signal, and this is discussed further
in the following section.
5 Modelling of signal and backgrounds
Corrections are applied to the simulated signal and background event samples to adjust the lepton trigger, reconstruction, identification and isolation efficiencies, as well as the energy and momentum resolutions, to those observed in data. The muon momentum scale is corrected in the MC simulation, whilst the electron
energy scale is corrected in data [59–62]. Accurate modelling of the transverse momenta of the bosons is
important because of its correlation with the expected charged-particle multiplicity from hadronic activity.
The 𝑝𝑊 𝑊T distribution in the MC samples for quark-induced 𝑊𝑊 production is reweighted to the theoretical
calculation at next-to-next-to-leading-order (NNLO) accuracy in perturbative quantum chromodynamics
with resummation of soft gluon emissions up to next-to-next-to-next-to-leading-logarithm (N3LL) accuracy
using MATRIX+RadISH [48, 49, 64–72]. A correction for the transverse momentum distribution of
dilepton pairs from the DY process is derived from data using 𝑒𝑒 and 𝜇𝜇 final states with an invariant mass within 15 GeV of the nominal 𝑍 boson mass corrected for background, and is applied to all DY samples as
account for (i) mismodelling of the additional 𝑝 𝑝 interactions produced in the same bunch crossing, (ii) mismodelling of the charged-particle multiplicity in the 𝑞𝑞 → 𝑊𝑊 background process, and (iii) second scatterings and the dissociative contribution to the 𝛾𝛾 → 𝑊𝑊 signal process.
5.1 Modelling of additional 𝒑 𝒑 interactions
Tracks from nearby additional 𝑝 𝑝 interactions can be matched to the interaction vertex and, thus, lower the efficiency of the exclusivity requirement. Their number depends on the density of additional 𝑝 𝑝 interactions and the number of tracks originating from these interactions. Data-driven techniques are used to derive corrections to the simulated events to further improve their description of the data, targeting the density of 𝑝 𝑝 interactions and the number of tracks per interaction separately.
The simulated events are reweighted such that the distribution of the average number of 𝑝 𝑝 interactions per bunch crossing reproduces the one measured in the data. The longitudinal width of the beam spot, 𝜎BS, determines the average density, along 𝑧, of additional 𝑝 𝑝 interactions near the interaction vertex. The average longitudinal width of the beam spot varied throughout the data-collection period due to changes in the LHC beam optics. It was about 44 mm in 2015 and between 34 and 38 mm in 2016–2018 compared to 42 mm in MC simulation. The photon-induced MC samples were produced with both, the nominal conditions in MC simulation and also with a beam spot width of 35 mm to study the impact of these settings. Only the latter samples were used in the final analysis. To account for the different densities of additional 𝑝 𝑝 interactions in data and simulation, the beam spot width is effectively corrected by modifying the matching of tracks to the interaction vertex in simulation: tracks classified as originating from a pile-up interaction are counted in 𝑛trkif they have a longitudinal impact parameter 𝑧 within 1 mm × 𝜎MCBS/𝜎DataBS
of 𝑧ℓ ℓvtx. The values for 𝜎DataBS are sampled from the LHC run conditions during Run 2 according to the
luminosity taken at a given value of 𝜎DataBS .
An ancillary data measurement is used to determine the correction for the number of tracks from additional
𝑝 𝑝interactions randomly matched to the interaction vertex, 𝑛PU
trk. In same-flavour 𝑍 → ℓℓ events, this
correction is obtained by counting the number of tracks satisfying the nominal selection criteria relative to a random position in 𝑧 that is well separated from the interaction vertex, |𝑧ℓ ℓvtx− 𝑧| > 10 mm. Each event is sampled multiple times using non-overlapping regions in 𝑧. This procedure optimises the statistical power, but does not consider the actual distribution of 𝑧ℓ ℓvtxalong 𝑧. To correct for the resulting bias, 𝑛PUtrk is extracted as a function of the 𝑧-coordinate and weighted with the normalised beam spot distribution.
This method is tested using simulated events and found to reproduce the 𝑛PUtrk distribution in data within
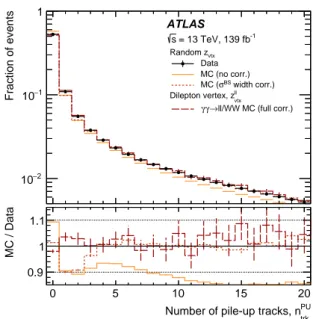
0.1–3.5% for low track multiplicities, with larger disagreement for larger 𝑛trk. Figure2shows the probability
distribution of 𝑛PUtrk associated with 𝑧ℓ ℓvtx, extracted in data and simulation before and after the corrections for the beam spot width. The bottom panel shows the ratio to data. The inverse ratio of the beam-spot-corrected
simulation to data corresponds to the correction applied as a function of 𝑛PUtrk in the simulation. The
distributions of the number of 𝑛PUtrk in 𝛾𝛾 → ℓℓ and 𝛾𝛾 → 𝑊𝑊 MC events are shown after the beam spot
and the pile-up corrections. Before any corrections, the disagreement can be up to 15% depending on the
beam spot conditions in the simulation. After the 𝜎BScorrection, for low track multiplicities disagreements
of about 10% persists because the 𝜎BScorrection only improves the modelling of the density of the pile-up
vertices but not of their track multiplicity. This is corrected using the 𝑛PUtrk correction. The full set of corrections is applied to all MC samples used in the analysis.
The presence of the additional tracks from pile-up will randomly lead to the rejection of signal events and therefore the distribution of 𝑛PUtrk can be used to extract the signal efficiency of the exclusivity requirement
2 − 10 1 − 10 1 Fraction of events ATLAS -1 = 13 TeV, 139 fb s vtx Random z Data MC (no corr.) width corr.) BS σ MC ( vtx ll Dilepton vertex, z ll/WW MC (full corr.) → γ γ 0 5 10 15 20 PU trk
Number of pile-up tracks, n 0.9
1 1.1
MC / Data
Figure 2: The normalised distribution of tracks from additional 𝑝 𝑝 interactions, 𝑛PUtrk, associated with the interaction vertex, in data and signal simulated with a beam spot width of 𝜎MCBS = 42 mm. For data, 𝑛PUtrk is determined using a random 𝑧-position along the beam axis away from the interaction vertex. The same quantity is shown for simulated 𝛾 𝛾→ 𝑊𝑊 events before and after correcting the beam spot width to the one observed in data. The inverse ratio of the beam-spot-corrected simulation to data corresponds to the correction applied to 𝑛PUtrk in the simulation using the Geant4-based classification. To demonstrate the closure of the correction, the number of tracks reconstructed in elastic 𝛾𝛾 → 𝑊𝑊 signal MC samples is shown after applying the full set of corrections, namely the 𝜎BScorrection and the 𝑛PUtrk correction. The shown uncertainties are statistical only.
(𝑛trk = 0). This exclusive efficiency depends strongly on the number of interactions per bunch crossing and
the general beam conditions. The average efficiency for the 2015–2018 dataset with an average 𝜇intof 33.7
is 52.6%. It drops from 60% at 𝜇int = 20 to about 30% at 𝜇int = 60. When comparing the data-driven
efficiency with that obtained directly from signal MC samples, the results agree to better than 0.2%.
The full effect of the data-driven correction for tracks from additional 𝑝 𝑝 interactions is assigned as a systematic uncertainty, resulting in 1% and 3% uncertainty in the efficiency to select events without any
additional associated tracks (𝑛trk = 0) for signal and background, respectively. The uncertainty of having a
low number of tracks associated with the vertex (1 ≤ 𝑛trk ≤ 4) is 2% for photon-induced processes and
10% for quark- and gluon-induced processes.
5.2 Modelling of the underlying event
For quark-induced diboson production, additional charged particles can be produced from initial-state radiation or secondary partonic scatters in the same 𝑝 𝑝 collision, also called the underlying event. However,
for low values of the number of charged particles, the 𝑛chdistribution was found to be not well modelled
by many of the phenomenological models implemented in the generators [73–76]. The underlying event
can be assumed to be similar for quark-induced production of different colourless final states if the
transverse momenta of these final states are comparable [76]. Therefore, the charged-particle multiplicity
in 𝑞𝑞 → 𝑊𝑊 events can be constrained using data measurements of DY production of ℓℓ pairs in 𝑝 𝑝 collisions. Specifically, the charged-particle multiplicity is measured for 𝑍 → ℓℓ produced in slices of 𝑝ℓ ℓT .
This two-dimensional measurement is then used to correct the DY and diboson simulation. The general validity of this approach has been tested using DY and diboson samples generated with Powheg+Pythia8, Sherpa and Powheg+Herwig7. The multiplicity spectra of charged particles are found to be very different in the different MC samples, yet relatively similar between the respective DY and diboson processes at a
constant value of the boson or diboson 𝑝Twith the agreement being of the order to 10-20%.
The 𝑍 → ℓℓ events are selected using the criteria described in Section4with an additional requirement on
the dilepton mass (70 GeV < 𝑚ℓ ℓ <105 GeV) to suppress contributions from background processes. The
contribution of pile-up tracks is estimated from data by sampling random 𝑧-positions well separated from
the dilepton vertex as discussed in Section5.1. The background at low track multiplicities is dominated
by 𝛾𝛾 → ℓℓ events, which have a different 𝑝ℓ ℓT dependence than DY events and amount to about 5% of
the total events selected with 70 GeV < 𝑚ℓ ℓ < 105 GeV and 𝑛trk = 0 while their contribution is 0.5%
or smaller for higher track multiplicities. The relative normalisations for the elastic, single-dissociative
and double-dissociative 𝛾𝛾 → ℓℓ as well as the DY process are determined in a fit to the measured 𝑝ℓ ℓT
distribution in a 𝑚ℓ ℓ >105 GeV sideband, requiring 𝑛trk= 0 and using the shapes from MC simulation. In
this sideband, the 𝛾𝛾 → ℓℓ process contributes about 60% to the total event sample. The contribution from the 𝛾𝛾 → 𝑊𝑊 process with a same-flavour final state amounts to less than 1% of the 𝛾𝛾 → ℓℓ processes in this kinematic region and is neglected. The overall normalisations of the different 𝛾𝛾 → ℓℓ contributions relative to the prediction are compatible within the statistical uncertainty with those from
earlier ATLAS studies [77].
After the 𝛾𝛾 → ℓℓ and pile-up contributions are subtracted as backgrounds, D’Agostini unfolding [78,
79] is used to unfold the distribution of the reconstructed track multiplicity, 𝑛trk, to that of the number of
charged particles, 𝑛ch, using four iterations.2 The charged-particle multiplicity is extracted as a function
of the 𝑝T of the dilepton system, which corresponds to the transverse momentum of the recoil, using
5-GeV-wide intervals of 𝑝T. The largest sources of uncertainty are the contributions from pile-up tracks
and uncertainties in the distribution used as the prior, assessed by comparing Powheg+Pythia8 and Sherpa. Other uncertainties originate from the event selection and the 𝛾𝛾 → ℓℓ background subtraction, assessed by varying the kinematic selection and the normalisation of the photon-induced background within
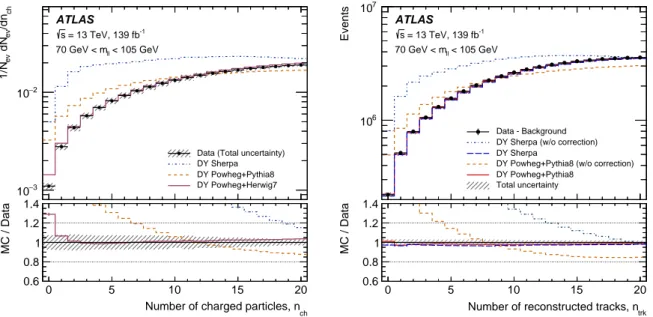
the uncertainties of the fit in the 𝑚ℓ ℓ sideband. Figure3(left) compares the unfolded charged-particle
multiplicity distribution for different MC models and data. For low values of 𝑛ch, the charged-particle
multiplicity distribution is mismodelled by a factor of 2.5 in Powheg+Pythia8 and by a factor of 4 in
Sherpa, whilst good agreement with the Powheg+Herwig7 model is found except at 𝑛ch= 0 where the
Powheg+Herwig7 prediction exceeds the data yield by about 30%.
The charged-particle multiplicity in simulated DY events is corrected using per-event weights determined as the ratio of the unfolded data to the unfolded MC simulation as a function of the charged-particle multiplicity,
and of the particle-level 𝑝T of the decay products of the 𝑍 boson. The impact of the charged-particle
multiplicity correction is shown in Figure3(right) for DY events. The simulation is shown both before and
after the correction for pile-up modelling and underlying-event modelling in 𝑍 → ℓℓ events satisfying
70 GeV < 𝑚ℓ ℓ <105 GeV. The corrections bring the MC simulation into agreement with data within
the systematic uncertainty of the charged-particle measurement. The correction for the underlying-event modelling is applied to 𝑊𝑊 , 𝑊 𝑍 and 𝑍 𝑍 processes as a function of the charged-particle multiplicity, and
of the particle-level 𝑝Tof the decay products of the diboson system.
2Similarly to Ref. [80], charged particles are defined to be stable if they have a mean lifetime 𝜏 > 30 ps and satisfy 𝑝
T>500 MeV
3 − 10 2 − 10 ch /dn ev dN ev 1/N ATLAS -1 = 13 TeV, 139 fb s < 105 GeV ll 70 GeV < m
Data (Total uncertainty) DY Sherpa DY Powheg+Pythia8 DY Powheg+Herwig7
0 5 10 15 20
ch
Number of charged particles, n 0.6 0.8 1 1.2 1.4 MC / Data 6 10 7 10 Events ATLAS -1 = 13 TeV, 139 fb s < 105 GeV ll 70 GeV < m Data - Background DY Sherpa (w/o correction) DY Sherpa
DY Powheg+Pythia8 (w/o correction) DY Powheg+Pythia8
Total uncertainty
0 5 10 15 20
trk
Number of reconstructed tracks, n 0.6 0.8 1 1.2 1.4 MC / Data
Figure 3: On the left, the normalised number of events with a given number of charged particles, 1/NevdNev/dnch,
predicted by Sherpa Powheg+Pythia8, and Powheg+Herwig7 is compared with the unfolded data. The ratio on the bottom is the inverse of the weights that are applied at particle level as a function of the number of charged particles. The effect of the correction for the underlying event is illustrated for the number of reconstructed tracks on the right. Sherpa and Powheg+Pythia8 are shown before and after the correction and compared with data. The total uncertainty of the correction is shown for Powheg+Pythia8 in the upper panel, and as a band around unity for the lower panel. The total uncertainties for Sherpa and Powheg+Pythia8 are very similar.
5.3 Signal modelling
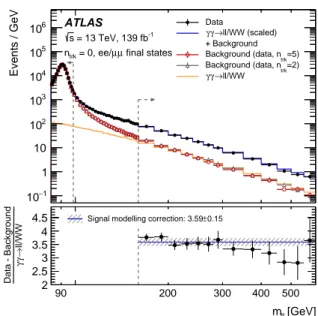
After the initial 𝛾𝛾 → 𝑊𝑊 process, the protons can undergo a second inelastic interaction. These additional rescatterings do not change the kinematics of the 𝛾𝛾 → 𝑊𝑊 process, but lead to the production of particles such that the cross section of 𝛾𝛾 → 𝑊𝑊 production without associated tracks is reduced. This effect is not included in the modelling of the signal. The probability that no such additional particles are produced is commonly referred to as the survival factor. In addition, the 𝛾𝛾 → 𝑊𝑊 signal when applying the exclusivity requirement is modelled by Herwig7, which includes only the elastic component. To obtain a better estimate of the expected signal yield including the dissociative components and to correct for effects from the rescattering of protons, a correction factor is obtained from a 𝛾𝛾 → ℓℓ control sample in data, following a procedure similar to that applied in Refs. [4,6] using same-flavour lepton final states. To enhance the purity in 𝛾𝛾 → ℓℓ production and to mimic the kinematic threshold of 𝛾𝛾 → 𝑊𝑊 production,
the dilepton mass is required to be larger than 160 GeV. The exclusivity requirement of 𝑛trk = 0 is applied.
In the region, where the correction factor is extracted, the predicted event yield from the 𝛾𝛾 → 𝑊𝑊 process with same-flavour final states is approximately 1.5% of the 𝛾𝛾 → ℓℓ yield so that the derived correction factor is essentially independent of the 𝛾𝛾 → 𝑊𝑊 signal process.
The background, dominated by DY production, is estimated using a data-driven technique. The shape of
the 𝑚ℓ ℓ distribution for background events is estimated using events with 𝑛trk= 5, which is a compromise
between small signal contamination and closeness to the signal region. This template is normalised to the 𝑛
trk = 0 selection using a narrow window around the nominal 𝑍 boson mass (83.5 GeV < 𝑚ℓ ℓ < 98.5 GeV)
where the contribution from photon-induced processes is small. The 𝑚ℓ ℓlineshape in simulated DY events
When the exclusivity requirement of 𝑛trk= 0 is applied, the ratio of the yield from photon-induced processes
in data to the MC prediction for the elastic processes is found to be 3.59 ± 0.15 (tot.). This agrees with the expectation of 3.55 obtained using the MC prediction. It has been verified that the signal modelling correction does not vary as a function of 𝑝
𝑒 𝜇
T within the boundaries used to extract the signal.
Figure4illustrates the extraction of the signal modelling correction from data. The signal modelling
correction is only applicable to events with 𝑛trk= 0. The simulated Herwig7 events are used in conjunction
with the signal modelling correction for predictions of photon-induced processes in events where the 𝑛
trk = 0 requirement is applied, while the event samples from MG5_aMC@NLO+Pythia8 are used for
predictions in regions with larger track multiplicities.
Uncertainties are evaluated by increasing the mass window of the DY background normalisation region to
73.5 GeV < 𝑚ℓ ℓ < 108.5 GeV and by changing the number of tracks used in the selection of the template,
using 𝑛trk = 2 instead of the nominal value. The resulting uncertainty in the signal modelling correction
amounts to 4.2%. When the signal modelling correction is applied to 𝛾𝛾 → 𝑊𝑊 , an additional transfer uncertainty is included to account for potential differences between 𝛾𝛾 → ℓℓ and 𝛾𝛾 → 𝑊𝑊 events due to the fact that rescattering effects are mass-dependent. It is calculated as the largest variation that arises
from placing different lower bounds on the evaluation region; the lower bound on 𝑚ℓ ℓwas varied from
𝑚ℓ ℓ = 110 GeV to 400 GeV in intervals of 10 GeV. The resulting uncertainty amounts to 11%. This
uncertainty affects only the scaling of the 𝛾𝛾 → 𝑊𝑊 process and thus the measured signal strength and any cross section prediction derived using the signal correction factor, but cancels out in the measurement of the fiducial cross section.
6 Event categories and background estimation
One signal region and three control regions, enriched in signal and background events respectively, are defined using the dilepton transverse momentum, 𝑝
𝑒 𝜇
T , and the number of additional tracks associated with
the interaction vertex, 𝑛trk. The signal region is defined by selecting 𝑝 𝑒 𝜇
T >30 GeV and 𝑛trk= 0. It has an
expected purity of 57% and an expected background contamination from 𝑞𝑞 → 𝑊𝑊 production of 33%.
Additional kinematic regions with alternative requirements on 𝑝
𝑒 𝜇
T and 𝑛trkare used to control the modelling
of background processes. The first control region is defined by 𝑝
𝑒 𝜇
T < 30 GeV and 1 ≤ 𝑛trk ≤ 4 and
helps to constrain the DY(𝑍 /𝛾∗ → 𝜏𝜏) normalisation, as this process contributes 75% of the selected
events in this region. It also has non-negligible contributions from 𝑞𝑞 → 𝑊𝑊 events and non-prompt leptons. The second control region is defined by 𝑝
𝑒 𝜇
T >30 GeV and 1 ≤ 𝑛trk ≤ 4 and is designed to be
enriched in 𝑞𝑞 → 𝑊𝑊 events, with an expected contribution of about 70% from that process and minor contributions from the DY process and non-prompt lepton events. An additional control region is selected with 𝑝
𝑒 𝜇
T < 30 GeV and 𝑛trk = 0. It brings some additional control for the modelling of backgrounds
specific to events with no tracks, however has a signal contamination of the order of 10%. The boundaries between these regions are chosen such that good signal–background separation is achieved. In addition, the regions used to control the normalisation of the backgrounds are defined to be topologically very similar to the signal region, which helps to minimise uncertainties in extrapolating the normalisation from the control regions to the signal region.
Background events from non-prompt leptons contribute about 6% of the selected signal candidates in the signal region. The primary source of these backgrounds in dilepton events is 𝑊 +jets production where one of the leptons is prompt and the other stems from light-hadron or heavy-flavour decays. Background events
1 − 10 1 10 2 10 3 10 4 10 5 10 6 10 Events / GeV ATLAS -1 = 13 TeV, 139 fb s final states µ µ = 0, ee/ trk n Data ll/WW (scaled) → γ γ + Background =5) trk Background (data, n =2) trk Background (data, n ll/WW → γ γ 90 200 300 400 500 [GeV] ll m 2 2.5 3 3.5 4 4.5 ll/WW →γ γ Data - Background 0.15 ± Signal modelling correction: 3.59
Figure 4: The distribution of 𝑚ℓ ℓ in the region where the signal modelling correction is extracted as the ratio of
the yield of 𝛾𝛾 → ℓℓ and 𝛾𝛾 → 𝑊𝑊 processes passing the exclusivity requirement of 𝑛trk = 0 to the yield of
the simulated elastic process only. Shown are the data, where a requirement of 𝑛trk= 0 has been applied, and the
background templates selected from data using 𝑛trk = 2 and 𝑛trk = 5. In addition, the 𝛾𝛾 → ℓℓ and 𝛾𝛾 → 𝑊𝑊
MC predictions are depicted, as well as the sum of the nominal background template (𝑛trk= 5) and the 𝛾𝛾 → ℓℓ
and 𝛾𝛾 → 𝑊𝑊 MC predictions scaled by the signal modelling correction. The normalisation region around the nominal 𝑍 boson mass is indicated with a vertical dashed line, as is the region where the signal modelling correction is extracted (𝑚ℓ ℓ >160 GeV). The excess in data relative to the elastic 𝛾𝛾 → ℓℓ and 𝛾𝛾 → 𝑊𝑊 prediction is
attributed to the dissociative photon-induced processes and used to extract the signal modelling correction that is shown in the lower panel of the plot. The uncertainties shown are statistical only.
from non-prompt leptons are estimated from a control region where exactly one of the leptons must fail to satisfy some of the lepton identification criteria of the nominal event selection. All other kinematic selection criteria are the same as for the signal selection. The contribution from non-prompt leptons is then estimated by scaling the number of events in the control region by the ratio of the number of non-prompt leptons passing all identification requirements to those failing some of these requirements. This ratio is measured in data selected with one electron and one muon with the same electric charge, and requiring
1 ≤ 𝑛trk ≤ 4. Contributions from prompt leptons are subtracted using MC simulation. For the extrapolation
to the event samples selected with 𝑛trk = 0 a dedicated uncertainty is assigned.
7 Systematic uncertainties
Uncertainties and their correlations are evaluated in each of the signal and control regions. The uncertainties in the measurement of tracks originate from uncertainties in the inner detector alignment, the reconstruction efficiency, and the probability to incorrectly reconstruct tracks by including hits from noise or from several tracks. The combined uncertainty amounts to 5–7% of the event yields for DY and 𝑞𝑞 → 𝑊𝑊 production, whilst for photon-induced processes these uncertainties are < 1% in the regions where these processes contribute significantly.
Systematic uncertainties in the event yields due to electron and muon reconstruction, including effects from the trigger and reconstruction efficiencies, energy/momentum scale and resolution, and pile-up modelling are 0.5% and up to 2% depending on the process, in the signal and control regions, respectively [59–62].
The uncertainty in the background from non-prompt leptons is dominated by the uncertainty in the measurement of the ratio of non-prompt leptons passing all identification requirements to those failing some, in particular the subtraction of contributions from genuine leptons in the numerator of that ratio. The resulting uncertainty on this background estimation ranges between 50% and 100% depending on the region. The statistical uncertainty in the control region for the estimation of background from misidentified leptons is also a significant source of uncertainty.
The uncertainties in the correction of pile-up modelling and the underlying event as well as the uncertainty
in the signal modelling correction are described in Section5. The correction for the underlying-event
modelling in the 𝑊𝑊 , 𝑊 𝑍 and 𝑍 𝑍 processes is derived in bins of 𝑝ℓ ℓT , but applied as a function of diboson 𝑝
T, utilising the fact that there are only relatively small differences in charged-particle multiplicity between
the DY and diboson processes. Residual differences are evaluated at the particle level and considered as systematic uncertainties. For the largest source of background, the quark-induced 𝑊𝑊 process, further studies are made. The predicted event yields are compared for Powheg+Pythia8 and variations of the Pythia8 parton-shower tunes, and for Powheg+Herwig7 and Sherpa, with each prediction using its
dedicated underlying-event correction. The event yields agree well for 1 ≤ 𝑛trk ≤ 4, but disagree in the
signal region, 𝑛trk = 0. The background yield from the quark-induced 𝑊𝑊 process is estimated as the
average of the highest and lowest value of the various predictions, that is the midpoint of the most extreme predictions as no preference for either model can be deduced from the data. The envelope of all predictions is taken as the upper and lower one-standard-deviation boundary, amounting to ±7% for events selected
with 𝑛trk = 0, and amounting to less than 1% for events selected with 1 ≤ 𝑛trk ≤ 4. The uncertainties
in the total quark-induced 𝑊𝑊 cross section and the shape of the 𝑝𝑊 𝑊T distribution are taken from the
MATRIX+RadISH prediction used to reweight the 𝑊𝑊 samples, amounting to 5–6%.
Because of the specific event selection of the analysis, large uncertainties are applied to minor backgrounds,
where the 𝑛trk modelling cannot be easily studied in data: the uncertainty in the 𝑊 𝛾 normalisation is
taken to be ±100%, whereas uncertainties of ±30% are used for the normalisation of top-quark production and 𝑊𝑊 𝑗 𝑗 production through vector-boson scattering (VBS) as well as gluon-induced resonant and non-resonant 𝑊𝑊 production. The numbers are informed by the size of the underlying-event correction in DY and 𝑊𝑊 events and studies on events with forward jets outside the acceptance of the ID. For the smaller background contributions from 𝑊 𝑍 and 𝑍 𝑍 production the uncertainty is assessed by comparing the event yields predicted by Powheg+Pythia8 with those predicted in Sherpa after applying the underlying-event
correction described in Section5.2.
The systematic uncertainty in the measured cross section also includes a contribution due to differences in reconstruction efficiency between elastic and dissociative photon-induced processes as well as an uncertainty due to missing spin correlations in Herwig7, which mainly affects the 𝑝
𝑒 𝜇
T modelling. These uncertainties
are evaluated separately by comparing the reconstruction efficiency of the elastic-only prediction with that including all production mechanisms and by comparing the reconstruction efficiency between Herwig7 and MG5_aMC@NLO+Pythia8. Their combined effect is ±2%. Uncertainties stemming from the signal
8 Results
The 𝛾𝛾 → 𝑊𝑊 signal in proton–proton collisions is extracted using a profile likelihood fit of the estimated signal and background event yields to data. The fit uses the integrated event yields in the four kinematic
regions introduced in Section6, and the 𝑒𝑒 + 𝜇𝜇 events selected as described in Section5.3. It maximises
the product of Poisson probabilities to produce the observed number of data events, 𝑁obs, in each of these
regions [81].
The normalisation of the backgrounds from DY and 𝑞𝑞 → 𝑊𝑊 processes are free parameters in the
fit. The expected elastic 𝛾𝛾 → ℓℓ and 𝛾𝛾 → 𝑊𝑊 event yields for 𝑛trk = 0 are multiplied by the signal
modelling correction discussed in Section5.3, which is obtained as described within the fit to preserve the
experimental correlations correctly. The event yield for the 𝛾𝛾 → 𝑊𝑊 signal process is also multiplied by a signal strength that is a free parameter in the fit. Systematic uncertainties are included in the fit as nuisance parameters constrained by Gaussian functions. The fit can only constrain the sum of the backgrounds, since
the background composition is similar in events selected with 𝑛trk = 0 and those selected with 1 ≤ 𝑛trk ≤ 4.
Overall, the uncertainty in the sum of their yields is dominated by the systematic uncertainties assigned to
events selected with 𝑛trk = 0. In this fit, the background-only hypothesis is expected to be rejected with a
significance of 6.7 standard deviations.
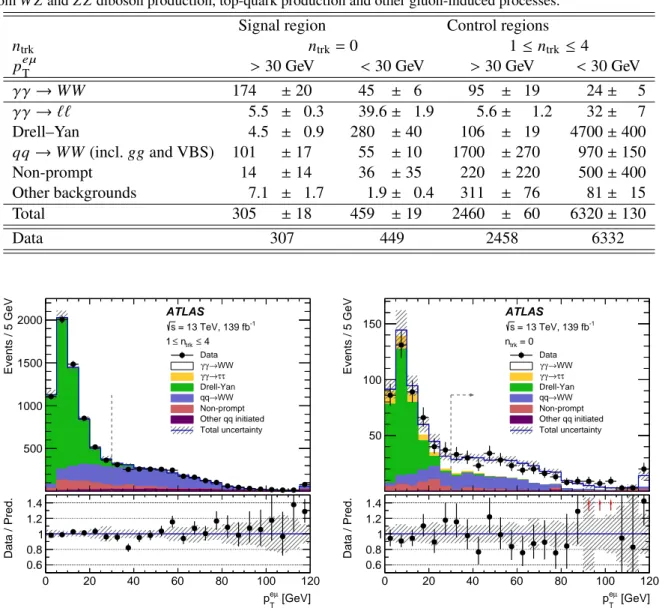
Table1gives an overview of the number of data events compared to background and signal event yields
in the different regions after the fit. The data yield in the signal region is 307, compared with 132 background events predicted by the best-fit result. The normalisations of the 𝑊𝑊 and the DY background are constrained with the help of the control regions to be 1.21+0.19−0.23(tot.) and 1.16+0.10−0.12(tot.), respectively.
By fitting the signal and background event yields in the signal and control regions, the background-only hypothesis is rejected with a significance of 8.4 standard deviations, assuming that the systematic uncertainties are Gaussian-distributed up to large values. A signal strength of 1.33+0.14−0.14(stat.)+0.22−0.17(syst.) is measured relative to the yield of elastic 𝛾𝛾 → 𝑊𝑊 events predicted by Herwig7 scaled by the signal modelling correction to account for all photon-induced production mechanisms in a phase space with no tracks associated with the interaction vertex. These results constitute the observation of photon-induced
𝑊 𝑊 production in 𝑝 𝑝 collisions, a process for which only evidence with significances of 3.0 𝜎 [4] and
3.6 𝜎 [6] was previously reported.
Figure5shows two 𝑝
𝑒 𝜇
T distributions: on the left for events with 1 ≤ 𝑛trk ≤ 4 associated with the interaction
vertex, and, on the right, for events with the exclusivity requirement of no tracks. The boundary between low- and high-𝑝
𝑒 𝜇
T control and signal regions is at 30 GeV. The distributions in Figure5include the fitted
normalisations and nuisance parameters described above; the resulting predictions are in good agreement
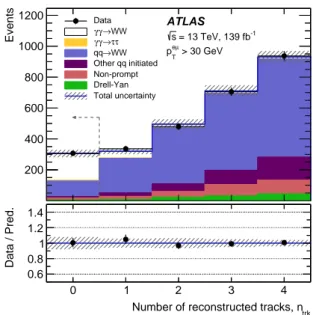
with the data. Figure6shows the distribution of the number of reconstructed tracks for 𝑝
𝑒 𝜇 T
>30 GeV.
The fiducial phase space used for the cross-section measurement is defined to be close to the acceptance of the detector. The leptons must at particle level satisfy the pseudorapidity requirement |𝜂| < 2.5. One of the leptons is required to have a transverse momentum of at least 27 GeV, whilst the other must have 𝑝
T > 20 GeV. They are required to be prompt leptons from 𝑊 decays. Photons in a cone of Δ𝑅 = 0.1
around a lepton and not originating from the decays of hadrons are added to the four-momentum of the lepton, that is leptons are “dressed”. Events with exactly two leptons are selected with opposite-sign and different-flavour final states. Decays of either 𝑊 boson into a 𝜏-lepton and neutrino are excluded. The
invariant mass of the dilepton system is required to be 𝑚ℓ ℓ > 20 GeV and its transverse momentum must be
𝑝
𝑒 𝜇
T > 30 GeV. The number of charged particles, 𝑛ch, with 𝑝T >500 MeV and within |𝜂| < 2.5, excluding
Table 1: Summary of the data event yields, and the predicted signal and background event yields in the signal region and control regions as obtained after the fit. The uncertainties shown include statistical and systematic components. Because the fit introduces correlations between systematic uncertainties, the uncertainty in the total expected yield is smaller than its components. The leftmost column of values corresponds to the signal region used to measure 𝛾𝛾 → 𝑊𝑊 in proton–proton collisions. The numbers for 𝑞𝑞 → 𝑊𝑊 also contain a small contribution from gluon-induced 𝑊𝑊 and electroweak 𝑊𝑊 𝑗 𝑗 production. The event yields for other backgrounds include contributions from 𝑊 𝑍 and 𝑍 𝑍 diboson production, top-quark production and other gluon-induced processes.
Signal region Control regions
𝑛
trk 𝑛trk= 0 1 ≤ 𝑛trk ≤ 4
𝑝
𝑒 𝜇 T
>30 GeV <30 GeV >30 GeV <30 GeV
𝛾 𝛾→ 𝑊𝑊 174 ± 20 45 ± 6 95 ± 19 24 ± 5 𝛾 𝛾→ ℓℓ 5.5 ± 0.3 39.6 ± 1.9 5.6 ± 1.2 32 ± 7 Drell–Yan 4.5 ± 0.9 280 ± 40 106 ± 19 4700 ± 400 𝑞 𝑞→ 𝑊𝑊 (incl. 𝑔𝑔 and VBS) 101 ± 17 55 ± 10 1700 ± 270 970 ± 150 Non-prompt 14 ± 14 36 ± 35 220 ± 220 500 ± 400 Other backgrounds 7.1 ± 1.7 1.9 ± 0.4 311 ± 76 81 ± 15 Total 305 ± 18 459 ± 19 2460 ± 60 6320 ± 130 Data 307 449 2458 6332 500 1000 1500 2000 Events / 5 GeV ATLAS -1 = 13 TeV, 139 fb s 4 ≤ trk n ≤ 1 Data WW → γ γ τ τ → γ γ Drell-Yan WW → qq Non-prompt Other qq initiated Total uncertainty 0 20 40 60 80 100 120 [GeV] µ e T p 0.6 0.8 1 1.2 1.4 Data / Pred. 50 100 150 Events / 5 GeV ATLAS -1 = 13 TeV, 139 fb s = 0 trk n Data WW → γ γ τ τ → γ γ Drell-Yan WW → qq Non-prompt Other qq initiated Total uncertainty 0 20 40 60 80 100 120 [GeV] µ e T p 0.6 0.8 1 1.2 1.4 Data / Pred.
Figure 5: The distributions of 𝑝
𝑒 𝜇
T for 1 ≤ 𝑛trk ≤ 4 (left) and 𝑛trk= 0 (right) are shown. The fitted normalisation
factors and nuisance parameters have been used. The yields for the likelihood fit are given by the integrals of the distributions split at 𝑝
𝑒 𝜇
T = 30 GeV, as indicated by the vertical dashed lines. The 𝛾𝛾 → 𝑊𝑊 signal region requires
a selection of 𝑝T𝑒 𝜇 >30 GeV with 𝑛
trk = 0, as indicated by the arrow. The 𝑞𝑞 → 𝑊𝑊 component also contains
a small contribution from gluon-induced 𝑊𝑊 and electroweak 𝑊𝑊 𝑗 𝑗 production. Similarly, ‘other 𝑞𝑞 initiated’ includes contributions not only from 𝑊 𝑍 and 𝑍 𝑍 diboson production but also from top-quark production and other gluon-induced processes. The total uncertainties are shown as hatched bands. The lower panels show the ratio of the data to the prediction, with the total uncertainty displayed as a hatched band. An arrow indicates that the ratio is off-scale. The last bin in both distributions includes the overflow.
200 400 600 800 1000 1200 Events ATLAS -1 = 13 TeV, 139 fb s > 30 GeV µ e T p Data WW → γ γ τ τ → γ γ WW → qq Other qq initiated Non-prompt Drell-Yan Total uncertainty 0 1 2 3 4 trk
Number of reconstructed tracks, n 0.6 0.8 1 1.2 1.4 Data / Pred.
Figure 6: The distribution of the number of tracks associated with the interaction vertex is shown. The fitted normalisation factors and nuisance parameters have been used. The 𝛾𝛾 → 𝑊𝑊 signal region requires a selection of 𝑛
trk= 0, as indicated by the vertical dashed line. The 𝑞𝑞 → 𝑊𝑊 component also contains a small contribution from
gluon-induced 𝑊𝑊 and electroweak 𝑊𝑊 𝑗 𝑗 production. Similarly, ‘other 𝑞𝑞 initiated’ includes contributions not only from 𝑊 𝑍 and 𝑍 𝑍 diboson production but also from top-quark production and other gluon-induced processes. The total uncertainties are shown as hatched bands. The lower panel shows the ratio of the data to the prediction, with the total uncertainty displayed as a hatched band.
Without requirements on the number of reconstructed tracks, the selection efficiency after reconstruction is
75% for elastic 𝛾𝛾 → 𝑊𝑊 events in the fiducial region. The full selection efficiency after applying 𝑛trk= 0
is 39%. The predicted number of signal events includes a ∼5% contribution of leptons from 𝑊 → 𝜏𝜈𝜏,
𝜏→ ℓ𝜈ℓ𝜈𝜏, which is estimated using the MC simulation and which is removed from the measured fiducial
cross section using this fractional contribution.
The observed signal strength translates into a fiducial cross section of
𝜎
meas= 3.13 ± 0.31 (stat.) ± 0.28 (syst.) fb
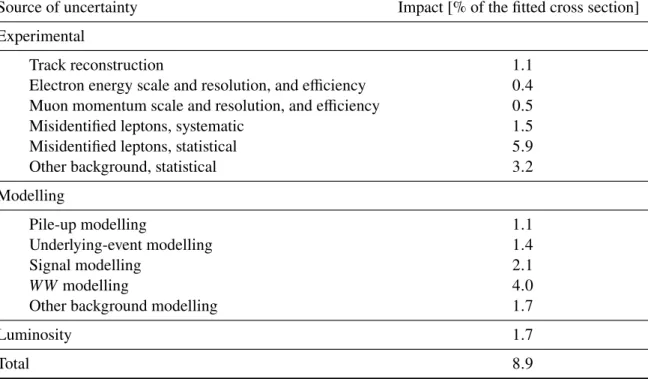
for 𝑝 𝑝 (𝛾𝛾) → 𝑝(∗)𝑊+𝑊−𝑝(∗) production with 𝑊+𝑊−→ 𝑒±𝜈 𝜇∓𝜈. The uncertainties correspond to the statistical and systematic uncertainties, respectively. Table2gives an overview of the sources of systematic
uncertainties, which are discussed in Section7and presents their effect on the measured cross section. To
evaluate the impact of one source of systematic uncertainty, the fit is performed with the corresponding nuisance parameter fixed one standard deviation up or down from the value obtained in the nominal fit, then these high and low variations are symmetrised.
The data measurement can be compared with two types of predictions. The first, used in the definition of the signal strength and the calculation of the expected significance, is based on the Herwig7 prediction for elastic 𝛾𝛾 → 𝑊𝑊 events scaled by the data-driven signal modelling correction to include the dissociative processes and rescattering effects as described in Section5.3. It is found to be
𝜎
Table 2: The impact of different components of systematic uncertainty on the measured fiducial cross section, without taking into account correlations. The impact of each source of systematic uncertainty is computed by first performing the fit with the corresponding nuisance parameter fixed to one standard deviation up or down from the value obtained in the nominal fit, then these high and low variations are symmetrised. The impacts of several sources of systematic uncertainty are added in quadrature for each component.
Source of uncertainty Impact [% of the fitted cross section]
Experimental
Track reconstruction 1.1
Electron energy scale and resolution, and efficiency 0.4
Muon momentum scale and resolution, and efficiency 0.5
Misidentified leptons, systematic 1.5
Misidentified leptons, statistical 5.9
Other background, statistical 3.2
Modelling
Pile-up modelling 1.1
Underlying-event modelling 1.4
Signal modelling 2.1
𝑊 𝑊modelling 4.0
Other background modelling 1.7
Luminosity 1.7
Total 8.9
where the uncertainty contains all experimental uncertainties and receives an additional component due to the transfer from the 𝛾𝛾 → ℓℓ to the 𝛾𝛾 → 𝑊𝑊 process described above. The uncertainties in the theory prediction are negligible because the scale uncertainty in the calculation of elastic production based on a photon-flux is small and partially cancels with the signal correction that is calculated with respect to the same photon-flux compared to the data. A standalone theory prediction for the fiducial cross section is computed with MG5_aMC@NLO+Pythia8 using the appropriate elastic or inelastic MMHT2015qed
PDF sets [82] for each of the contributions by applying the fiducial requirements to all photon-induced
contributions, which yields 4.3 ± 1.0 (scale) ± 0.1 (PDF) fb. The scale uncertainty is determined by varying the factorisation scale by factors of 2 and 0.5 and symmetrising the effect. The contributions to this cross-section prediction from elastic and single-dissociative production are 16% and 81%, respectively.
Double-dissociative production contributes only 3%. Using CT14qed [28] as the central PDF set yields a
prediction which is 26% smaller and amounts to 3.2 fb.
The MG5_aMC@NLO+Pythia8 prediction does not include rescattering effects that are expected to decrease the fiducial cross section. For elastic 𝛾𝛾 → 𝑊𝑊 production, a survival factor of 0.65
was estimated in Ref. [83]. In Ref. [84] a survival factor of 0.82 was calculated in a two-channel
eikonal model also accounting for the helicity structure of the hard scattering process.3 Multiplying
the MG5_aMC@NLO+Pythia8 prediction by these survival factors results in theoretical predictions of 2.8 ± 0.8 fb and 3.5 ± 1.0 fb, respectively, with the total uncertainties calculated as the quadratic sum of
scale and PDF uncertainties. These predictions are in agreement with the measurement.
9 Conclusion
The photon-induced production process, 𝛾𝛾 → 𝑊𝑊 , was studied in proton–proton collisions at √
𝑠= 13 TeV
recorded with the ATLAS detector at the LHC corresponding to an integrated luminosity of 139 fb−1.
Events with leptonic 𝑊 boson decays into 𝑒±𝜈 𝜇∓𝜈final states were selected by requiring that no tracks
except those of the two charged leptons are associated with the production vertex. The background-only hypothesis is rejected with a significance of 8.4 standard deviations whereas well above 5 𝜎 was expected. This measurement constitutes the observation of photon-induced 𝑊𝑊 production in 𝑝 𝑝 collisions, a process for which only evidence was previously reported. The signal strength and the cross section for the sum of elastic and dissociative production mechanisms are measured. The cross section for the 𝑝 𝑝(𝛾𝛾) → 𝑝(∗)𝑊+𝑊−𝑝(∗)process in the decay channel 𝑊+𝑊−→ 𝑒±𝜈 𝜇∓𝜈in a fiducial phase space close to the experimental acceptance is measured to be 3.13 ± 0.31 (stat.) ± 0.28 (syst.) fb. This result is in agreement with the theoretical predictions and may serve as input into EFT interpretations.
Acknowledgements
We thank CERN for the very successful operation of the LHC, as well as the support staff from our institutions without whom ATLAS could not be operated efficiently.
We acknowledge the support of ANPCyT, Argentina; YerPhI, Armenia; ARC, Australia; BMWFW and FWF, Austria; ANAS, Azerbaijan; SSTC, Belarus; CNPq and FAPESP, Brazil; NSERC, NRC and CFI, Canada; CERN; ANID, Chile; CAS, MOST and NSFC, China; COLCIENCIAS, Colombia; MSMT CR, MPO CR and VSC CR, Czech Republic; DNRF and DNSRC, Denmark; IN2P3-CNRS and CEA-DRF/IRFU, France; SRNSFG, Georgia; BMBF, HGF and MPG, Germany; GSRT, Greece; RGC and Hong Kong SAR, China; ISF and Benoziyo Center, Israel; INFN, Italy; MEXT and JSPS, Japan; CNRST, Morocco; NWO, Netherlands; RCN, Norway; MNiSW and NCN, Poland; FCT, Portugal; MNE/IFA, Romania; MES of Russia and NRC KI, Russia Federation; JINR; MESTD, Serbia; MSSR, Slovakia; ARRS and MIZŠ, Slovenia; DST/NRF, South Africa; MICINN, Spain; SRC and Wallenberg Foundation, Sweden; SERI, SNSF and Cantons of Bern and Geneva, Switzerland; MOST, Taiwan; TAEK, Turkey; STFC, United Kingdom; DOE and NSF, United States of America. In addition, individual groups and members have received support from BCKDF, CANARIE, Compute Canada and CRC, Canada; ERC, ERDF, Horizon 2020, Marie Skłodowska-Curie Actions and COST, European Union; Investissements d’Avenir Labex, Investissements d’Avenir Idex and ANR, France; DFG and AvH Foundation, Germany; Herakleitos, Thales and Aristeia programmes co-financed by EU-ESF and the Greek NSRF, Greece; BSF-NSF and GIF, Israel; La Caixa Banking Foundation, CERCA Programme Generalitat de Catalunya and PROMETEO and GenT Programmes Generalitat Valenciana, Spain; Göran Gustafssons Stiftelse, Sweden; The Royal Society and Leverhulme Trust, United Kingdom.
The crucial computing support from all WLCG partners is acknowledged gratefully, in particular from CERN, the ATLAS Tier-1 facilities at TRIUMF (Canada), NDGF (Denmark, Norway, Sweden), CC-IN2P3 (France), KIT/GridKA (Germany), INFN-CNAF (Italy), NL-T1 (Netherlands), PIC (Spain), ASGC (Taiwan), RAL (UK) and BNL (USA), the Tier-2 facilities worldwide and large non-WLCG resource
References
[1] E. Chapon, C. Royon and O. Kepka, Anomalous quartic 𝑊𝑊 𝛾𝛾, 𝑍 𝑍 𝛾𝛾, and trilinear 𝑊𝑊 𝛾
couplings in two-photon processes at high luminosity at the LHC,Phys. Rev. D 81 (2010) 074003,
arXiv:0912.5161 [hep-ph].
[2] B. Grzadkowski, M. Iskrzyński, M. Misiak and J. Rosiek, Dimension-six terms in the Standard
Model Lagrangian,JHEP 10 (2010) 085, arXiv:1008.4884 [hep-ph].
[3] O. J. P. Éboli, M. C. Gonzalez-García, S. M. Lietti and S. F. Novaes, Anomalous quartic gauge
boson couplings at hadron colliders,Phys. Rev. D 63 (2001) 075008, arXiv:hep-ph/0009262.
[4] ATLAS Collaboration, Measurement of exclusive 𝛾𝛾 → 𝑊+𝑊−production and search for exclusive
Higgs boson production in 𝑝 𝑝 collisions at
√
𝑠= 8 TeV using the ATLAS detector,Phys. Rev. D 94
(2016) 032011, arXiv:1607.03745 [hep-ex].
[5] CMS Collaboration, Study of exclusive two-photon production of 𝑊+𝑊− in 𝑝 𝑝 collisions at
√
𝑠 = 7 TeV and constraints on anomalous quartic gauge couplings,JHEP 07 (2013) 116, arXiv:
1305.5596 [hep-ex].
[6] CMS Collaboration, Evidence for exclusive 𝛾𝛾 → 𝑊+𝑊−production and constraints on anomalous
quartic gauge couplings in 𝑝 𝑝 collisions at
√
𝑠 = 7 and 8 TeV, JHEP 08 (2016) 119, arXiv:
1604.04464 [hep-ex].
[7] ATLAS Collaboration, The ATLAS Experiment at the CERN Large Hadron Collider,JINST 3 (2008)
S08003.
[8] ATLAS Collaboration, ATLAS Insertable B-Layer Technical Design Report, ATLAS-TDR-19;
CERN-LHCC-2010-013, 2010, url:https://cds.cern.ch/record/1291633.
[9] B. Abbott et al., Production and integration of the ATLAS Insertable B-Layer,JINST 13 (2018)
T05008, arXiv:1803.00844 [physics.ins-det].
[10] ATLAS Collaboration, Track Reconstruction Performance of the ATLAS Inner Detector at
√
𝑠 =
13 TeV, ATL-PHYS-PUB-2015-018, 2015, url:https://cds.cern.ch/record/2037683.
[11] ATLAS Collaboration, Performance of the ATLAS trigger system in 2015, Eur. Phys. J. C 77
(2017) 317, arXiv:1611.09661 [hep-ex].
[12] ATLAS Collaboration, Luminosity determination in 𝑝 𝑝 collisions at
√
𝑠= 13 TeV using the ATLAS
detector at the LHC, ATLAS-CONF-2019-021, 2019, url:https://cds.cern.ch/record/
2677054.
[13] ATLAS Collaboration, Characterization of Interaction-Point Beam Parameters Using the 𝑝 𝑝
Event-Vertex Distribution Reconstructed in the ATLAS Detector at the LHC, ATLAS-CONF-2010-027,
2010, url:https://cds.cern.ch/record/1277659.
[14] ATLAS Collaboration, ATLAS data quality operations and performance for 2015–2018 data-taking,
JINST 15 (2020) P04003, arXiv:1911.04632 [physics.ins-det].
[15] G. Avoni et al., The new LUCID-2 detector for luminosity measurement and monitoring in ATLAS,
JINST 13 (2018) P07017.
[16] ATLAS Collaboration, The ATLAS Simulation Infrastructure,Eur. Phys. J. C 70 (2010) 823, arXiv:
1005.4568 [physics.ins-det].