CALTECH/MIT
VOTING TECHNOLOGY PROJECT
A multi-disciplinary, collaborative project ofthe California Institute of Technology – Pasadena, California 91125 and
the Massachusetts Institute of Technology – Cambridge, Massachusetts 02139
TITLE
Assessing the Impact of E-Voting Technologies on
Electoral Outcomes: an Analysis of Buenos Aires'
2005 Congressional Election
Name Gabriel Katz
University California Institute of Technology
Name R. Michael Alvarez
University California Institute of Technology
Name Ernesto Calvo
University University of Houston
Name Marcelo Escolar
University Universidad de Buenos Aires
Name Julia Pomares
University London School of Economics
Key words:
VTP WORKING PAPER #91
GI-Edition
Lecture Notes
in Informatics
Robert Krimmer, Rüdiger Grimm (Eds.)
3
rdinternational Conference on
Electronic Voting 2008
Co-organized by Council of Europe,
Gesellschaft für Informatik and E-Voting.CC
August 6
th- 9
th, 2008
In Castle Hofen, Bregenz, Austria
Rober t Kr immer , Rüdig er Gr imm (Eds.): Electr onic V o ting 2008
Proceedings
Gesellschaft für Informatik (GI)
publishes this series in order to make available to a broad public
recent findings in informatics (i.e. computer science and
informa-tion systems), to document conferences that are organized in
co-operation with GI and to publish the annual GI Award dissertation.
Broken down into the fields of
• Seminar
• Proceedings
• Dissertations
• Thematics
current topics are dealt with from the fields of research and
development, teaching and further training in theory and practice.
The Editorial Committee uses an intensive review process in order
to ensure the high level of the contributions.
The volumes are published in German or English
Information: http://www.gi-ev.de/service/publikationen/lni/
The 2008 Conference on Electronic Voting took place in Castel Hofen near Bregenz at the wonderful Lake Constance from 6th to 9th August.
This volume contains 17 papers selected for the presentation at the conference out of more than 30 submissions. To assure a scientific quality, the selection was based on a strict and anonymous double-blind review process.
131
ISSN 1617-5468
Assessing the Impact of E-Voting Technologies on
Electoral Outcomes: an Analysis of Buenos Aires’ 2005
Congressional Election
Gabriel Katz1*, R. Michael Alvarez1, Ernesto Calvo2, Marcelo Escolar3, Julia Pomares4 1California Institute of Technology
2University of Houston 3Universidad de Buenos Aires 4London School of Economics
*corresponding author: gabriel@hss.caltech.edu
Abstract: Using data from an e-voting experiment conducted in the 2005
Congressional Election in Argentina, we estimate the effect of different e-voting technologies on the likelihood that citizens cast their vote for different parties for the National Congress and the Legislature of Buenos Aires. Our results indicate that voters are extremely receptive to the information cues provided by the different voting technologies and associated ballot designs, and that particular voting devices have a significant impact on voter choice, systematically favouring some parties to the detriment of others. We conclude that the choice of alternative electronic voting devices might have considerable effect on electoral outcomes in multi-party electoral systems.
1 Introduction
An increasing number of countries around the world have adopted electronic voting systems in national and local elections since the 1990s, and many others are conducting pilot projects [AH08]. While the academic literature has focused mainly on the reliability and accuracy of different electronic voting technologies [AH08], [St04], [AS05], only a few empirical studies have directly examined the effect of different voting technologies on election outcomes [Wa04], [CM07], [HW07]. Empirical studies have even been fewer in multiparty electoral systems, where with a larger number of parties and candidates on a ballot, voters might be more responsive to readily available information and thus may resort to different cues in order to identify and distinguish the various electoral options and to select their preferred choice [RS06].
In this paper, we analyze how different voting technologies influence voters’ choice and election outcomes in multiparty races, examining evidence from a voting pilot conducted in the 2005 congressional election in Buenos Aires, Argentina, in which four e-vote prototypes were tested. We show that voters alter their electoral behaviour and their vote choice in response to different e-vote technologies, and that this might translate into different electoral outcomes across voting devices. Our main findings are in line with the results of [CSP07], in the sense that ‘technology matters,’ and that different voting technologies and associated ballot designs might have substantive effects on election results in multi-party electoral systems.
2 The E-Voting Experiment in Buenos Aires’ 2005 Election
Voters in the congressional election held in Buenos Aires in October 2005, elected National representatives and State legislators using a party-list paper ballot system that included candidates for all offices11. Seats were allocated using a PR-D’Hont formula with closed party lists of magnitude 13 for representatives and 30 for legislators. Thirty parties presented candidate lists for National representatives, while forty one parties presented lists for the state legislature. Three parties captured approximately 66% of the valid votes in the election of national representatives and 64% in the election of state legislators: President Kirchner’s Frente para la Victoria (FPV), the center-left opposition party Alianza para una Republica de Iguales (ARI), and the center-right
Propuesta Republicana (PRO)12. The campaign for national representatives was very intense, with high spending in support of the candidacies of Rafael Bielsa (FPV), Elisa Carrio (ARI), and Mauricio Macri (PRO). By contrast, candidates to the local legislature spent almost no money during the campaign [CSP07].
The e-pilot was conducted in 41 precincts randomly distributed throughout the city and included 14,800 participants. After voting in the official election, participants in each precinct were asked to participate in a non-binding election in which they were randomly assigned to one of four possible voting devices and were asked to vote a list of national deputies and a list of local legislators. Because the experiment was carried out in a single electoral district, with participants in each precinct being randomly assigned to the different voting devices and facing similar menus of party choices, we expect no correlation between the characteristics of the district or the election and voters’ behaviour13.
11The description of the e-vote pilot borrows from [CSP07].
12The vote-shares of ARI, FPV and PRO in the election of national representatives (state legislators) were
22.0% (20.8%), 20.5% (19.5%) and 34.1% (33.2%), respectively. If blank ballots are excluded, the vote share of these three parties comes close to 70%.
13Organizational problems prevented the testing of all the prototypes in all the precincts, as originally planned.
While Prototypes 1 and 2 were tested in all the precincts, Prototype 3 was tested in 40 precincts, and Prototype 4 in only 17. Although we do not expect this to have resulted in serious imbalance between the participants assigned to the different prototypes, we take this problem into account in the analysis below.
After the vote, participants were asked to complete two surveys. The first survey was a short self-administered survey (six questions) conducted with 13,830 respondents. Half of the questions were identical across prototypes, dealing with general perceptions about their e-vote experience. The remaining questions tested usability issues specific to each device. A fourth of the participants also answered a longer exit poll. This survey provided information about the voters’ political sophistication, their familiarity with technology, their patterns of political participation, and their opinions and attitudes towards electronic voting.
The four voting devices tested in the pilot were developed with the institutional process of Argentina in mind. Prototype 1 was a direct recording electronic (DRE) design with two separate modules. A screen in the first module allowed voters to review the lists of candidates, and a numerical keypad was used to register the vote. Voters would insert a “smart card” into the first module and use the keypad to navigate through screens to cast their ballots. When done, they removed their smart card, moved to a second module, and again inserted their smart card, automatically recording their vote. Prototype 2 was a touch-screen DRE machine with a voter verifiable paper trail. After activating the system with their plastic “smart card” voters could scroll and select party lists directly by tapping onto the screen. When done with their ballot, a paper audit trail would be generated underneath a glass screen. If the voter affirmed that that indeed was how she wanted her vote to be cast, the paper audit trail fell into a bin and the voter was done; if not, the paper audit trail was rejected and the voter was allowed to cast the ballot again.
Prototype 3 was an optical scan (OS) prototype located inside a voting booth. The voter
picked paper ballots for the party list she wished to support inside the booth, inserted those ballots into a rolling scanner that displayed the selected party on the prototype’s screen, and would then proceed to confirm her selection. This prototype required separate ballots for each race, allowing direct comparison of the marks that identify a party across races. Finally, Prototype 4 was an optical scan device with a single ballot listing all the parties running candidates for office in the two congressional. The voter marked her preferences for each race with a pencil and introduced the ballot into a scanner; the ballot would then fall into a ballot box. In all prototypes, participants voted for National representatives first and State legislators second.
An important difference between the DRE and OS prototypes was the way in which voters were required to search for their preferred candidates. In the DRE prototypes, party labels were randomly rotated on the screen and, because of space restrictions, a limited number of labels were displayed on each screen. Two and three screens were required to display party labels for national representatives and state legislators in
Prototype 1, while three and four screens were required in Prototype 2. The placement of
the party labels rotated randomly for each voter, preventing order effect biases from favouring the same party. In the case of Prototype 3, poll workers sorted the paper ballots numerically14. According to the information obtained from the polling place workers, however, ballots rapidly mixed in the voting booth, complicating the search for the voters’ preferred ballots. Finally, in Prototype 4, party names were listed by their official list number in increasing order. The non-random ordering of parties may have increased the likelihood of order effects but it also facilitated the recognition of the same party across races.
A second relevant difference among the prototypes was how voters accessed information about candidates and parties. The first prototype displayed 15 party names on each screen, including the list number and party logo information. In order to view the list of candidates, however, the voter needed to enter the three-digit party number. If the voter did not know the name of the party, she would need to access each list until finding a recognizable candidate name. Prototype 2, on the other hand, displayed the name of the first candidate under the party label, together with the number and logo information. The complete list of candidates was then displayed on a second navigation level. Parties with prominent first candidates (such as the pro-Kirchner Rafael Bielsa from the FPV or Mauricio Macri of the center-right PRO) were readily identified by voters15. However, very little information about the party name or number was recalled when casting the legislative vote. Hence, while voters faced fewer problems in recognizing their preferred choice for national representative, they could not use such information when choosing state legislators.
Different information was available to voters using the optical scan systems. Ballot papers for Prototype 3 included all the relevant information, such as party name, party logo, identification number, and the complete list of candidates for each race. The only difficulty in identifying the preferred choice, therefore, was in finding the correct paper ballot. In Prototype 4, a booklet provided voters with all the party information; the ballot introduced in the rolling scanner listed only the party name, number and logo. The main characteristics of the four prototypes tested in the experiment are summarized in this paper’s supplementary materials (Appendix I).
14When registering the candidates running for an election, each party is assigned a list number. Candidates and
Parties advertise this number during the campaign, together with the party and candidate’s name.
15Bielsa was President Kirchner’s Foreign Relations Minister at that time, while Macri is a famous
3 A First Look at the Impact of Different E-Voting Technologies
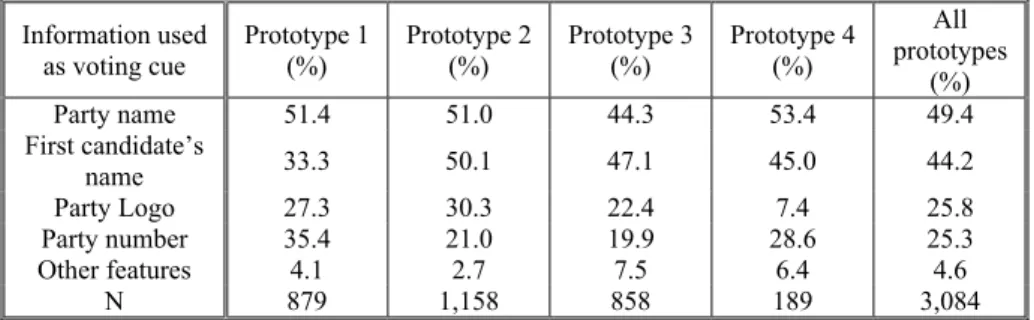
The survey data lets us examine how voters interacted with each prototype and how the different voting technologies and the associated ballot designs affected voters’ electoral choice. Table 1 presents data about which ballot features participants used to identify their preferred candidates. Nearly half of the voters cast their ballot based on the name of the party, followed by the name of the first candidate. The name of the party was particularly important for those participants using Prototype 4, and was less so for those using Prototype 3. Also, the name of the first candidate was more relevant for those assigned to Prototype 2, while participants using Prototype 1 were less likely to use it as a voting cue, using more frequently the party number instead. This is consistent with the characteristics of the ballot designs associated with the different prototypes: the name of the first candidate figured prominently on the computer screen in the case of the second prototype, while voters using Prototype 1 could access the candidates’ names only after entering each party’s number in the keypad. We found a statistically significant relationship between the information used by respondents to identify their preferred candidate and the voting technology used (p-value = 0.08).16
Information used
as voting cue Prototype 1(%) Prototype 2(%) Prototype 3(%) Prototype 4(%)
All prototypes (%) Party name 51.4 51.0 44.3 53.4 49.4 First candidate’s name 33.3 50.1 47.1 45.0 44.2 Party Logo 27.3 30.3 22.4 7.4 25.8 Party number 35.4 21.0 19.9 28.6 25.3 Other features 4.1 2.7 7.5 6.4 4.6 N 879 1,158 858 189 3,084 Table 1: How voters found their preferred candidates17
Table 2, in turn, reports the percentage of participants who stated they were not able to vote for their preferred candidate for each of the prototypes, sorted by education and political information levels18.
16Given that respondents could use several ballot features to identify their preferred choice, the assumption of
independence among units required by standard tests of independence is violated. Thus, we used the bootstrap resampling method proposed in [LS98] to test for the association between voting cue and prototype.
17Table entries are the percentage of respondents in each prototype that used each of the ballot features to
identify their preferred candidates. Since participants could use several of the ballot features as voting cues, percentages do not necessarily sum to 100 rows across.
18Both surveys included the question: “Were you able to vote for your preferred party/candidate?” Political
information was computed as the average of respondents’ number of correct answers to three questions asking them the names of the ministers of economy, education and health.
The survey data indicates that education significantly affected the ability of the participants to vote for their preferred party while only 3.8% of voters with college education were unable to cast a vote for their preferred option; this figure was almost 2.6 times higher for those with high school education or lower. The difference in the proportions between the two groups is statistically significant, with a 95% confidence interval of [0.04, 0.08]. Although less educated voters experienced more difficulties in all of the prototypes tested, the gap between participants with college education and the rest was much smaller for Prototype 2, suggesting that this device imposed lower barriers on less educated voters. The p-value of Woolf’s test for homogeneity across prototypes is 0.001 [Wo55], indicating that there are considerable differences across voting technologies regarding the difficulties experienced by less educated participants. When examining the data by political information levels, again, Prototype 2 seems to have been more effective in enabling voters with null or low information levels to vote for their preferred choice. Prototype 3, in contrast, exhibits the higher rates of reported voting problems for all levels of political information. The Cochran-Armitage Trend Test [AG02] provides evidence of a modestly negative linear relationship between political information and reported voting problems (two-sided p-value = 0.1), but this is only statistically significant (at the 0.01 level) for Prototype 1. Overall, almost 90% of the voters were able to vote for their preferred party; Prototype 2 exhibited the highest rate of success (93.9%), while Prototype 3 had the lowest score (82.6%).
Variable Prototype 1(%) Prototype 2(%) Prototype 3(%) Prototype 4(%) prototypesAll (%) Education College 3.0 2.7 6.5 3.6 3.8 Secondary or lower 12.6 4.5 13.6 12.9 9.8 N 3,175 3,873 2,743 887 10,678 Non-response rates 21.4 18.4 28.2 27.5 22.8 Political information Null 9.9 3.4 11.4 0.0 7.3 Low 7.3 4.1 11.7 2.4 6.9 Medium 1.7 4.3 11.5 7.3 5.7 High 3.0 3.8 10.5 3.8 5.4 N 835 1,108 823 185 2,951 Non-response rates 5.0 4.3 4.1 2.1 4.3
Table 2: Percentage of voters who could not vote for their preferred candidate19
19Table entries are the percentage of respondents in each prototype that were not able to cast a vote for their
preferred candidate, among all respondents belonging to each row-category assigned to that prototype. The data on education levels was taken from the short self-administered survey, while the data on political information was obtained from the longer exit poll.
The fact that the four prototypes imposed different information demands on the participants and seem to have influenced the cues they used to identify the candidates, suggests that the e-voting devices could have had systematic effects on electoral outcomes. For instance, parties with more visible candidates should have fared relatively better among voters using Prototype 2, and those with more recognizable names/logos might have benefited from the ballot design and screen display in the DRE devices. Figure 1 explores this issue further, plotting the means and 95% confidence intervals of the vote-shares of the parties in the election of National representatives and State legislators under each prototype20,21. For all the prototypes tested, each of the three majority parties, Alianza para una Republica de Iguales (ARI), Frente para la Victoria (FPV) and Propuesta Republicana (PRO), exhibited higher vote-shares in the first election, jointly obtaining 65% of the total vote cast for the parties competing in the election of National representatives. In contrast, minority parties gathered almost 50% of the vote in the less visibility race for State legislators. However, there are considerable variations in the support for the different parties across prototypes. The support for minority parties in both races was substantially higher under Prototype 3, reaching 48.7% in the election of National representatives and 55.7% in the election for the local legislature. In contrast, their vote-share was the lowest under Prototype 4, with 36.4% and 41.6% respectively. The support for the largest parties also varied across prototypes. For the four prototypes tested, the vote-share of ARI, FPV and PRO in the in the National (Local) election was 21.0% (18.2%), 15.6% (12.6%) and 22.6% (19.9%), respectively. However, the three large parties fared considerably better under the two DRE devices than under Prototype 3. We used bootstrapped Kolmogorov-Smirnov tests to examine the differences in each party’s average support between pairs of prototypes [Ab02]. We found statistically significant differences at the usual confidence levels between the average vote-shares of FPV and PRO under Prototypes 1 and 2 and their support under Prototype 3 in both congressional races, as well as between the support for ARI under Prototypes 1 and 3 in the national election. There are also significant differences in the support for the smaller parties under Prototype 3 and each of the other prototypes in the two elections analyzed22.
20Vote-shares are expressed as percentages of the total number of votes cast for the competing parties in both
races, excluding blank and null votes. Although Prototype 3 had a higher rate of blank ballots than the other e-voting devices [CEP07], the results regarding the relative support for the different parties remain virtually unchanged when including blank ballots in the analysis.
21Note that, while ARI’s vote-shares in the two experimental elections were similar to those in the official
elections, the support for FPV and PRO was lower and the vote for the smaller parties was higher in the pilot, compared to the actual elections.
Figure 1: Distribution of the support for the parties under each prototype23
23The thick horizontal lines correspond to the median vote-shares of the parties under each prototype. The
4 Estimating the Effect of E-Voting Technologies on Election
Outcomes
While the data presented in the previous section reveals some interesting differences in voters’ electoral behavior across voting devices, it does not allow us to assess the impact of the different technologies and ballot designs on the voter choice after accounting for the effect of socio-demographic and attitudinal variables. Controlling for these predictors might be relevant in order to estimate the causal effect of the e-voting devices on voters’ choice and election outcomes [GH07], given that not all of the four prototypes were used in all the districts analyzed24.
As our data includes the individual level votes for all the participants in the pilot, we can analyze the aggregate electoral and survey data from 128 voting stations defined by crossing each of the precincts with the e-voting devices25. Our dependent variable is the vote-share of ARI, FPV, PRO and Other parties in the election for National representatives and State legislators in each of the voting stations, where the category “Other parties” comprises all the remaining parties in both races26. The independent variables used in the analysis are defined at the voting station level and include: the mean Education level; the mean level of Political Information; Interest in politics; the mean level of participants’ Use of Technology; Perceived Difficulty of E-Voting; and four variables measuring the percentage of participants who found their preferred party searching by Party Name, by Party Logo, by Party Number, or by Candidate Name. Additional details and descriptive statistics for these variables are provided in Appendix III of this paper’s supplementary materials.
In order to estimate the causal effect of different voting technologies on the expected support for the parties competing in 2005, we implemented a multinomial-logistic model for the multinomial probabilities of support for ARI, FPV and PRO, with “Other parties” as the baseline category [Co05]. The probabilities of support for the parties are modelled as functions of the voting station covariates described above. In addition, in order to account for the cluster sampling scheme used in the experiment and to allow for unobserved heterogeneity across voting stations and for potential correlation in the election results across prototypes and precincts, we include zero-mean random effects for the two non-nested factors [Co05], [GH07]. The model was fit by MCMC Gibbs sampling methods [CS92]. The main advantage of using Bayesian estimation is that it allows obtaining arbitrarily precise approximations to the posterior densities, without relying on large-sample theory [Ja04].
24See footnote 3.
25Although the individual vote variable can be retrieved from each prototype’s logs, privacy considerations
prevented us from linking the individual vote with the individual survey data. Combining the information from the logs and the surveys, we have data from 128 out of the 139 possible voting stations, after dropping 924 individual observations with missing values from our analysis.
26“Other parties” includes 26 smaller parties in the election for National representatives and 37 parties in the
In order to evaluate the model fit, we used posterior predictive simulations to assess the model’s ability to reproduce the overdispersion present in the data, comparing the Pearson statistic computed from the observed data with that computed using replicates sampled from the model [Co05]. Additional details about the model specification, the estimation procedure and robustness checks are provided in Appendix IV of the supplementary materials.
5 Empirical Results
Table 3 reports the posterior means and standard deviations for the fixed effects for the two elections under analysis. The model satisfactorily replicates the overdispersion in the data, with values of
(
2 2)
Rep Obs
P χ >χ close to 0.5 for both elections [Co05].27
Parameter National representativesElection of State legislatorsElection of ARI FPV PRO ARI FPV PRO Education (0.14)0.10 -0.23(0.09)*** (0.12)0.29** (0.10)0.14 -0.23(0.11)** (0.15)0.29* Political information (0.32)0.54* (0.33)0.27 (0.34)-0.36 0.70(0.30)** (0.33)-0.01 (0.33)-0.09 Interest in Politics (0.19)-0.15 (0.21)0.41* (0.20)0.24 (0.19)-0.09 (0.22)0.44* 0.51(0.19)*** Use of Technology (0.16)0.05 (0.17)0.10 (0.17)0.25 (0.16)0.01 (0.18)0.33* (0.16)0.22 Assessment of E-Voting (0.43)0.19 (0.35)0.34 (0.36)0.19 (0.40)0.36 (0.50)0.05 (0.37)-0.16 Search by Party Name -0.54 ** (0.26) (0.28)-0.18 -0.44 * (0.26) (0.27)-0.11 -0.59 ** (0.31) (0.27)-0.29 Search by Party Logo (0.31)0.01 (0.34)0.02 (0.33)0.24 (0.32)-0.05 (0.35)0.18 (0.34)0.45 Search by Party Number (0.32)-0.06 0.77 ** (0.35) (0.34)0.43 (0.33)-0.21 (0.39)0.52 (0.33)0.12 Search by Candidate Name (0.25)-0.39 (0.25)-0.06 -0.73 *** (0.27) (0.24)-0.07 (0.28)0.05 -0.47 * (0.27) Intercept (1.44)-1.13 (0.68)-1.03 -2.73(1.09)** -2.48(1.05)** (1.15)-0.77 -3.44(1.31)** N 128 128
(
2 2)
Rep Obs P χ >χ 0.42 0.57Table 3: Estimated posterior means and standard deviations for the fixed effects (Standard deviation in parenthesis; significance levels: *** 0.01, ** 0.05, *0.1)
27 2
Obs
χ is the usual Pearson statistic computed from the observed data, and χRep2 is using the replicates sampled from the model. See Appendix IV in the supplementary materials.
The results in Table 3 reveal some interesting differences regarding the effect of several covariates on the relative support for the three largest parties. For instance, in the two elections analyzed, the votes for Propuesta Republicana (PRO) increased in voting stations with higher average levels of education, while they decreased for Frente para la
Victoria (FPV). In contrast, higher average levels of political interest were associated
with higher support for FPV. This result is consistent with prior research that emphasizes class and education effects among non-Peronist voters [CM04]. Regarding the effect of the different information cues used by participants when casting their vote, the support for FPV in the more visible race increased with the percentage of voters relying on the official party number. On the other hand, the vote for ARI and PRO was negatively related to the percentage of participants using the name of the party in the election for National representatives, while there is a negative relationship between Search by Party
Name and the support for FPV in the less visible election. The vote for PRO was also
negatively associated by the percentage of voters basing their choice on the first candidate’s name in both congressional elections.
The main focus of our analysis, however, lies in the effect of the different voting technologies on the support for the competing parties across elections. Figure 2 presents the posterior means and confidence intervals of the prototype effects for each of the parties in both elections.
Figure 2: Prototype random coefficients for both congressional elections28
28The center dots correspond to the point estimates of the prototype effects, the thicker lines to the 50%
These results indicate that different voting devices have potential influences on electoral outcomes after controlling for socio-demographic and behavioural variables. The effect of the voting technologies and the associated ballot designs varied considerably across parties and races. For instance, while the Optical Scan device with separate ballots (Prototype 3) had a significantly negative effect on the votes for FPV and PRO in both congressional elections, the touch-screen DRE device (Prototype 2) had the opposite effect, raising the support for FPV and PRO in the election for national representatives, although not in the election for state legislators. As mentioned above, the name of the first candidate of each party figured prominently on the screen of Prototype 2, and more than half of the participants using this device cast their vote based on this information. Hence, a possible interpretation of this result is that, while the first candidates of FPV and PRO, Bielsa and Macri, were renowned figures who were easily identifiable by voters, participants generally did not recognize the candidates running for the local legislature of any of the competing parties [CEP07]. Thus, the relative advantage obtained by FPV and PRO in the more salient election disappeared in the less visible race. Interestingly, however, the results reported in Table 3 show that the percentage of respondents using the first candidate’s name had no systematic effect on the support for FPV in either of the races, while it had a negative impact on the vote for PRO. This indicates that the prototype-effects might be capturing additional sources of variability in the dependent variables, beyond that explained by the aggregate survey data.
Table 4 complements the information presented in Figure 2, reporting the mean posterior and 50% and 90% confidence intervals of the pairwise differences in the probabilities of supporting each party across prototypes. After controlling for other factors, the support for the largest parties tends to be higher for the two DRE devices than for Prototype 3, although the differences between Prototype 1 and 3 are not statistically significant at the usual confidence levels. In contrast, in the cases of FPV and PRO, there are significant differences between their support for Prototypes 2 and 3: the touch-screen DRE device leads to an increase of 3.8 and 6.3 percentage points in their vote-shares, respectively, in the election for National representatives, and of 2.7 and 5.3 percentage points in the election for state legislators; these differences are significant at the 0.01 level. As shown in Figure 2, in the more visible race, these differences stem both from an increase in the support for FPV and PRO induced by Prototype 2 and a reduction of their support for
Prototype 3. In contrasts, the results in the election for state legislators are entirely
driven by the higher support for the smaller parties under the OS device with separate ballots. In fact, the relative support for the smaller parties tends to be consistently higher with Prototype 3 in both races: in the national representative election, the vote-share of the minor parties is 11 percentage points higher under Prototype 3 vis a vis Prototype 2, while in the state legislature election their vote with this prototype is systematically higher when compared against all the other voting devices. Also, in the national election, the relative support for the smaller parties is lower with Prototype 2 than Prototype 1. Hence, in the more visible race, the touch-screen DRE device consistently favours the parties with more renowned candidates, to the detriment of the smaller ones.
Pairwise
comparisons πARI πFPV πPRO πOTHER
Election of National representatives Prototypes 1-2 2.1 (-4.2, 8.7) (-8.4, 1.0)-3.6 (-10.9, 0.4)-5.2 (0.8, 12.4)6.6 Prototypes 1-3 3.4 (-3.2, 9.9) (-4.0, 4.4)0.2 (-4.6, 2.1)1.2 (-10.8, 1.7)-4.8 Prototypes 1-4 2.9 (-0.4, 6.0) (-4.3, 1.9)-1.0 (-6.0, 1.0)-2.4 (-3.6, 4.3)0.5 Prototypes 2-3 1.3 (-0.5, 3.3) (2.1, 5.7)3.8 (4.4, 8.3)6.3 (-13.7, -9.2)-11.0 Prototypes 2-4 0.7 (-6.9, 8.0) (-3.3, 8.3)2.6 (-4.2, 9.4)2.7 (-13.0, 1.0)-6.1 Prototypes 3-4 -0.5 (-7.7, 6.5) (-6.3, 4.9)-1.2 (-9.8, 2.4)-3.6 (-2.1, 13.4)5.3 Election of State legislators Prototypes 1-2 -0.6 (-5.4, 5.1) (-5.5, 4.6)-0.55 (-4.2, 6.9)1.5 (-7.7, 6.5)-0.4 Prototypes 1-3 -0.2 (-5.3, 5.2) (-1.5, 7.4)2.7 (-0.1, 10.4)5.3 (-15.1, -0.8)-7.8 Prototypes 1-4 2.5 (-0.5, 5.4) (-5.0, 1.4)-1.7 (-7.8, -0.3)-4.0 (-0.9, 7.2)3.1 Prototypes 2-3 0.4 (-1.4, 2.2) (1.8, 4.9)3.3 (1.9, 5.7)3.8 (-9.8, -5.1)-7.5 Prototypes 2-4 3.1 (-2.8, 8.7) (-7.8, 5.2)-1.1 (-12.2, 1.5)-5.5 (-4.6, 12.3)3.5 Prototypes 3-4 2.7 (-3.0, 8.0) (-10.6, 1.1)-4.4 (-15.6, -3.1)-9.3 (2.8, 19.5)11.0 Table 4: Pairwise differences in the probability of support for each party across prototypes in
percentage points (90% confidence intervals in parenthesis)
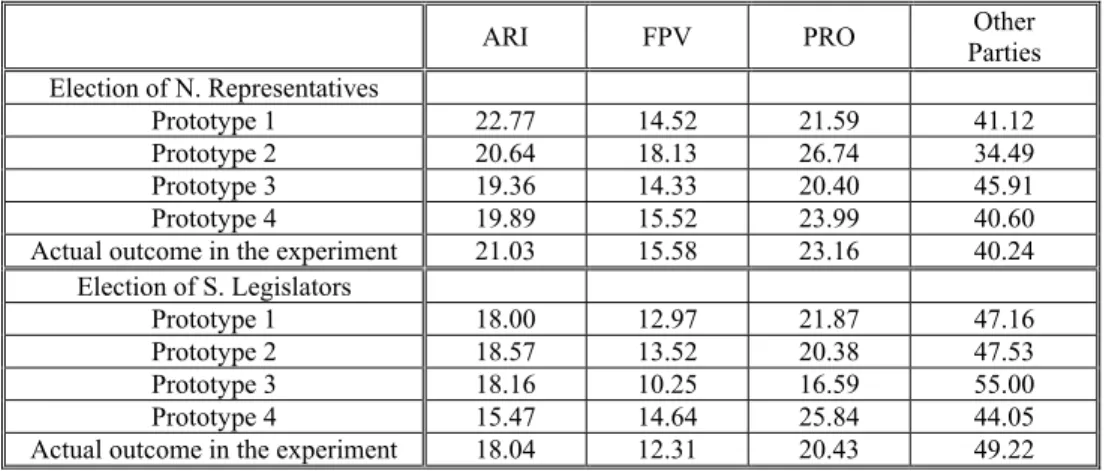
These results provide strong evidence in support of the hypothesis that alternative voting technologies may have substantive influence on the support for different parties. The relevant question thus becomes: how would the election outcomes vary under different voting technologies? In order to answer this question, we estimate the expected electoral outcome assuming only one prototype had been used in each voting-station, while holding all the remaining variables constant. Table 5 reports the expected election outcomes in both races for each of the four prototypes and compares them to the actual results in the experiment.
The evidence indicates that different voting technologies would in fact have led to quite different election results. For instance, if Prototype 1 had been used in all voting stations, ARI would have had the highest expected support in the election for national representatives, rather than the actual winner, PRO. ARI would also have had the highest expected support in the election for state legislators under Prototype 3. In contrast, the vote-shares of PRO and FPV in the national election would have been maximized under
Prototype 2, increasing their support at the expense of ARI and, especially, of the
smallest parties. In the less visible race, however, the advantage enjoyed by PRO and FPV under the touch-screen DRE device would have virtually vanished. Finally, the expected support for minor parties in both races would have increased by almost 6 percentage points under Prototype 3 with respect to the actual results in the experiment. Thus, the choice among different e-voting technologies could have had substantive effects on the election results.
ARI FPV PRO PartiesOther Election of N. Representatives
Prototype 1 22.77 14.52 21.59 41.12 Prototype 2 20.64 18.13 26.74 34.49 Prototype 3 19.36 14.33 20.40 45.91 Prototype 4 19.89 15.52 23.99 40.60 Actual outcome in the experiment 21.03 15.58 23.16 40.24
Election of S. Legislators
Prototype 1 18.00 12.97 21.87 47.16 Prototype 2 18.57 13.52 20.38 47.53 Prototype 3 18.16 10.25 16.59 55.00 Prototype 4 15.47 14.64 25.84 44.05 Actual outcome in the experiment 18.04 12.31 20.43 49.22
Table 5: Expected and actual election outcomes in percentage points
6 Concluding Remarks
Multiparty races impose substantial demands on voters, who have to gather enough information to be able to distinguish between the positions of the different parties before the elections and to identify their preferred choice at the polls. Using data from a large-scale e-vote experiment in Buenos Aires, we present the first study on the impact of different electronic voting systems on election outcomes in multi-party races. Our results indicate that different devices have considerable influence on the relative support for different parties across races, after controlling for relevant socio-demographic and behavioural predictors. In contrast to studies on this topic examining two-party elections in the U.S., most of which have found that the impact of alternative voting technologies on election outcomes is quite small [CS07], [HW07], our findings show that this effect might be large enough to potentially affect the election results. In this sense, our results are in line with the findings of [RS06], indicating that amount and the form in which information is presented to voters by different e-voting technologies might have a considerable influence on voting behavior in multi-party elections.
The evidence presented in this paper is particularly significant in view of the increasing trend towards electronic voting and the growing number of countries moving from traditional paper ballots to electronic voting systems. In many of these countries, political parties have repeatedly expressed concerns about the possibility of being systematically disadvantaged by the new voting technologies29. Our results suggest that this might actually be the case, rather than just a myth fuelled by politicians, and raises the possibility that some voting technologies may in fact shape the electoral outcomes, rather than merely recording voters’ preferred choices.
References
[Ab02] Abadie, A.: “Bootstrap Test for Distributional Treatment Effect in Instrumental Variable Models”. Journal of the American Statistical Association, 97(457), 2002, pp. 284-292. [Ag02] Agresti, A.:Categorical Data Analysis. New Jersey: John Wiley & Sons. 2002.
[AH08] Alvarez, R.; Hall, T.: Electronic Elections: The Perils and Promises of Digital Democracy. Princeton, NJ: Princeton University Press, 2008.
[AS05] Ansolabehre, S.; Stewart, C.: “Residual Votes Attributable to Technology”. Journal of Politics, 67(2), 2005, pp. 365-389.
[CEP07] Calvo, E.; Escolar, M.; Pomares, J.: “Ballot Design and Split Ticket Voting in Multiparty Systems: experimental evidence on information effects and vote choice.” Unpublished manuscript, 2007.
[CM04] Calvo, E.; Murillo, M.: “Who Delivers? Partisan Clients in the Argentine Electoral Market.” American Journal of Political Science, 48(4), 2004, pp. 742-757.
[CM07] Card, D.; Moretti, E.: “Does Voting Technology Affect Election Outcomes? Touch-screen Voting and the 2004 Presidential Election”. Review of Economics and Statistics, 89 (4), 2007, pp. 660-673.
[CG92] Casella, G.; George, E.: “Explaining the Gibbs Sampler”. The American Statistician, 46(3), 1992, pp. 167-174.
[Co05] Congdon, P.: Bayesian Models for Categorical Data. New York: John Wiley & Sons, 2005.
[GH07] Gelman, A.; Hill, J.: Data Analysis Using Regression and Multilevel / Hierarchical Models. New York: Cambridge University Press, 2007.
[HW07] Herron, M.; Wand, J.: “Assessing partisan bias in voting technology: The case of the 2004 New Hampshire recount”. Electoral Studies, 26(2), 2007, pp. 247-261.
[Ja04] Jackman, S.: “Bayesian Analysis for Political Research”. Annual Review of Political Science, 7, 2004, pp. 483-505.
[LS98] Loughin, T.; Scherer, P.: “Testing for Association in Contingency Tables with Multiple Column Responses”. Biometrics, 54(2), 1998, pp. 630-637.
[RS06] Reynolds, A.; Steenbergen, M.: “How the world votes: the political consequences of ballot design, innovation and manipulation.” Electoral Studies, 25(3), 2006, pp. 570-598. [S04] Stewart, C.: “The Reliability of Electronic Voting Machines in Georgia”. Working Paper
20, Caltech/MIT Voting Technology Project, 2004.
[Wa04] Wand, J.: “Evaluating Voting Technologies: 2004 New Hampshire Democratic Primary. Technical Report, Stanford University, 2004.
[Wo55] Wolf, B.: “On estimating the relation between blood group and disease.” Annals of Human Genetics, 19, 1955, pp. 251-253.
29For instance, several French parties expressed such concerns during the 2007 Presidential election, the first