HAL Id: hal-02950944
https://hal.archives-ouvertes.fr/hal-02950944
Submitted on 3 Nov 2020
HAL is a multi-disciplinary open access
archive for the deposit and dissemination of sci-entific research documents, whether they are pub-lished or not. The documents may come from teaching and research institutions in France or abroad, or from public or private research centers.
L’archive ouverte pluridisciplinaire HAL, est destinée au dépôt et à la diffusion de documents scientifiques de niveau recherche, publiés ou non, émanant des établissements d’enseignement et de recherche français ou étrangers, des laboratoires publics ou privés.
Top-of-the-Atmosphere Observations
F. Chevallier, J-J. Morcrette
To cite this version:
F. Chevallier, J-J. Morcrette. Comparison of Model Fluxes with Surface and Top-of-the-Atmosphere Observations. Monthly Weather Review, American Meteorological Society, 2000, 128 (11), pp.3839-3852. �10.1175/1520-0493(2001)1292.0.CO;2�. �hal-02950944�
q 2000 American Meteorological Society
Comparison of Model Fluxes with Surface and Top-of-the-Atmosphere Observations
F. CHEVALLIER ANDJ.-J. MORCRETTE
European Centre for Medium-Range Weather Forecasts, Shinfield Park, Reading, Berkshire, United Kingdom
(Manuscript received 2 February 2000, in final form 12 April 2000) ABSTRACT
The global observation network of the atmospheric broadband radiation reached an unprecedent extent in 1998 with the simultaneous availability of longwave and shortwave measurements of the Clouds and the Earth’s Radiant Energy System instrument on board the Tropical Rainfall Measuring Mission spacecraft, and of a number of surface stations as part of the Atmospheric Radiation Measurement, Baseline Surface Radiation Network, and Surface Radiation network programs.
In this paper, these observations are used to assess the quality of the longwave and shortwave components of both the top-of-the-atmosphere and the surface radiation budget computed by the ECMWF operational forecast system.
The main features of the boundary radiation are well captured by the system. Clouds appear to be the main modulator of the uncertainty of the top-of-the-atmosphere radiation and of the shortwave surface radiation. This is explained by both model cloud deficiencies and inadequate cloud representation in the radiative transfer schemes. The longwave surface radiation uncertainty is marked by a clear sky bias, common to most of the parameterized longwave radiative transfer models.
1. Introduction
During recent decades, the skill of weather prediction has undergone dramatic improvements. As an example, at the European Centre for Medium-Range Weather Forecasts (ECMWF) the 60% level of forecast confi-dence has been raised from 3.5 days in 1979 to 7.0 days in 1997. Modelers have concentrated mainly on the val-idation of temperature and geopotential height; however, the improvements in these quantities have increased the interest toward other variable validation—water vapor, winds, cloudiness, radiation, rain, etc. This gives insight into the model deficiencies and guides corresponding improvements.
This paper uses a series of observations to focus on the radiation, both longwave and shortwave, in the ECMWF forecast system as of 1998. The characteristics of the ECMWF model are summarized in section 2. During the first seven months of 1998, longwave and shortwave flux measurements at the top of the atmo-sphere are available through the Clouds and the Earth’s Radiant Energy System (CERES) experiment, on board the Tropical Rainfall Measuring Mission (TRMM) sat-ellite. Section 3 presents the comparisons between the CERES data and the ECMWF model outputs. At the
Corresponding author address: F. Chevallier, ECMWF, Shinfield
Park, Reading, Berkshire RG29AX, United Kingdom. E-mail: [email protected]
surface, observations made as part of the Atmospheric Radiation Measurement (ARM), Baseline Surface Ra-diation Network (BSRN), and Surface RaRa-diation net-work (SURFRAD) programs are available at a number of ground stations encompassing a wide range of cli-matic regimes from polar to tropical latitudes. Among the various observations available at each site, the pre-sent study uses the downward longwave surface radi-ation (DLSR) and the downward shortwave surface ra-diation (DSSR). The comparisons between the surface data and the ECMWF model outputs are presented in section 4. Section 5 provides an overall summary.
2. Description of the model data
The model versions used in this study are the so-called cycles 18r3 and 18r6 of the ECMWF forecast system that were operational during 1998. The model includes a semi-Lagrangian scheme together with a lin-ear Gaussian grid (Hortal 1999). The reduced horizontal grid corresponds to a regular grid size of about 60 km from the equator to the poles. In the vertical, a variable coordinate of 31 layers between the surface and the top of the atmosphere is used. The physics package is de-scribed by Gregory et al. (1998). Of particular interest for the present study, it includes an improved version of the longwave radiative tranfer model of Morcrette (1991), with significant changes in the description of the water vapor continuum and of the ice cloud long-wave optical properties. Also, a dependence of the
face longwave emissivity on the surface characteristics has been specified. The shortwave radiation transfer is based on Fouquart and Bonnel (1980) and Morcrette (1991). The prognostic cloud scheme follows Tiedtke (1993) with some changes listed in Jakob (1994) and a revised representation of ice sedimentation.
The forecast model is initialized with the four-di-mensional variational scheme described by Courtier et al. (1994). The assimilated observations provide infor-mation about atmospheric temperature, moisture, and winds, as well as about surface characteristics.
The major change of the ECMWF forecast model during 1998 is the change of the spectral truncation from T213 to TL319 on 1 April 1998, directly affecting the dynamical fields of winds, temperature, and surface pressure. This was accompanied by a change in the mod-el orography.
The boundary radiative fluxes are provided by the forecast system, as values integrated over 6 h, starting at 0000, 0600, 1200, and 1800 UTC during the first 5 days of forecast. The present study focuses on the ar-chived outgoing longwave radiation (OLR), outgoing shortwave radiation (OSR), DLSR, and DSSR. The sign convention used here makes these four radiative quan-tities positive. It should be noted that more than 200 model variables (temperature, water vapor, ozone, aero-sols, cloud cover and cloud condensate profiles, etc.) are processed by the radiative transfer schemes to pro-duce them. Therefore, establishing the origin of their uncertainty is a mathematically ill-defined problem if the information about the input variable errors is not available. It is out of the scope of the present study to make any quantitative estimation of these. Qualitative estimations are used. Also, reference is made to previous studies.
3. Comparisons with the CERES data
a. Description of the CERES data
The CERES mission is part of the National Aero-nautics and Space Administration’s (NASA) Earth Ob-serving System program. The instrument itself is an improved model of the Earth Radiation Budget Exper-iment (ERBE) scanner instruments, which operated from 1984 through 1990 (Barkstro¨m 1984). It consists of a three-channel broadband radiometer. The channels respectively measure the shortwave (0.2–5.0 mm), the total (0.2–100.0 mm), and the 8–12-mm ‘‘window’’ broadband radiation (Wielicki et al. 1996). A set of al-gorithms similar to those for ERBE has been designed to convert the measurements of these channels into broadband longwave and shortwave fluxes using spec-tral and angular corrections. The uncertainty of the in-stantaneous fluxes has been estimated to 12.7 W m22
for the longwave, and to 38 W m22 for the shortwave
(Wielicki et al. 1995). In the near future, these
uncer-tainties are expected to be reduced with the combined use of the data from an imager flown with CERES.
Like the ERBE mission, the CERES mission has been planned to rely on a set of three satellites. The first one has been launched in November 1997 on board the TRMM spacecraft. TRMM has an orbital inclination of 358 and therefore monitors the 458N–458S region. Eight months’ worth of ERBE-like data are available, from January to August 1998. The present study makes use of the instantaneous longwave and shortwave fluxes pro-vided on the CERES–TRMM ERBE-like (ES8) product. Due to the high volume of data, two periods of 3 weeks are chosen: from 1 to 21 January, and from 1 to 21 July. The TRMM time sampling is uneven. For the July pe-riod, most of the Southern Hemisphere as seen by the platform is in evening or in the night.
The CERES field of view at nadir is 10-km equivalent diameter. For comparison with the radiation parameters operationally provided by the ECMWF forecast system, the CERES data are averaged over the system 6-h pe-riods on a regular 0.56258 3 0.56258 grid, correspond-ing to the model TL319 resolution. For instance, durcorrespond-ing the 21-day period of July, about 3 500 000 averaged situations are available. Of these, 2 600 000 correspond to ocean surface conditions. According to the ECMWF 6-h forecast, only a comparatively small number are cloud free: about 50 000 situations, which are mostly located over land.
b. Results
Care must be taken in the interpretation of differences between CERES fields and model fields because of the number of error sources. Indeed three main sources may be distinguished. The first one lies in the atmospheric model variables, which are used as input to the radiative transfer schemes. In particular, the cloud variables that are used by the radiation schemes include the temper-ature, the horizontal cloud cover, the cloud condensate amount, and particle size. The second source of error is the radiative transfer schemes, longwave and short-wave, of the atmospheric model. For instance, known deficiencies affect the way clouds are treated in the long-wave (e.g., Ra¨isa¨nen 1998). The distinction between the first and the second sources of error is somewhat ar-bitrary, because the radiative variables are part of the atmospheric model and their errors directly or indirectly affect the other variables. Nevertheless, some atmo-spheric variables are better represented than the other ones in the atmospheric model, and therefore some of its errors can be directly connected with some of its parameterizations. The third source of error is the mis-interpretation of the CERES observation system in the ES8 postprocessing (see section 3a). All three sources of error cumulate or compensate. In the latter case, some model weaknesses may not appear on the results, even if these ones influence the top-of-the-atmosphere radi-ation.
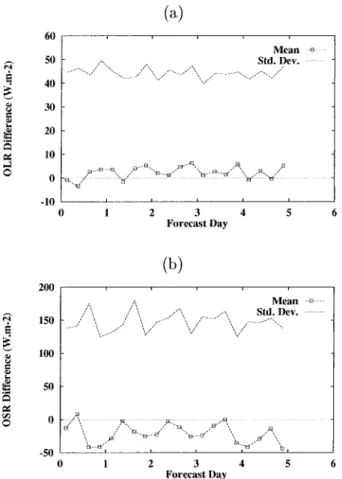
FIG. 1. Comparison between the top-of-the-atmosphere radiation in the ECMWF 5-day forecast model and the corresponding CERES measurements; mean and standard deviation of the differences, in W m22, for the period from 1 to 21 Jul (21 cases). By convention, both
the OLR and the OSR are set to be positive: (a) upward longwave and (b) upward shortwave.
Figure 1 presents the statistics of the differences be-tween CERES and the ECMWF forecast model for the OLR and the OSR as a function of forecast day. The initial date runs between 1 and 21 July. It is remarkable that the error does not grow when the atmospheric model moves away from the analysis. This may indicate that clouds play a major role in driving the error. Indeed, the ECMWF analysis system for July 1998 involves a variety of instrument observations, but none of them provides direct information about cloud cover or cloud condensate. It should be noted that some indirect in-formation is assimilated, for instance from the radio-sondes or from the Special Sensor Microwave/Imager. One can also notice in Fig. 1 that the standard deviation for the OSR significantly fluctuates with a 1-day period. This can be related to the TRMM time sampling.
Figures 2–5 focus on the first 6 h of the forecast. They present the mean differences during the two 21-day periods, together with the corresponding confidence limits, given by the Student’s t-test of statistical signif-icance, and the mean CERES fields. The difference fig-ures are obviously correlated to cloud patterns, like
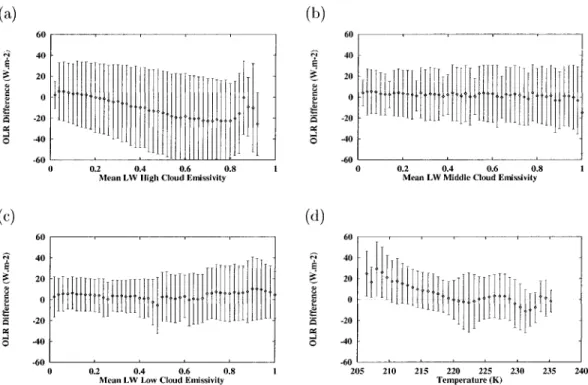
those of the intertropical convergence zone (ITCZ) and of the South Pacific convergence zone (SPCZ). Thus, the OLR is very sensitive to high cloud cover. This is illustrated on Figs. 6a–c, where a weak dependence of the OLR differences is found as a function of middle and low cloud longwave emissivity, whereas a marked trend appears as a function of high cloud longwave emissivity. The emissivity is taken here in its physical meaning (e.g., Ebert and Curry 1992). The trend as a function of high cloud longwave emissivity is likely to be due to errors in the estimation of cloud optical prop-erties in the model. The OSR differences (Figs. 4 and 5) have larger patterns than the OLR ones, because they are more sensitive to patterns of low and middle clouds. In particular, the stratocumulus regions off the west coast of the continents is highlighted in the shortwave difference map.
When the OLR differences are negative, like in the ITCZ over the oceans and in the SPCZ, the OSR ones are positive. This indicates that in these regions both the longwave and the shortwave see too much cloudi-ness in the atmospheric model. In July, the portion of the ITCZ over Africa appears to have a different be-havior in the model, with an insufficient northern extent as seen by the radiative transfer schemes. High positive differences exist over India and Southeast Asia for the OLR in July, whereas the differences for the OSR are comparatively small. The OLR differences follow the coastlines and suggest either an overestimation of the 6-h forecast surface temperature or a bad representation of the convection over land. In both cases, the TRMM spacecraft time sampling is likely to emphasize the dis-crepancies. On the contrary, high negative differences appear for the OSR north of the ITCZ over Africa in July, where there is small cloudiness. No significant differences appear for the OLR in the same region. This may indicate too low values of the atmospheric model surface albedo in July. The January maps exhibit dis-crepancies, for instance over the Southern Hemisphere continents, the origin of which is less obvious, when comparing the OSR differences to the OLR ones. This may be due to the mixing between the different sources of errors. In particular, the model clouds may be in-correctly located both on the horizontal and on the ver-tical. Only the extension of the studied period, or cross comparisons with other observations, like those of cloudiness and of surface temperature, are likely to help distinguishing between the problems.
The region covered by the TRMM spacecraft is most-ly tropical. However the mean differences are likemost-ly to be higher for midlatitude regions. Indeed Fig. 4b shows high differences around 408S for the OSR in January. Symmetrical patterns (around 408N due to the TRMM time sampling) are found in July (Fig. 5b). For the OLR, Fig. 6d shows a clear trend of the July differences as a function of the 200-hPa temperature, when the coldest 200-hPa temperatures correspond to midlatitude airmass types.
FIG. 2. Comparison between the top-of-the-atmosphere longwave radiation in the ECMWF 6-h forecast and the corresponding CERES measurements, in W m22, for the period from 1 to 21 Jan. (a) Mean CERES field. Contours every 20 W m22; the main local extrema are
indicated. (b) Mean differences (ECMWF2 CERES). Contours every 20 W m22; negative values less than210 W m22are dark shaded,
positive values greater than 10 W m22are light shaded. (c) Statistical significance, using the Student’s t-test, of the differences shown in
(b). Values greater than 0.95 are shaded.
c. Discussion
The differences that are correlated with the cloud pat-terns are consistent with known deficiencies of the clouds in the ECMWF model. For instance, Jakob (1999) compares the 15-yr ECMWF Reanalysis (ERA-15: Gibson et al. 1997) with the International Satellite Cloud Climatology Project data (Rossow and Schiffer 1983). In particular, he shows an underestimation of the extratropical cloud cover over the oceans by about 10%– 15%, an underestimation of the stratocumulus off the west coast of the subtropical continents by 15%, and an overestimation of the cloud amount in the ITCZ, by
10%–15% in the western Pacific region. All of these conclusions are coherent with the difference figures. In other respects, although the overestimation of the trade wind cumulus cover noted by Jakob (1999) on ERA-15 has been significantly reduced in the model (C. Jakob 1999, personal communication), the shortwave errors in the corresponding regions are still large (Figs. 4b and 5b).
As said before, both the cloud representation in the ECMWF model and the cloud part of the radiative trans-fer models contribute to the discrepancies. Moreover, some of the parameterization deficiencies may partially
FIG. 3. Same as Fig. 2 but for the period from 1 to 21 Jul.
cancel each other. As an example, the introduction of a distinction between cloud cover and cloud emissivity in the longwave radiative transfer model (Ra¨isa¨nen 1998) increases the differences with CERES in the ITCZ (not shown) even though it improves the stand-alone com-putations. As a consequence, the various model param-eterizations are developed in parallel so that their in-teractions are taken into account (Gregory et al. 1998).
4. Comparisons with surface observations
a. Description of the observations
Surface radiation comparisons are made using data from 15 ground stations, whose characteristics are given in Table 1. Each station is part of either the ARM, the
BSRN, or the SURFRAD network, and was operational during 1998. The three networks aim at providing high quality long-term measurements of the components of the surface radiation budget. ARM and BSRN are, re-spectively, presented by Stokes and Schwartz (1994) and Ohmura et al. (1998). SURFRAD is dedicated to the study of the radiation over the United States and is a collaborative effort among the National Oceanic and Atmospheric Administration, NASA, and U.S. univer-sity scientists.
A number of atmospheric measurements is available on each site. The present study makes use of the DLSR and DSSR observations performed by upward-looking pyrgeometers and pyranometers, respectively. For these quantities, all stations have adopted the standards for
FIG. 4. Comparison between the top-of-the-atmosphere upward shortwave radiation in the ECMWF 6-h forecast and the corresponding CERES measurements, in W m22, for the period from 1 to 21 Jan. (a) Mean CERES field. Contours every 60 W m22; the main local extrema
are indicated. (b) Mean differences (ECMWF2 CERES). Contours every 40 W m22with first contours at 30 and230 W m22. Negative
values less than230 W m22are dark shaded, positive values greater than 30 W m22are light shaded. Differences of about 80 W m22are
reached in the ITCZ. Differences of about280 W m22are reached around latitude 458S, as well as in the stratocumulus region off the west
coast of America. Due both to the shortness of the period and to the shortwave diurnal cycle, no statistical significance test is performed.
measurements set by BSRN (WCRP 1991; Heimo et al. 1993). These are 15 W m22 for broadband solar
mea-surements and 10 W m22 for thermal infrared
instru-ments. To achieve these goals, both the broadband solar and infrared instruments are calibrated against standards traceable to the World Radiation Centre in Davos, Swit-zerland. The absolute calibration is such that 90% of the measurements are within 11 W m22, and 99% are
within 15 W m22 of the standards.
The observations are usually available with a fre-quency of at least 3 min. As for the CERES data, the broadband fluxes are averaged here over 6-h periods for comparisons with the radiation parameters operationally provided by the ECMWF forecast system.
b. Results
The correlations between the 6-h forecast surface ra-diation and the observations are shown in Table 2 for each station. They are usually higher than 0.80 for the DLSR, even reaching 0.95 (Billings). This indicates a good representation of the variability of the low cloud cover in the model. On the other hand, poor correlations are found over Payerne (0.76), Tateno (0.73), Kwajalein (0.70), Florianopolis (0.68), and the South Pole (0.76).
The correlations for the DSSR (Table 2, middle column) are around 0.90, but the diurnal cycle greatly contributes to this result. Therefore, the statistics with only the sit-uations whose local time lies between 8 and 18 h are presented in the right column of Table 2. In this case, the correlations are rather similar to those of the DLSR, which is expected since, after the diurnal cycle, the clouds are the main modulators of both the DLSR and the DSSR.
Figures 7 and 8 present the statistics of the differences between the surface observations and the ECMWF fore-cast model as a function of forefore-cast day. Distinction is made between the winter months (Jan and Feb 1998) and the summer months (Jul and Aug 1998). The seven U.S. stations other than Barrow are gathered together, as well as the two European stations. Bermuda and Kwa-jalein are grouped for the DLSR because they exhibit similar behavior for this variable, despite their latitude difference. Because of their different longitudes, only Bermuda is shown for the DSSR.
For the DLSR (Fig. 7), the standard deviations grow for most of the stations from about 20 W m22 at the
initial time to about 30 W m22at the fifth day. Even if
its amplitude varies with the location and the season, a negative bias of about 20 W m22appears for the
FIG. 5. Same as Fig. 4 but for the period from 1 to 21 Jul. Differences of about 80 W m22are reached in the ITCZ, the SPCZ, and in
the west Pacific warm pool. Differences of about280 W m22are reached in North Africa and in the northern part of the Pacific, in particular
in the stratocumulus region off the west coast of America, where the mean difference reaches2180 W m22.
latitude stations: those of the United States other than Barrow and those over Europe. This bias appears for each one of these stations separately considered (not shown). It exhibits a clear daily cycle without any sig-nificant trend. In particular, the morning bias is signif-icantly reduced compared to the three other day times. Similar behavior is seen for Florianopolis and Tateno, but in these cases the morning bias is positive. The polar statistics show a strong negative bias, with no diurnal cycle as expected from these regions. The ones for Ber-muda and Kwajalein have nearly no bias. Figures 9a–c show the dependence of the difference between the 6-h forecast DLSR and the observations as a function of low, middle, and high cloud longwave emissivity for the nonpolar stations. It is seen that the more cloudiness there is in the model, the more reduced the bias is.
The DSSR statistics (Fig. 8) show strong diurnal, sea-sonal, and latitudinal variations, as expected from the corresponding variations of the insolation. The standard deviations do not have any significant trend and are usually more than 150 W m22in the middle of the day.
The biases are mostly positive, except for the European stations and Bermuda. The dependence of the difference between the 6-h forecast DLSR and the observations as a function of cloudiness is presented in Fig. 10. The chosen cloudiness variable is the mean transmittivity in the 0.25–0.69-mm spectral region, for low, middle, and
high clouds. Unlike the results for the DLSR, no sig-nificant trend can be observed, but the standard devi-ation is smaller for the clear sky cases than for cloudy ones, as diagnosed by the model.
c. Discussion
The analysis of the differences between the model values and the surface observations are still more dif-ficult than for the comparisons with satellite measure-ments. Indeed, the low number of operating stations makes it difficult to link the discrepancies to the patterns of the general circulation, as is done with CERES. More-over, because of the model finite horizontal resolution, connected with corresponding averaged orography and land–sea repartition, some inconsistencies necessarily exist between the surface observations and the model fields. However, the results show two features common to previous validations of general circulation models: an overall overestimation of the DSSR and an overall underestimation of the DLSR (e.g., Wild et al. 1995; Garratt and Pratta 1996). Several explanations have been put forward to explain these tendencies: a possible inadequate representation of the temperature and hu-midity profiles in the boundary layer, as well as a de-ficient description of the ‘‘continuum absorption’’ (i.e., water vapor continuum and aerosols).
FIG. 6. Difference between the top-of-the-atmosphere longwave radiation in the ECMWF 6-h forecast and the corresponding CERES measurements (ECMWF2 CERES, in W m22), as a function of mean longwave cloud emissivity,
for (a) high, (b) middle, and (c) low clouds, and (d) as a function of the 200-hPa temperature. Cloud properties and temperature are from the forecasts. Period from 1 to 21 Jul. The squares and the vertical bars, respectively, represent the mean and the standard deviation after a two-sigma elimination in each histogram class.
TABLE1. Latitude, longitude (8), and observation network of the radiation stations used in this study.
Station Lat Long Network
Barrow, AK Fort Peck, MT Payerne, Switzerland Carpentras, France Table Mountain, CO Bondville, IL Boulder, CO 71.28N 48.38N 46.88N 44.08N 40.18N 40.08N 40.08N 156.88W 105.18W 6.98E 5.08E 105.28W 88.38W 105.28W BSRN/ARM SURFRAD BSRN BSRN SURFRAD SURFRAD SURFRAD Desert Rock, NV Billings, OK Tateno, Japan Goodwin Creek, MS Bermuda Kwajalein Florianopolis, Brazil South Pole 36.68N 36.38N 36.08N 34.38N 32.38N 8.78N 27.58S 89.98S 116.08W 97.38W 140.08E 89.58W 64.78W 167.78E 48.58W 24.48W SURFRAD ARM BSRN SURFRAD BSRN BSRN BSRN BSRN
Wild et al. (1998) document the characteristics of the ECMWF shortwave radiative transfer model. The au-thors show that the clear sky shortwave radiation at the surface is realistically captured by the radiative transfer model, even though the water vapor molecular absorp-tion may be underestimated (Wild and Liepert 1998). Also, Wild (1999) points at some weaknesses of the aerosol description in the Tropics. This confirms the results of Fig. 10, where the better results are found in clear situations as diagnosed by the forecast model. The
cloud absorption might be underestimated in general circulation models parameterizations (Cess et al. 1995). However, Wild et al. (1998) show that this is partially compensated for in the ECMWF shortwave scheme by the effect of the coarse spectral resolution of the code. In addition to the deficiencies of the model cloud var-iables (Jakob 1999), this makes the cloudy sky results difficult to analyze.
For the DLSR, Fig. 9 suggests that either the observed bias mainly corresponds to clear sky radiation, or that the radiation scheme significantly underestimates the cloudiness effects when the forecast model predicts only limited cloudiness, or that these two problems are com-bined. Once more (see section 3b), the radiative cloud effects stem from various origins: the cloud cover, the liquid and ice water contents, the layer overlap, and the particle size of the cloud condensate. In order to assess the accuracy of the clear sky computations, a comple-mentary experiment is performed with the data from Billings. Five days’ worth of data are used from 13 to 17 December 1997, during which both the forecast mod-el and the station ceilometer agree about the absence of cloudiness. The ECMWF system during December 1997 is similar to that one in January 1998. A special pro-cessing is applied during the forecast, so that the model variables are archived at each one of its time steps at the Billings grid point (the so-called DDH archives). Figure 11 shows that the forecast model tends to
TABLE2. Correlation between the surface longwave and shortwave radiations in the ECMWF 6-h forecast and the surface observations. For the shortwave radiation, distinction is made between the results taking only the situations into account where the observed DSSR is greater than 0 W m22, and those taking only the points between 0800 and 1600 local time (LT) into account. The number of available 6-h
observations (N ), as well as the number of them whose total cloudiness is less than 0.02 (Nc) is indicated.
Station DLSR N (Nc) Correl. DSSR Obs. 0 N (Nc) Correl. 0800–1600 LT N (Nc) Correl. Barrow Fort Peck Payerne Carpentras Table Mountain Bondville Boulder 1455 1454 1453 1439 1457 1458 1433 (137) (360) (231) (398) (355) (322) (342) 0.90 0.92 0.76 0.91 0.85 0.95 0.88 1022 921 256 1077 920 932 1103 (64) (214) (54) (322) (189) (193) (241) 0.94 0.92 0.70 0.96 0.90 0.91 0.94 298 724 256 718 727 728 717 (26) (159) (54) (198) (134) (135) (128) 0.92 0.90 0.70 0.93 0.84 0.86 0.87 Desert Rock Billings Tateno Goodwin Creek Bermuda Kwajalein Florianopolis South Pole 1162 1339 1120 1456 1452 1457 1373 1417 (586) (491) (158) (404) (64) (7) (49) (235) 0.90 0.95 0.73 0.94 0.83 0.70 0.68 0.76 811 835 338 845 1132 1089 751 738 (384) (293) (45) (221) (53) (6) (16) (150) 0.97 0.89 0.84 0.89 0.92 0.88 0.87 0.95 289 663 292 726 364 728 341 185 (121) (216) (32) (175) (16) (5) (7) (39) 0.90 0.85 0.76 0.83 0.72 0.67 0.66 0.94
derestimate the DLSR by about 15 W m22at most times.
During the last three days of the pentad, radiosonde reports are available. Their very good agreement with a microwave estimation of the total water vapor content (less than 1.0 kg m22 difference) makes them reliable.
Together with the ECMWF longwave radiative scheme, they are used here to make a third estimate of the DLSR, also plotted in Fig. 11. It is shown that the radiosonde-derived DLSR still underestimate the observed DLSR by more than 8 W m22. A comparable bias (12 W m22)
is found with the Payerne data in the same experimental conditions (M. Wild 1999, personal communication). The use of a more accurate (i.e., less parameterized) radiative transfer model (Mlawer et al. 1997) reduces the bias of the radiosonde-derived DLSR at Billings by less than 2 W m22 (not shown). Results are also quite
insensitive to higher vertical resolutions for the radiative computations, or to improved angular integration. The radiosonde-derived DLSR bias is not surprising. Indeed, as shown in Fig. 7, the DLSR forecast error does not significantly grow with the forecast day, whereas the ECMWF system assimilates radiosonde observations at a short distance of each radiation station used here.
To explain the DLSR bias, two possible sources of error would have to be analyzed. The first one is the aerosol climatology, used as input to the radiative trans-fer model. Its effect should be however limited in the longwave spectrum. The second one is the water vapor continuum in the 0–500 cm21spectral band, whose
val-idation has not been as extensive as for the other wave-numbers, due to the lack of measurements at atmo-spheric temperatures (e.g., Clough et al. 1989; Ma and Tipping 1991).
An important feature of the DLSR bias is its diurnal cycle at most locations (Fig. 7). Figure 12 focuses on the Carpentras site. The diurnal cycles of the observed
DLSR, of the model DLSR, and of the mean longwave middle cloud emissivity are shown. The maximum of cloudiness is seen in the afternoon. A possible inter-pretation of the figure distinguishes between two sources of bias: the clear sky bias, which mostly affects the nighttime, and a possible lack of afternoon cloudiness in the forecast. In this case, the optimal time for the DLSR estimation would be in the morning, as in Fig. 7, when both problems are reduced. This hypothesis needs to be confirmed with correspondent validation of the cloudiness diurnal cycle in the forecast model.
5. Summary and prospects
The present study compares the boundary fluxes com-puted by the ECMWF forecast system in 1998 and cor-responding observations from the TRMM spacecraft (CERES program) and from surface stations (ARM, BSRN, and SURFRAD programs). The measured data, although available only after long delays, are particu-larly interesting for checking the model radiation, as they are obtained with the highest available accuracy for the corresponding quantities. In particular, compared to other sources of observation whose cover may be more global, they are less, or not, dependent on existing radiative transfer models.
The top-of-the-atmosphere comparisons cover the 458N–458S region. The discrepancies between the mod-el and the observations are mostly corrmod-elated with cloud (ITCZ, SPCZ, stratocumulus) and surface (temperature and albedo) patterns. If the differences related to clouds are attributed to the simulated cloud variables, the re-sults corroborate known deficiencies of the ECMWF simulated cloudiness. However, both the longwave and the shortwave ECMWF schemes, like most of the ex-isting parameterized schemes, do not properly handle
FIG. 7. Comparison between the downward surface longwave radiation (DLSR) in the ECMWF 5-day forecast model and surface measurements: mean (ECMWF2 observation) and standard deviation of the differences, in W m22. The
winter period corresponds to Jan and Feb 1998. The summer period corresponds to Jul and Aug 1998. The forecasts start at 1200 UTC.
FIG. 8. Same as in Fig. 7 but for the shortwave.
FIG. 9. Difference between the DLSR in the ECMWF 6-h forecast and surface measurements, as a function of mean longwave cloud emissivity, for (a) low, (b) middle, and (c) high clouds: mean (ECMWF2 observation) and standard deviation of the differences, in W m22. Cloud properties from the forecasts. Year 1998, all nonpolar stations. The
squares and the vertical bars, respectively, represent the mean and the standard deviation after a two-sigma elimination in each histogram class.
FIG. 10. Difference between the DSSR in the ECMWF 6-h forecast and surface measurements, as a function of mean shortwave cloud transmittivity in the 0.25–0.69-mm interval, for (a) low, (b) middle, and (c) high clouds: mean (ECMWF
2 observation) and standard deviation of the differences, in W m22. Cloud properties from the forecasts. Year 1998,
for local times between 0900 and 1500 local time. The squares and the vertical bars, respectively, represent the mean and the standard deviation after a two-sigma elimination in each histogram class.
FIG. 11. Comparison between the ECMWF-forecast DLSR, the pyrgeometer observation, and the radiosonde-derived DLSR using the ECMWF longwave radiative transfer model (ECRTM). Billings site. Period from 13 to 17 Dec 1997. The ECMWF variables are archived at every time step at Billings, but only 1-h means are pre-sented here.
FIG. 12. (a) Difference between the DLSR in the ECMWF 6-h forecast and surface measurements at Carpentras, as a function of local time, in h. (b) Mean longwave middle cloud emissivity (from the ECMWF 6-h forecast) at Carpentras as a function of local time. (c) Observed downward longwave surface flux as a function of local time. (d) ECMWF 6-h forecast downward longwave surface flux as a function of local time. Year 1998. Cloud properties from the forecasts. The squares and the vertical bars, respectively, represent the mean and the standard deviation after a two-sigma elimination in each histogram class.
clouds. Both problems add or compensate. Because most of the top-of-the-atmosphere error of the ECMWF model is linked with cloudiness and no cloud parameter is assimilated, the error remains stable from the first step of the forecast until at least the fifth day.
Only a few meteorological stations observe the broad-band components of the surface radiation. The
com-parisons with the model data at 15 available stations show that a high part of the flux variance (usually more than 80%) is well captured by the system. This corrob-orates recent encouraging results regarding the valida-tion of the cloud distribuvalida-tion in the ECMWF model (e.g., Miller et al. 1999). However, the quantitative anal-ysis of the radiation comparisons indicates an overall overestimation of the DSSR by the system and an over-all underestimation of the DLSR. The DLSR bias is attributed mainly to the clear sky component, whereas the DSSR bias mostly concerns the cloud contribution to the flux. In both cases, the radiative transfer scheme strongly contributes to the error. These deficiencies are common to most of the existing general circulation mod-els and their respective origins are not understood yet. In other respects, the model flux biases have a strong diurnal cycle, which appears to stem from both radiative transfer and atmospheric model weaknesses. This could not be shown on the previous comparisons between model surface fluxes and observations, because those focused on monthly means only.
The last year of the 31-level ECMWF system was 1998. It was successively replaced in 1999 by 50- and 60-level versions, with an increased vertical resolution in both the stratosphere and the boundary layer, and important changes of the model physics. Ongoing in-vestigations are assessing the impact of these changes
on the results presented here. In particular, a similar validation will be performed on the forthcoming ECMWF 40-year reanalysis (ERA-40).
Acknowledgments. Authors wish to thank C. Jakob for fruitful comments on the results presented here, and M. Miller for his careful review of the manuscript. The continuous help of D. Lucas in dealing with the various observation file formats was greatly appreciated.
REFERENCES
Barkstro¨m, B. R., 1984: The Earth Radiation Budget Experiment (ERBE). Bull. Amer. Meteor. Soc., 65, 1170–1185.
Cess, R. D., and Coauthors, 1995: Absorption of solar radiation by clouds: Observations versus models. Science, 267, 496–499. Clough, S. A., F. X. Kneizys, and R. Davies, 1989: Line shape and
the water vapor continuum. Atmos. Res., 23, 229–241. Courtier, P., J.-N. The´paut, and A. Hollingsworth, 1994: A strategy
for operational implementation of 4D-Var, using an incremental approach. Quart. J. Roy. Meteor. Soc., 120, 1367–1388. Ebert, E. E., and J. A. Curry, 1992: A parameterization of ice cloud
optical properties for climate models. J. Geophys. Res., 97D, 3831–3836.
Fouquart, Y., and B. Bonnel, 1980: Computation of solar heating of the earth’s atmosphere: A new parameterization. Beitr. Phys.
Atmos., 53, 35–62.
Garratt, J. R., and A. J. Pratta, 1996: Downwelling longwave fluxes at continental surfaces—A comparison of observations with GCM simulations and implications for the global land-surface radiation budget. J. Climate, 9, 646–655.
Gibson, J. K., P. Ka¸llberg, S. Uppala, A. Hernandez, A. Nomura, and E. Serrano, 1997: ECMWF Re-analysis: ERA description. ECMWF Project Report Series, Vol. 1, 72 pp.
Gregory, D., J.-J. Morcrette, C. Jakob, and A. Beljaars, 1998: Intro-duction of revised radiation, convection, cloud and vertical dif-fusion schemes into Cy18r3 of the ECMWF integrated fore-casting system. ECMWF Tech. Memo. 254, 39 pp. [Available from ECMWF, Shinfield Park, Reading, Berkshire RG2 9AX, United Kingdom.]
Heimo, A., A. Vernez, and P. Wasserfallen, 1993: Baseline Surface Radiation Network (BSRN). Concept and implementation of a BSRN station. WMO/TD No. 579, WCRP/WMO, 17 pp. Hortal, M., 1999: The development and testing of a new
two-time-level semi-Lagrangian scheme (SETTLS) in the ECMWF fore-cast model. ECMWF Tech. Memo. 292, 17 pp. [Available from ECMWF, Shinfield Park, Reading, Berkshire RG2 9AX, United Kingdom.]
Jakob, C., 1994: The impact of the new cloud scheme on ECMWF’s Integrated Forecasting System (IFS). Proc. ECMWF/GEWEX
Workshop on Modelling, Validation and Assimilation of Clouds,
Reading, United Kingdom, ECMWF, 277–294.
, 1999: Cloud cover in the ECMWF reanalysis. J. Climate, 12, 947–959.
Ma, Q., and R. H. Tipping, 1991: A far wing line shape theory and its application to the water vapour continuum absorption in the infrared region. I. J. Chem. Phys., 95, 6290–6301.
Miller, S. D., G. L. Stephens, and A. C. M. Beljaars, 1999: A vali-dation of the ECMWF prognostic cloud scheme using LITE.
Geophys. Res. Lett., 26, 1417–1420.
Mlawer, E. J., S. J. Taubman, P. D. Brown, M. J. Iacono, and S. A. Clough, 1997: Radiative transfer for inhomogeneous atmo-spheres: RRTM, a validated correlated-k model for the long-wave. J. Geophys. Res., 102, 16 663–16 682.
Morcrette, J. J., 1991: Radiation and cloud radiative properties in the European Centre for Medium Range Weather Forecasts fore-casting system. J. Geophys. Res., 96D, 9121–9132.
Ohmura, A., and Coauthors, 1998: Baseline Surface Radiation Net-work (BSRN/WCRP): New precision radiometry for climate re-search. Bull. Amer. Meteor. Soc., 79, 2115–2136.
Ra¨isa¨nen, P., 1998: Effective longwave cloud fraction and maximum-random overlap clouds—A problem and a solution. Mon. Wea.
Rev., 126, 3336–3340.
Rossow, W. B., and R. A. Schiffer, 1983: The International Satellite Cloud Climatology Project (ISCCP): The first project of the World Climate Research Program. Bull. Amer. Meteor. Soc., 64, 779–784.
Stokes, G. M., and S. E. Schwartz, 1994: The Atmospheric Radiation Measurement (ARM) program: Programmatic background and design of the cloud and radiation testbed. Bull. Amer. Meteor.
Soc., 75, 1201–1221.
Tiedtke, M., 1993: Representation of clouds in large-scale models.
Mon. Wea. Rev., 121, 3040–3061.
WCRP, 1991: Radiation and climate: Workshop on the implemen-tation of the Baseline Surface Radiation Network. WCRP Rep. 406, World Meteorological Organization, Geneva, Switzerland, 26 pp.
Wielicki, B. A., R. D. Cess, M. D. King, D. A. Randall, and E. F. Harrison, 1995: Mission to Planet Earth: Role of clouds and radiation in climate. Bull. Amer. Meteor. Soc., 76, 2125–2153. , B. R. Barkstrom, E. F. Harrison, R. R. Lee, G. L. Smith, and J. E. Cooper, 1996: Clouds and the Earth’s Radiant Energy Sys-tem (CERES): An earth observing sysSys-tem experiment. Bull.
Amer. Meteor. Soc., 77, 853–868.
Wild, M., 1999: Discrepancies between model-calculated and ob-served shortwave atmospheric absorption in areas with high aerosol loadings. J. Geophys. Res., 104 (D), 27 361–27 371. , and B. Liepert, 1998: Excessive transmission of solar radiation through the cloud-free atmosphere. Geophys. Res. Lett., 25, 2165–2168.
, A. Ohmura, and H. Gilgen, 1995: Validation of general cir-culation model radiative fluxes using surface observations. J.
Climate, 8, 1309–1324.
, , , E. Roeckner, M. Giorgetta, and J.-J. Morcrette, 1998: The disposition of radiative energy in the global climate system: GCM-calculated versus observational estimates. Climate
Dyn., 14, 853–869.