HAL Id: hal-00859862
https://hal.archives-ouvertes.fr/hal-00859862
Submitted on 9 Sep 2013HAL is a multi-disciplinary open access archive for the deposit and dissemination of sci-entific research documents, whether they are pub-lished or not. The documents may come from teaching and research institutions in France or abroad, or from public or private research centers.
L’archive ouverte pluridisciplinaire HAL, est destinée au dépôt et à la diffusion de documents scientifiques de niveau recherche, publiés ou non, émanant des établissements d’enseignement et de recherche français ou étrangers, des laboratoires publics ou privés.
Relationship between casting modulus and grain size in
cast A356 aluminium alloys
Andrea Niklas, Unai Abaunza, Ana Isabel Fernandez-Calvo, Jacques Lacaze
To cite this version:
Andrea Niklas, Unai Abaunza, Ana Isabel Fernandez-Calvo, Jacques Lacaze. Relationship between casting modulus and grain size in cast A356 aluminium alloys. IOP Conference Series: Materials Science and Engineering, IOP Publishing, 2012, vol. 27, pp. 1-6. �10.1088/1757-899X/27/1/012003�. �hal-00859862�
To cite this version : Niklas, Andrea and Abaunza, Unai and
Fernandez-Calvo, Ana Isabel and Lacaze, Jacques. Relationship between casting modulus and grain size in cast A356 aluminium alloys. (2012). IOP Conference Series: Materials Science and Engineering, vol. 27 (n° 1). pp. 1-6. ISSN 1757-8981
O
pen
A
rchive
T
OULOUSE
A
rchive
O
uverte (
OATAO
)
OATAO is an open access repository that collects the work of Toulouse researchers and makes it freely available over the web where possible.This is an author-deposited version published in : http://oatao.univ-toulouse.fr/ Eprints ID : 8764
To link to this article : DOI:10.1088/1757-899X/27/1/012003
URL: http://dx.doi.org/10.1088/1757-899X/27/1/012003
Any correspondance concerning this service should be sent to the repository administrator: [email protected]
Relationship between casting modulus and grain size in cast
A356 aluminium alloys
A Niklas1*, U Abaunza1, A I Fernández-Calvo1 and J Lacaze2
1 Engineering and Foundry Processes Department, AZTERLAN,
Aliendalde Auzunea 6, E-48200 Durango (Bizkaia), Spain
2 CIRIMAT, Université de Toulouse, ENSIACET, B.P. 44362,
31030 Toulouse, France E-mail: [email protected]
Abstract. Microstructure of Al-Si alloy castings depends most generally on melt preparation
and on the cooling rate imposed by the thermal modulus of the component. In the case of Al-Si alloys, emphasis is put during melt preparation on refinement of pro-eutectic (Al) grains and on modification of the Al-Si eutectic. Thermal analysis has been used since long to check melt preparation before casting, i.e. by analysis of the cooling curve during solidification of a sample cast in an instrumented cup. The conclusions drawn from such analysis are however valid for the particular cooling conditions of the cups. It thus appeared of interest to investigate how these conclusions could extrapolate to predict microstructure in complicated cast parts showing local changes in the solidification conditions. For that purpose, thermal analysis cups and instrumented sand and die castings with different thermal moduli and thus cooling rates have been made, and the whole set of cooling curves thus recorded has been analysed. A statistical analysis of the characteristic features of the cooling curves related to grain refinement in sand and die castings allowed determining the most significant parameters and expressing the cube of grain size as a polynomial of these parameters. After introduction of a further parameter quantifying melt refining an excellent correlation, with a R2 factor of 0.99
was obtained.
1. Introduction
Aluminum-silicon alloys are one of the most used groups of aluminum foundry alloys due to their excellent cast ability and good mechanical properties. It is known that their mechanical properties, and in particular elongation at rupture, are significantly improved by reducing the secondary dendrite arm spacing through increased cooling rate, by appropriate eutectic modification and by grain refinement which affect positively porosity and hot tearing [1-3]. Thermal analysis has been used for a while for assessing grain refinement and modification before casting. This assessment is based on the use of pre-established relationship between characteristic parameters of the cooling curve obtained on an instrumented thermal analysis (TA) cup and microstructure features measured either on the cup or on a standard sample cast at the same time [3-14].
Because a slow cooling rate is required to obtain a well defined cooling record by TA, Spittle [15] pointed out that the method may not be appropriate to predict grain size in actual castings where the cooling rate is generally higher. Moreover, little effort has been made for predicting the microstructure in real parts which is influenced by mould material as well as by the shape of the castings and thus by changes in cooling rate associated to mould materials and to casting modulus (ratio of casting volume to the surface area for heat exchange between casting and mould). The few available works [16, 17]
showed very little predictive capabilities. In order to fill this gap, a previous study [18] was performed on A356 alloy with various amounts of refiner and modifier cast in instrumented sand and metallic (die) moulds and in TA cups. The present work provides a statistical analysis of these results for grain refinement assessment and its relation with TA parameters measured on the recorded cooling curves. 2. Experimental Procedure
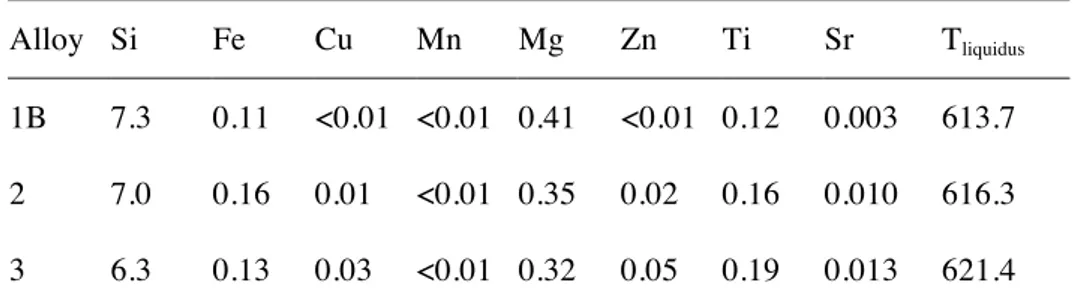
As previously detailed [18], all the tests were carried out in an aluminium foundry with metal from the production line that includes a certain amount of internal returns. The chemical compositions of the alloys are listed in table 1 where also their liquidus temperature Tliquidus calculated with the
THERMOCALC software [19] and the COST-2 database [20] is given. Data from the unrefined alloy labelled 1A in the previous study [18] were not considered for the present work. Alloy 1B was cast with half the normal amount of refiner (AlTi5B1 master alloy) and no addition of modifier, which
means that small Sr amount in this alloy 1B is due to the returns. Alloys 2 and 3 were elaborated with the usual Ti refiner and Sr modifier additions of the foundry.
Table 1. Chemical analysis (wt.%) and liquidus temperature, Tliquidus, (°C) of the investigated alloys.
Alloy Si Fe Cu Mn Mg Zn Ti Sr Tliquidus
1B 7.3 0.11 <0.01 <0.01 0.41 <0.01 0.12 0.003 613.7 2 7.0 0.16 0.01 <0.01 0.35 0.02 0.16 0.010 616.3 3 6.3 0.13 0.03 <0.01 0.32 0.05 0.19 0.013 621.4
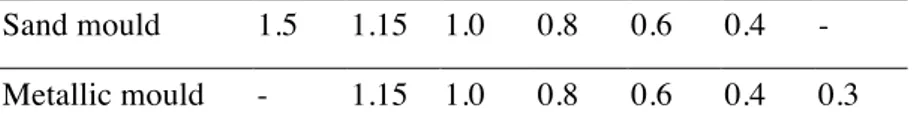
For each experiment, the alloy was cast simultaneously in sand and metallic moulds that are schematically shown in figure 1, and also in a standard sand cup for thermal analysis. In case of metallic moulds, the die was pre-heated to about 250 °C. These moulds were designed in such a way that the height of each cylinder is equal to its diameter, giving a series of thermal moduli as listed in table 2. The TA cup has a modulus equal to 0.605 cm. At the centre of each cylinder was located a thermocouple for cooling curve recording. In a few cases, the thermocouple ruptured during the test and the corresponding cylinders were disregarded for further analysis.
Figure 1. Schematic of the metallic moulds used for the cylindrical test samples. The modulus of each cylinder is indicated. The design was similar for the sand moulds.
Sand mould 1.5 1.15 1.0 0.8 0.6 0.4 - Metallic mould - 1.15 1.0 0.8 0.6 0.4 0.3
Several parameters defined in the literature were considered in the present work for cooling curves analysis in the region of primary solidification, see figure 2. The temperature related parameters are:
- Thigher is the temperature when the rate of change of temperature, Vhigher, is at maximum.
- ΔTU=Tliquidus-Tmin , is the liquidus undercooling, where Tliquidus is the liquidus temperature and Tmin
the minimum temperature of the recalescence arrest [8, 12].
- ΔTrec=Tmax-Tmin is the amplitude of recalescence where Tmax is the maximum and Tmin the
minimum temperatures of the recalescence arrest [8, 12]. Time-related parameters are:
- tf is the difference of the times corresponding to Tmin and its projection onto the cooling curve
after recalescence arrest.
- KF16 is the temperature difference between the temperature at which the cooling rate is for the first time -2 °C/s and the temperature recorded 16 s later [9].
Figure 2. Example of cooling curve at the onset of solidification and its time derivative. The estimation of the characteristic parameters as defined in the text is shown.
In their early works, Apelian et al. [8] and Charbonnier [12] avoided the use of the liquidus undercooling because it needs a very accurate temperature record that cannot be ascertained with usual on-floor facilities. These authors preferred to use the amplitude of recalescence ΔTrec=Tmax-Tmin.
Some of the parameters mentioned above have been compared by Bekaert and Wettinck [14] using statistical analysis. These authors concluded that a third-order polynomial expression of one single parameter does have the same capabilities than more complex equations using several parameters. Following the same line, the parameters selected for statistical analysis in this study were:
- The amplitude of recalescence ΔTrec when present.
- The maximum rate of change of temperature, Vhigher, during the onset of primary solidification,
which may be negative in case of no recalescence.
- The time parameter tf which will be zero in case of no recalescence.
- The KF16 parameter. 605 610 615 620 -6 -5 -4 -3 -2 -1 0 1 0 5 10 15 20 25 30 35 40 T empe ra tu re (° C) Coolin g ra te (° C.s -1 ) Time (s) T liquidus T liquidus+3°C V liquidus V higher T higher KF16 16 s ΔTrec t f T max T min
- The cooling rate just before solidification onset, Vliquidus.
The parameter Vliquidus was considered in order to account for the effect of modulus. For avoiding
possible bias linked to thermocouple inaccuracy, this parameter was evaluated at a temperature 3°C above the liquidus value listed in table 1. Finally, screening of the cooling curves recorded during the present work confirmed that the use of liquidus undercooling or of absolute values of temperature should be avoided.
The metallographic analyses already reported [18] were performed again with attention paid to standard deviation, so that the grain sizes reported here may be slightly different to those previously indicated. Grains were revealed by optical microscopy under polarized light after electrolytic Barker etching of the samples. The grain size GS was then determined by the linear intercept method. Fifty grains were measured for each cylinder from which the average GS value and the standard deviation on the average σGS were evaluated.
3. Results
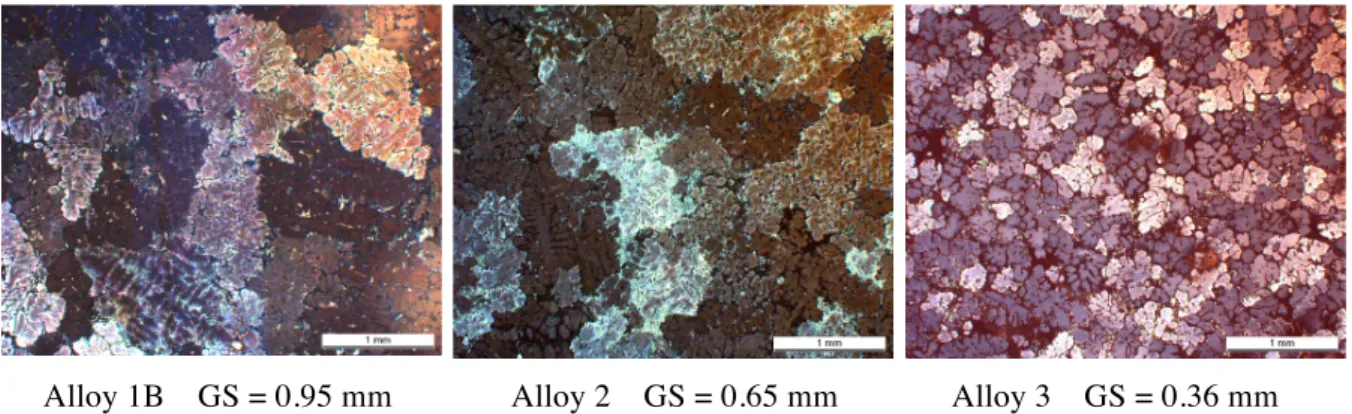
Figure 3 presents micrographs of the three alloys from the cylinder with a modulus of 1 cm of the sand mould. The differences in GS are evident, with alloy 3 presenting a high level of refinement with respect to alloy 2 that has itself grains slightly smaller than the half-refined alloy 1B. It was observed that the grain size of alloy 2 cast in die did not increase with modulus, and this could be related to the fact that the melt did not reach a temperature high enough when poured into the metallic mould. Accordingly, these results were not considered further.
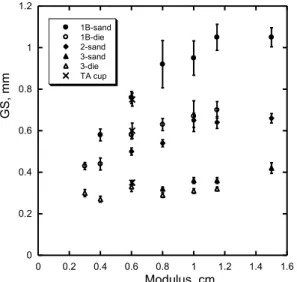
Alloy 1B GS = 0.95 mm Alloy 2 GS = 0.65 mm Alloy 3 GS = 0.36 mm Figure 3. Grain microstructure of the three alloys cast in sand mould, cylinder 1 cm in modulus. Figure 4 shows the GS values as function of the modulus for the three alloys with the error bar corresponding to ±2 σGS superimposed. Sand casting results appear with solid symbols, die casting
data with open symbols, and results from TA cups are plotted with crosses. It is seen that these latter values fit well with those of sand casting. Looking at the data for sand casting, it is observed that the three alloys may be ranked as poorly refined (1B), moderately refined (2) and strongly refined (3). The figures appear more complicated in the case of the die cast materials. While the change in mould materials gives significantly lower GS values in the case of alloy 1B, the effect is not significant for alloy 3. This is certainly related to the fact that refinement was very effective in the case of alloy 3 even for low cooling rates.
4. Discussion
A statistical analysis of the results was performed with the aim at determining the most relevant parameters derived from the cooling curves. The so-called independent variables considered for the statistical analysis were thus Vliquidus, ΔTrec, Vhigher, tf, KF16 and the modulus. As latent heat release
during primary growth depends on the solidified volume, the cube of GS instead of GS was defined as dependent variable. Finally, a parameter was introduced to characterize refining, so that the whole data
could be described with one single expression. The value of this latter parameter, called IREF, was
guessed on the basis of the sand casting results in figure 4, and it was found appropriate to set it at 5, 2 and 0.1 for alloys 1B, 2 and 3 respectively.
Figure 4. Evolution of the grain size GS with modulus for all three alloys cast in sand (solid symbols) and in die (open symbols). Crosses
are data from TA cup.
Figure 5. Plot of predicted versus measured GS3 values. The interrupted line is the bisector.
The software JMP® was used to perform a multivariate analysis that finally showed that only t
f, ΔTrec,
Vliquidus and IREF are statistically significant, while Vhigher, KF16 and the modulus are not. The following
expression, with a R2 correlation coefficient equal to 0.99, was obtained:
GS3=0.0645-0.0045⋅t
f+0.0048⋅Vliquidus+0.1794⋅ΔTrec+0.0324⋅IREF+0.0071⋅tf⋅IREF (1)
The obtained R2 value is characteristic of an excellent least square analysis which is illustrated in
figure 5 where predicted values are plotted versus measured ones. Although Bekaert and Wettinck [14] found good correlation by using a third-order polynomial expression of one single parameter (R2
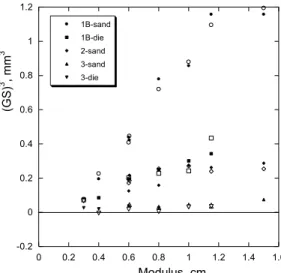
equal to 0.8), in the present study a better predicting performance was found by using several parameters. A more precise comparison of predicted and experimental values is provided in figure 6, where the experimental (solid symbols) and calculated (open symbols) values of (GS)3 are plotted
versus the modulus. The values for the TA cups have been merged with data for sand moulds. In a couple of cooling curves, Vliquidus or tf could not be estimated. In those cases, the GS value could not be
calculated and does not appear in figures 5 and 6. 5. Conclusions
Cooling curves obtained from thermal analysis cups and instrumented sand and die castings with various thermal moduli have been recorded. The relationship between characteristics of the cooling curves and their changes with mould material and thermal modulus on one hand and grain size on the other hand has been investigated in A356 castings with different metal quality in terms of grain refining.
The most significant parameters of the cooling curves related to grain refinement have been determined by statistical analysis. A unique equation was thus obtained for the cube of grain size expressed as polynomial of three cooling curve parameters: time arrest parameter, tf, cooling rate
before solidification, Vliquidus, and recalescence, ΔTrec. A new parameter IREF, which reflects the refining 0 0.2 0.4 0.6 0.8 1 1.2 0 0.2 0.4 0.6 0.8 1 1.2 1.4 1.6 1B-sand 1B-die 2-sand 3-sand 3-die TA cup G S, m m Modulus, cm 0 0.2 0.4 0.6 0.8 1 1.2 0 0.2 0.4 0.6 0.8 1 1.2 Exp erim en ta l (GS) 3 , m m 3 Calculated (GS)3, mm3
potential of the melt and guessed from the experimental data, was also introduced. An excellent correlation between calculated and measured grain size with a R2 value of 0.99 was found.
Figure 6. Plot of the cube of experimental (solid symbols) and calculated (open symbols) GS values as a function of the modulus.
Acknowledgments
Financial support from the Basque Government (Project: PRO
FUTURE, Etortek 2010) is
gratefully acknowledged.
References
[1] ASM Metals HandBook 1988 vol 15 2nd Edition, USA (ASM Int.)
[2] Gilbert Kaufmann J and Rooy E L 2005 Aluminum alloy castings: Properties, Processes and Applications (Ed. ASM International, 2nd Ed., Ohio, U.S.A. pp. .1-340)
[3] Gruzleski J E and Closset B M 1990 The treatment of liquid aluminum-silicon alloys (The American Foundrymen`s Association Inc, 1st Edition, Des Plaines, Illinois, U.S.A., pp. 25–141.)
[4] Günther B and Jürgens H 1984 Giessererei 71 928-31
[5] MacKay R I, Djurdjevic J H, Sokolowski J H and Evans W J 2000 AFS Trans. 108 511-20 [6] Jiang H, Sokolowski J H , Djurdjevic M B and Evans W J 2000 AFS Trans. 108 505-10 [7] Heusler L 1997 Giesserei 82 66-73
[8] Apelian A, Sigworth G K and Whaler K R 1984 AFS Trans. 92 297-307 [9] Menk W, Speidel M O and Döpp R 1992 Giesserei 79 125-34
[10] Ibarra D C 1999 Control of grain refinement of Al-Si-alloys by thermal analysis PhD thesis (Dept. of Mining and Metallurgical Engineering, McGill University of Montreal, Canada,) [11] Argyropoulos, S, Closset B, Gruzleski J E and Oger H 1983 AFS Trans. 91 350-58
[12] Charbonnier J 1984 AFS Trans. 92 907-22
[13] Gädke A F W, Eigenfeld K, Klos R, Koch H, Knoche D and Lang H, 2006 Giesserei 93 18-25 [14] Bekaert F and Wettinck E 1996 Aluminium 72 442-47
[15] Spittle J A 2006 IJCMR 19 210-22 [16] Gowri S 1994 AFS Trans. 102 503-08
[17] Emadi D and Whiting L V 2002 AFS Trans. 110 285-296
[18] Niklas A, Abaunza U, Fernández A I, Lacaze J and Suarez R 2011 China Foundry 8 No.1 89-95 [19] Andersson J O, Helander T, Höglund L, Shi P and Sundman B 2002 Calphad 26 273–312. [20] Ansara I, Dinsdale A T and Rand M H 1998 COST-507 - Thermochemical database for light
metal alloys (Brussels, Belgium: European Commission).
-0.2 0 0.2 0.4 0.6 0.8 1 1.2 0 0.2 0.4 0.6 0.8 1 1.2 1.4 1.6 1B-sand 1B-die 2-sand 3-sand 3-die (GS) 3 , mm 3 Modulus, cm