HAL Id: hal-01123243
https://hal.archives-ouvertes.fr/hal-01123243v2
Submitted on 30 Jul 2015
HAL is a multi-disciplinary open access
archive for the deposit and dissemination of
sci-entific research documents, whether they are
pub-lished or not. The documents may come from
teaching and research institutions in France or
abroad, or from public or private research centers.
L’archive ouverte pluridisciplinaire HAL, est
destinée au dépôt et à la diffusion de documents
scientifiques de niveau recherche, publiés ou non,
émanant des établissements d’enseignement et de
recherche français ou étrangers, des laboratoires
publics ou privés.
Lucie Fernandez, Loic Le Cunff, Javier Tello, Thierry Lacombe, Jean-Michel
Boursiquot, Alexandre Fournier-Level, Gema Bravo, Sandrine Lalet, Laurent
Torregrosa, Patrice This, et al.
To cite this version:
Lucie Fernandez, Loic Le Cunff, Javier Tello, Thierry Lacombe, Jean-Michel Boursiquot, et al..
Hap-lotype diversity of VvTFL1A gene and association with cluster traits in grapevine (V. vinifera). BMC
Plant Biology, BioMed Central, 2014, 14, pp.209. �10.1186/s12870-014-0209-3�. �hal-01123243v2�
R E S E A R C H A R T I C L E
Open Access
Haplotype diversity of VvTFL1A gene and
association with cluster traits in grapevine
(V. vinifera)
Lucie Fernandez
1,7*, Loïc Le Cunff
2, Javier Tello
1, Thierry Lacombe
4,6, Jean Michel Boursiquot
4,
Alexandre Fournier-Level
3, Gema Bravo
5, Sandrine Lalet
6, Laurent Torregrosa
4, Patrice This
4and José Miguel Martinez-Zapater
1,5Abstract
Background: Interaction between TERMINAL FLOWER 1 (TFL1) and LEAFY (LFY) seem to determine the inflorescence architecture in Arabidopsis. In a parallel way, overexpression of VvTFL1A, a grapevine TFL1 homolog, causes delayed flowering and production of a ramose cluster in the reiterated reproductive meristem (RRM) somatic variant of cultivar Carignan. To analyze the possible contribution of this gene to cluster phenotypic variation in a diversity panel of cultivated grapevine (Vitis vinifera L. subsp. vinifera) its nucleotide diversity was characterized and association analyses among detected sequence polymorphisms and phenology and cluster traits was carried out. Results: A total of 3.6 kb of the VvTFL1A gene, including its promoter, was sequenced in a core collection of 140 individuals designed to maximize phenotypic variation at agronomical relevant traits. Nucleotide variation for VvTFL1A within this collection was higher in the promoter and intron sequences than in the exon regions; where few polymorphisms were located in agreement with a high conservation of coding sequence. Characterization of the VvTFL1A haplotype network identified three major haplogroups, consistent with the geographic origins and the use of the cultivars that could correspond to three major ancestral alleles or evolutionary branches, based on the existence of mutations in linkage disequilibrium. Genetic association studies with cluster traits revealed the presence of major INDEL polymorphisms, explaining 16%, 13% and 25% of flowering time, cluster width and berry weight, respectively, and also structuring the three haplogroups.
Conclusions: At least three major VvTFL1A haplogroups are present in cultivated grapevines, which are defined by the presence of three main polymorphism LD blocks and associated to characteristic phenotypic values for flowering time, cluster width and berry size. Phenotypic differences between haplogroups are consistent with differences observed between Eastern and Western grapevine cultivars and could result from the use of different genetic pools in the domestication process as well as different selection pressures on the development of table and wine cultivars, respectively. Altogether, these results are coherent with previous classifications of grapevine phenotypic diversity mainly based on cluster and berry morphotypes as well as with recent results on the structure of genetic diversity in cultivated grapevine.
Keywords: Plant reproductive development, Inflorescence structure, Flowering time, Berry size, Grape domestication, Grapevine
* Correspondence:lfernandez@bordeaux.inra.fr
1
Instituto de Ciencias de la Vid y del Vino (ICVV), (CSIC, Universidad de La Rioja, Gobierno de La Rioja), CCT, C/Madre de Dios 51, Logroño 26006, Spain
7
current address: INRA, UMR Biologie du Fruit et Pathologie, B.P. 81, Villenave-d’Ornon, Cedex 33883, France
Full list of author information is available at the end of the article
© 2014 Fernandez et al.; licensee BioMed Central Ltd. This is an Open Access article distributed under the terms of the Creative Commons Attribution License (http://creativecommons.org/licenses/by/4.0), which permits unrestricted use, distribution, and reproduction in any medium, provided the original work is properly credited. The Creative Commons Public Domain Dedication waiver (http://creativecommons.org/licenses/by/4.0) applies to the data made available in this article, unless otherwise stated.
Background
Grapevine (Vitis vinifera subsp. vinifera) was domesti-cated in the Neolithic period (ca. 8500–4000 BC) [1] from wild populations of Vitis vinifera subsp. sylvestris [2]. Archaeological data traced back the location of the earliest evidence for large-scale winemaking, likely linked to the use of domesticated plants, to the north of Zagros Mountains and in the Caucasian region [3] around 6000–5000 BC which supports that geographic area as the location for primo domestication events. From there, grapevine cuttings were widely spread: first from North to South; and later from East to West around the Mediterranean basin pathway [3]. Vegetative propagation and dissemination, spontaneous events of hybridization among cultivars, breeding with local wild plants and likely secondary domestication events gener-ated the pattern of admixture that is observed in current cultivars [4-9]. The use of different genetic pools along the process of grapevine domestication and human se-lection for different uses such as fresh consumption, rai-sin or wine production have resulted in large variation for cluster size, compactness and architecture among cultivars from different geographic locations [10].
The size and shape of grapevine clusters is determined by the development and growth of inflorescences as well as the efficiency of pollination, fruit set and berry growth. Generally, wine grape cultivars present small (150-250 g) and compact clusters with small berries, while table grapes generally have large (300-400 g) and less compact clusters with large berries. Some of them can even be extremely big weighting up to 1000-1500 g [11]. Negrul [12] distinguished different grape morpho-types based in part on cluster and berry traits. Cluster architecture has implications on disease susceptibility, since cultivars with compact clusters are more sus-ceptible to rot by Botrytis cinerea than those of loose clusters [10,13,14]. In spite of the relevance of cluster structure and compactness, very little is known about its genetic control probably due in part to the complexity of the trait, which depends on many different variables along the growth of the plant as well as the environmen-tal interactions during its reproductive development. There is a need to define cluster shape and size in terms of quantitative variables to understand its genetic deter-mination. So far, only a few studies have tried to identify the main variables responsible for variation in bunch compactness in grapevine. In this sense, Vail and Marois [14] identified cluster weight as the main factor to explain its variation while Shavrukov et al. [15] proposed total cluster length and node number per rachis as two of the main ones. Recently, Tello and Ibañez [16] eva-luated 19 indexes to estimate cluster compactness highlighting the role of various cluster parameters such as branch length and number. The study proposed a fast
and good estimator for cluster compactness based on cluster weight and length.
Genetic and molecular analyses in model plants, such as Arabidopsis thaliana, demonstrated the interaction between TERMINAL FLOWER 1 (TFL1) and LEAFY (LFY) [17,18] in the establishment of inflorescence archi-tecture. Their interactions supported a simple model explaining the evolution of plants inflorescence archi-tecture [19]. TFL1 belongs to a small gene family first identified in mammals as encoding phosphatidyl ethanolamine-binding proteins (PEBP) [20], which participates in a wide variety of biological functions in eu-karyotes. In Arabidopsis, TFL1 has been shown to func-tion in the transcripfunc-tional repression of flower meristem identity genes [21]. LFY encodes a plant specific tran-scription factor [22], which serves as a flower meristem identity regulator activating the transcription of other flower meristem identity genes [23]. Recently, the exist-ence of a common genetic pathway controlling inflores-cence architecture in Arabidopsis and rice has been demonstrated indicating that this pathway could be highly conserved in angiosperms [24]. Following this re-port, four MADS-box genes are required to suppress TFL1 in emerging floral meristems; what seems to be indispensable to initiate their differentiation.
In grapevine, the family of PEBP encoding genes in-cludes at least five genes; three of them have deduced protein sequences related to Arabidopsis TFL1, being VvTFL1A the closest homologous sequence [25]. In fact, over-expression of VvTFL1A in transgenic Arabidopsis plants generates phenotypes of large and late flowering inflorescences reminding those observed when over-expressing the endogenous Arabidopsis gene [25]. Like-wise, recent findings show that the extreme cluster proliferation and delayed anthesis observed in the reiter-ated reproductive meristems (RRM) somatic variant of grapevine cultivar Carignan was caused by a single dom-inant mutation in the VvTFL1A gene. This domdom-inant mutation was identified as the insertion of a class II transposable element, Hatvine1-rrm, in the VvTFL1A promoter, triggering up-regulation of the corresponding VvTFL1A allele in reproductive and vegetative organs of the shoot apex [26]. These results suggested a role for VvTFL1A in the determination of inflorescence structure as well as on the branching pattern of the grapevine fruit clusters and the time of anthesis.
To further analyze the contribution of VvTFL1A to the phenotypic variation observed for reproductive and in-florescence traits in grapevine, the nucleotide diversity shown by this gene in a core collection of grapevine ac-cessions was analysed and a candidate gene association approach on the variation observed for fertility index, phenological variables as well as several inflorescence and berry related traits was carried out. Herein the
identification of VvTFL1A sequence polymorphisms associated with flowering and cluster traits is reported, being the most relevant ones corresponding to several INDELs in two intron regions. These INDELs are in LD with additional SNPs defining three LD blocks, which correspond to three major haplogroups. Interestingly, these haplogroups are characteristic of either wine or table cultivars in agreement with the cluster and flower-ing phenotype to which they are associated to.
Methods
Plant material
The plant material consisted of 140 grapevine cultivars corresponding to a core collection of Vitis vinifera L. subsp. vinifera intended to maximize agro-morphological diversity for 50 qualitative and quantitative traits [27]. All the cultivars are maintained at the INRA experimental station of Domaine de Vassal, Marseillan-plage, France (http://www1.montpellier.inra.fr/vassal/). The list of culti-vars, pedigree when available, classification according to use (wine, table or wine/table), geographical group accord-ing to Bacilieri et al. [6], Lacombe et al. [28] and available data of the Vitis International Variety Catalogue (http:// www.vivc.de/) are shown in Additional file 1. Classifica-tion according to Eastern and Western origin was ob-tained considering cultivars from the Iberian Peninsula (IBER), Western and Central Europe (WCEUR) and the Italian Peninsula (ITAP) as occidental cultivars; whereas cultivars from the Balkans (BALK), Russia and Ukraine (RUUK), Eastern Mediterranean and Caucasus (EMCA), Middle and Far East (MFEAS) were considered as oriental cultivars. For newly bred grape varieties, their pedigree was used to assess Western or Eastern origin to classify them according to their genetic origin and not accord-ing to breedaccord-ing location. When genetic origin of pedi-gree was questionable, the cultivar was considered to present mixed origin.
Phenotypic evaluation
Ten morphological traits related to the reproductive biology of grapevine were considered in this study. Among them, four were related to phenology (budburst time, flowering time, veraison time and maturity time); one to yield (fertility index); and five to berry and cluster features (berry weight and cluster length, width, weight and compactness). Cluster compactness was estimated from available data such as [cluster weight/(cluster length)2] [16]. Principal component analysis separated on axis 2 phenological traits from cluster size traits be-ing fertility index opposite to all other traits on axis 1 (Additional file 2). Strongest correlations were found be-tween maturity and veraison time (Pearson’s r = 0.82) as well as between cluster weight and width (Pearson’s r = 0.80). All traits were scored at the Domaine de Vassal
and were expressed as the mean value for five plants per accession analysed a maximum of three years following the recommended OIV descriptors as shown in Table 1 [11]. Details of phenotypic values obtained for each cultivar are given in Additional file 3. The phenotype distribution for these traits within the core collection is provided in Additional file 4.
Genotyping
For each genotype, 3.6 kb of the VvTFL1A gene (GSVIVT01036145001, chr6_20199669-20203319, Geno-scope 12X) were amplified and sequenced using primers listed in Fernandez et al. [26]. DNA was extracted from young leaves of each genotype as described in Adam-Blondon et al. [29]. Amplifications were carried out using Taq DNA Polymerase (Qiagen) as recommended by manufacturer. PCR products were treated with Exosap-IT reagent as recommended by manufacturer and sequenced at the Genomic Service of the Parque Cientifico de Madrid in an ABI prism 3730 (Applied Biosystems) DNA sequencer. Base calling, quality trim-ming and alignment of ABI chromatograms was per-formed using SeqScape v2.5 (Applied Biosystems). Sequence polymorphisms were manually verified to estab-lish genotypes. The nomenclature system used to name polymorphisms corresponded to letters followed by num-bers: single letter correspond to the involved nucleotide substitution using the IUB’s conventional nomenclature and“Ins” is used to designed INDEL; positive or negative numbers corresponded to polymorphism position from the first base of the“ATG start codon”. Linkage disequilib-rium (LD) calculations between polymorphisms were car-ried out using the LD option implemented in TASSEL v.2.1 [30].
Molecular diversity parameter estimates were calcu-lated using DnaSP v4.50.2 [31]. Per site nucleotide diver-sity (π) [32], Watterson θ estimate [33] and Tajima’s D [34] were calculated for the whole haplotype set and separately for the three structured sub-populations (K1, K2, K3).
Association tests
Knowing that population structure can bias association studies, the structured association (SA) method [35] and the Mixed Linear Model MLM [36] were used to reduce false positives. Population structure of the core collec-tion was determined using 20 SSR markers well scat-tered throughout the 19 grape linkage groups (LGs) [37] by a Bayesian clustering implemented in STRUCTURE v.2.3.4 [38]. The ADMIXTURE model was applied as-suming that segregation of alleles was independent. A burn-in period of 100,000 followed by 150,000 Markov Chain Monte Carlo (MCMC) iterations with 5 replicate runs were carried out for each value of population
structure tested (1≤ K ≤ 10). The optimal sub-population model was selected with the maximal likelihood K = 3 according to the ΔK method [39] and later corrections for ΔK artefacts [40]. The corresponding Q-matrix was used for structured association tests. An arbitrary cut-off value of 50% ancestry was set to assign each individual to one of the three sub-population clusters (Additional file 1). Individuals not assigned in one sub-population were considered as admixed. This structure discrimi-nates cultivars according to their use and geographic ori-gin with K2 mainly constituted by western wine cultivars (78%), K3 by eastern table cultivars (78%) and K1 com-posed by eastern and western wine cultivars and table cultivars (Figure 1). The kinship matrix was calculated on the basis of the same set of SSR markers [41] using TASSEL v.2.1.
Comparison of the naïve General Linear Model (GLM) test, the structured association test (GLM-Q) and the structured Mixed Linear Model (MLM-Q) using TAS-SEL v.3 identified the last one as the most conservative model and was therefore selected to perform the associ-ation tests. MLM-Q associassoci-ation tests were carried out using the R v.2.15 [42] and TASSEL v.3 software.
Polymorphic sites carrying rare alleles (frequencies <5% within the total sample) and unbalanced genotypic clas-ses (frequencies <5% within the total sample) were dis-carded to avoid biased associations. Rare genotypic classes were in this last case replaced by missing data. Polymorphisms were codified to test both additive and dominant effects using R to be similar with marker model tested using TASSEL. For traits showing signifi-cant associations after Bonferroni correction (P ≤ 0.05) using either TASSEL or R, multi-locus mixed-models using forward-backward stepwise regression (MLMM) were implemented using the R software to identify major non-redundant associated markers [43]. Population structure and kinship were both included in the multi-locus analysis. Best models were selected according to the extended Bayesian information criteria (EBIC) and the multiple Bonferroni criteria (mBonf ) according to Segura et al. [43].
Haplotype reconstruction and networks
As V. vinifera genotypes are generally highly heterozy-gous [37], the unphased genotypic dataset was analysed to identify the succession of linked polymorphisms along
Table 1 List of traits analysed
Trait OIV code Description Units
Budburst time 301 Mean budburst time compared with Chasselas cultivar of reference Days Flowering time 302 Mean flowering time (50% of open flowers) compared with Chasselas cultivar of reference Days Veraison time 303 Mean veraison time (50% of turn berries) compared with Chasselas cultivar of reference Weeks Maturity time 304 Mean maturity time compared with Chasselas cultivar of reference Weeks Yield = Fertility index 153 (Number of inflorescence / number of shoot ) per plant Count Berry weight 503 Average berry weight at maturity (20°Brix) Gram Cluster length 202 Average maximum cluster length at maturity (20°Brix) Centimeter Cluster width 203 Average maximum cluster width at maturity (20°Brix) Centimeter Cluster weight 502 Average cluster weight at maturity (20°Brix) Gram Cluster compactness Cluster weight/(cluster length)2 Gram/cm2
Figure 1 Population structure of theV.vinifera core collection. Schematic representation of estimated membership was obtained using STRUCTURE and classification of the individuals to one of the three genetic groups (K1, K2 and K3) was obtained using 50% of ancestry. Geographic origin (A) and fruit use (B) of each cultivar are indicated using colour codes.
the sequenced DNA region. Haplotypes were recon-structed using a PLEM algorithm [44] implemented in PHASE v2.1 applying default values of the iterative scheme [45]. Reconstructed haplotypes were submitted separately and simultaneously to three recombination detection tests implemented in the Recombination De-tection Program v3beta41 [46]. Those were the MaxChi method with a window size of 12, 20, 25 or 30 variables sites [47], the Chimaera method with a window size of 12, 20, 25 or 30 variables sites [48] and the 3SEQ method [49]. To ensure consistency, haplotypes showing a significant probability of being the result of recombin-ation (P ≤0.05) in at least two tests were considered as recombinants and excluded from further analysis as pre-viously done by Fournier-Level et al. [50].
Network analysis was carried out using the median-joining method [51] implemented in Network v4.5.1.6 (Fluxus Technology, Sudbury, UK) and fixing a weight
of 99 for the polymorphisms showing best associations with traits (Ins883, Ins422, K-737 and M-196). Three haplogroups HGA, HGB and HGC were defined accord-ing to the three LD blocks.
Results
VvTFL1A structure and sequence polymorphisms
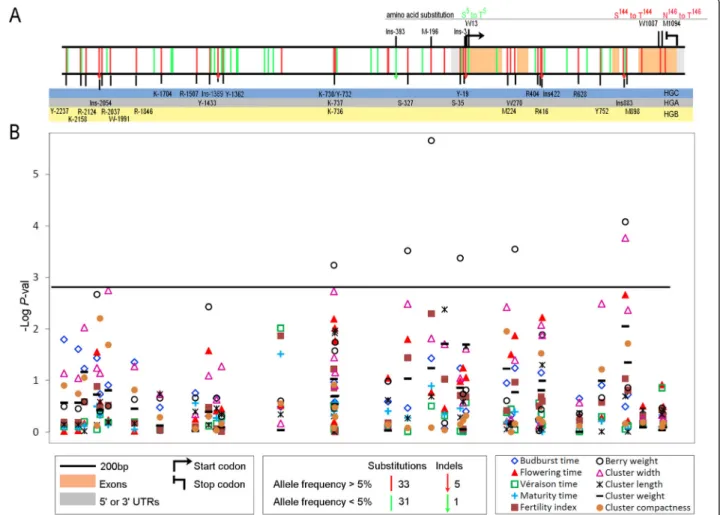
A total of 3646 bp of the VvTFL1A gene corresponding to 2442 bp and 1204 bp before and after ATG, respect-ively, were sequenced in all the individuals of the core collection. Translation of coding sequences identified the annotated four exons in the V. vinifera PN40024 genome sequence [52] of 201, 62, 41 and 218 bp and three introns of 83, 467 and 107 bp (Figure 2A). Nucleo-tide sequence analyses enabled the identification of 70 polymorphisms (64 SNP and 6 INDEL including 3 microsatellites). Among them, 44 polymorphisms were located in the promoter sequence, 4 in the 5’ untranslated
Figure 2 Sequence polymorphisms identified for theVvTFL1A gene sequence and their association to phenotypic traits. A. VvTFL1A polymorphisms found in 140 V. vinifera accessions. Single-nucleotide substitutions are depicted as vertical bars, different colours denoting allele frequency found in the collection (bottom legend box). INDEL are indicated as vertical arrows with similar colour codes. Amino acid changes are indicated. Polymorphisms are classified according to three LD blocks using a colour code: B. Level of structured MLM association detected between phenotypic traits and markers along VvTFL1A gene using TASSEL. P-value threshold 0.05 after Bonferroni correction is represented by the black line.
region, and 5 and 17 polymorphisms were located in ex-onic and intrex-onic regions, respectively. INDEL Ins-2054 and Ins-1389, located in the promoter, and Ins883 in in-tron 3, involved 5, 21 and 1 nucleotides, respectively; whereas Ins-393 and Ins-3 in the promoter, and Ins422 in intron 2 represented microsatellite variations with Ins422 being biallelic and the other two multiallelic (Figure 2A). Out of the five exonic SNP, only three (W13, W1087, and M1094) caused non-synonymous amino acid substitutions and are shown in Figure 2A. Among the 70 polymor-phisms, 32 (46%) were represented by a rare allele (fre-quency <5%), with 10 of them grouped between position −1079 and −1430 before ATG. The complete genotypic data set is available in Additional file 5.
VvTFL1A nucleotide diversity
A total of 62 haplotypes, including 37 singletons, were iden-tified based on phase reconstruction using the 70 segregat-ing polymorphisms (Additional file 6). Genetic diversity of VvTFL1A gene was estimated in terms of number of segre-gating sites (S) and polymorphism (π and θ) for all the hap-lotypes and according to population structure. Comparison of genetic diversity index among the 3 genetic groups in-ferred within the analysed core collection (see Material and Methods) indicated that despite K3 sub-population in-cluded a smaller number of haplotypes than the two other K1 and K2 sub-populations; this presented a high number of segregating sites and π and θ polymorphism indexes (Table 2). The Tajima’s D-tests showed a general neutral value considering all haplotypes and a slight but non-significant negative value in K1 sub-population compared with K2 sub-population, which showed a slight positive value (Table 2). When Tajima’s D-test was estimated in slid-ing windows along VvTFL1A; the test revealed a similar pattern of variation for K1 and K3 sub-populations with a general negative value along VvTFL1A promoter (Figure 3). In contrast, the value of D along the transcribed region in K3 sub-population increased to reach a positive value. In K2 sub-population, Tajima’s D-test showed general positive value in both promoter and transcribed regions. These pat-terns indicated different selection or demographic events between haplotypes within the three genetic groups.
VvTFL1A haplotypes
In order to study relationship between VvTFL1A haplo-types, those likely resulting from recombinant events were detected to avoid bias. Among the 62 haplotypes originally identified, 26 were considered recombinants (Additional file 6) and were removed for haplotype net-work analysis. Haplotype netnet-work was constructed using 36 non-recombinant haplotypes that included 19 single-tons. Haplotype network discriminated three groups of closely related haplotypes or haplogroups (HGA, HGB and HGC), which were clearly structured in relation with mutations in linkage disequilibrium (LD) (Figure 4). Within HGA major part of the haplotypes (44%) were present in cultivars of the K1 sub-population including Eastern and Western cultivars used as table and wine grapes. The remaining haplotypes of HGA were similarly found in cultivars of the K2 and K3 sub-population (25% and 24%, respectively). Regarding HGB and HGC 52% and 68% of their haplotypes were detected in cultivars of the K2 sub-population mainly represented by Western wine cultivars (Figure 4).
Haplotypes 32 and 3 were the most frequent (fre-quency >0.15 on the total haplotype pool and >0.19 when excluding the recombinants) and belonged to HGA and HGB, respectively. Most of the cultivars of the core collection were heterozygous for two different haplotypes (86%) with 20% of them being heterozygous for a combin-ation of HGA and HGB haplotypes (Additional file 1). Only 20 cultivars were homozygous (14%) with eight and five varieties homozygous for HGA and HGB haplotypes, respectively. Two cultivars were homozygous for haplo-type 54 of HGC and the remaining homozygous acces-sions presented putative recombinant haplotypes.
Regarding the recombinant haplotypes, haplotype 18, which was the most frequent (frequency = 0.05), corre-sponded to a recombination between haplotypes from HGA and HGB (Additional file 6). Indeed, no allele spe-cifically assigned to HGC was present in this haplotype, which was always combined with alleles typical of both HGA and HGB haplotypes. Interestingly; haplotype 18 was present only in cultivars of K1 (40%) and K3 (60%) sub-populations classified mainly as Eastern table grapes, with two cultivars being homozygous for this haplotype (Additional file 1). Furthermore, among the individuals that presented at least one HGC haplotype mainly com-posed by cultivars of the K2 sub-population, the only one Eastern table cultivar belonging to the K3 sub-population was a combination with haplotype 18.
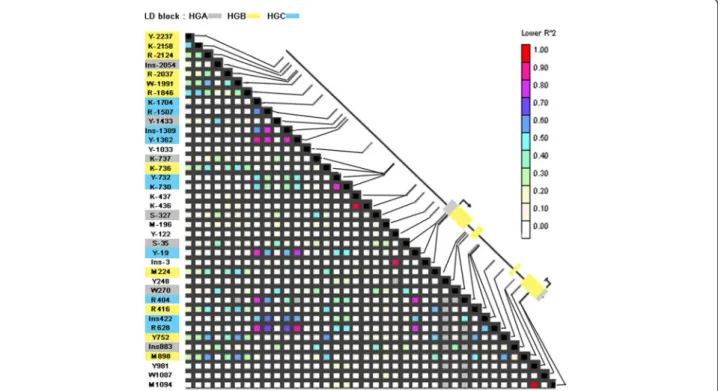
Certainly, LD pattern along VvTFL1A gene revealed three main blocks of linked polymorphisms (Figure 5): linked polymorphisms specific of HGA (Ins-2054, Y-1433, K-737, S-327, S-35, W270, Ins883) located in the promoter, the first and the third introns of VvTFL1A gene; linked polymorphisms specific of HGB (Y-2237,
K-Table 2 Pattern of diversity and neutrality tests for VvTFL1A gene All Haplotypes K1 K2 K3 S 70 62 50 48 H 62 37 35 16 π 0.00401 0.00365 0.00418 0.00412 θ 0.00439 0.00439 0.00348 0.00442 DTajima −0.29978 −0.61965 0.72764 −0.29739
S indicates number of segregating sites and H haplotype number. Analysis has been carried out in the three clusters of individuals related to the population structure. All tests yielded non-significant P-values (P >0.05).
2158, R-2124, R-2037, W-1991, R-1846, K-736, M224, R416, Y752 and M898) identified in the distal promoter region and in the three intron regions; and linked poly-morphisms specific of HGC (K-1704, R-1507, Ins-1389, Y-1362, Y-732, K-730, Y-19, R404, Ins422, R628) located in the promoter and the second intron of the VvTFL1A gene. Thus, haplogroups HGA, HGB, and HGC are con-sistent with the existence of three ancestral alleles or
evolutionary branches supported by polymorphisms in the three LD blocks.
Candidate gene association
Considering the biological function established for the Arabidopsis TFL1 gene as well as the phenological traits altered in the Carignan RRM somatic variant, the can-didate gene association study was focused on those
Figure 3 Pattern of Tajima’s D values along VvTFL1A gene. Neutral selection (D = 0) is represented by the grey line. Patterns have been obtained using sliding windows option from DnaSP (window length =500 and step size =350).
Figure 4 Median joining networks derived from reconstructed DNA sequence haplotypes ofVvTFL1A. Network analysis was carried for haplotypes identified for 70 polymorphic sites in the VvTFL1A gene excluding recombined haplotypes. Haplotypes are represented by circles with circle size proportional to haplotype frequency (circle size corresponding to haplotype numbers of 1, 5 and 25 are illustrated). The haplotypes colours relate to the accessions classification according to according to structured genetic groups (Additional file 1). Black dots represent mutational steps. Colour lines represent the mutations in LD that separated the three haplogroups identified (HG).
Figure 5 Linkage disequilibrium among polymorphisms in the geneVvTFL1A. LD plot based on R2values for SNP and INDEL with
frequency >5% were estimated according to Remington et al. [53]. The schematic representation of the VvTFL1A locus indicates ATG and stop codon position, exon regions represented by yellow boxes and UTR by grey boxes. Polymorphism classification into three LD blocks is represented by a colour code.
Table 3 List ofVvTFLlA polymorphisms showing significant association after Bonferroni correction (<0.05) with flowering time, cluster width and berry weight through structured MLM tests using either R or TASSEL
MLM-R MLM-TASSEL
Trait Marker Haplogroup P-value Bonf corr < 0.05 P-value Bonf corr < 0.05 R2 Marker Flowering time Ins883 HGA 2.72E-04 * 2.19E-03 0.104
K-737 HGA 1.04E-03 * 6.42E-03 0.089
Ins422 HGC 1.24E-03 * 6.01E-03 0.089
Berry weight M-196 1.47E-08 * 2.23E-06 * 0.163
Ins883 HGA 5.76E-07 * 8.40E-05 * 0.118
S-327 HGA 1.33E-06 * 3.06E-04 * 0.105
K-737 HGA 3.54E-06 * 5.83E-04 0.095
S-35 HGA 9.17E-06 * 4.24E-04 * 0.105
W270 HGA 1.02E-04 * 2.84E-04 * 0.112
Ins-2054 HGA 1.58E-04 * 2.16E-03 0.074
Ins422 HGC 2.32E-04 * 1.30E-02 0.059
Cluster width Ins883 HGA 1.63E-05 * 1.72E-04 * 0.130
K-737 HGA 9.18E-05 * 1.88E-03 0.097
S-327 HGB 3.34E-04 * 3.30E-03 0.086
Ins422 HGC 1.07E-03 * 1.34E-02 0.066
phenological and cluster morphological traits that could be related with its putative biological function in grape-vine. Association tests for VvTFL1A gene were run be-tween the 38 polymorphisms showing minor allele frequency≥5% and each phenotypic trait. Rare genotyp-ing classes (≤5%) were excluded from the association tests. Out of the 38 polymorphisms, only 8 presented significant associations (adjusted P-value ≤0.05) using ei-ther R or TASSEL with flowering time, berry weight and cluster width (Table 3, Figure 2B).
The strongest association was found between berry weight and SNP M-196 (P = 1.4E−8) explaining 16% of the trait variation. The highest association for flowering time and cluster width was found with Ins883 (P = 2.7E−4, P = 1.6E−5, respectively) that explained 10% and 13% of trait variation, respectively. Interestingly, Ins883 character-istic of HGA also associated significantly (P ≤0.01) with berry weight (P = 5.7E−7). At a lesser extent, Ins422 from HGC associated with the three traits explaining 9%, 6% and 7% of flowering time, berry weight and cluster width variations, respectively.
In order to determine whether the different associa-tions detected were only due to LD or were the result of the particular effect of each polymorphism, the multi-locus mixed-model analysis was carried out. Flowering time showed the strongest associations with polymor-phisms characteristic of HGA and HGC under single-locus approaches (Table 3). In the multi-single-locus analysis, the best models to explain flowering time variation iden-tified one and two polymorphisms based on optimal mBonf and EBIC criteria, respectively (Table 4). The op-timal models included Ins833 from HGA specific LD block and W1087 without LD with other polymorphisms and explained up to 16% of flowering time variation. Association between W1087 and flowering time was not identified with the single-locus approach; the use of Ins883 as covariate in the model revealed W1087 asso-ciation. The remaining markers, not included in the model, had minor and/or redundant effects with those ones. Similarly, the best models explaining up to 25% of berry weight variation included M-196 and Ins883 in agreement with the highest associations detected
with the single-locus approach. Instead, cluster width variation showing associations with polymorphisms within the three LD blocks under single-locus ap-proaches was only explained by polymorphism Ins883 (HGA) after the multi-locus mixed-model analysis. The effect of polymorphisms characteristic of HGB was minor and redundant with those of Ins883. There-fore, in addition to its high association (P ≤0.01) in single-locus analyses with three traits (flowering time, cluster width and berry weight), Ins883 was selected in the three best multi-locus models explaining the variation of those traits. Besides, Ins883 explains alone cluster width variation. These results highlight the major influence of INDEL Ins883 in the possible role of VvTFL1A on phenology and cluster traits.
Phenotypic values related to major haplotypes
Based on haplotype network and association results, two molecular polymorphisms (Ins883 and Ins422) were selected that discriminated the three haplogroups (HGA: Ins883(G)6-Ins422(GA)7; HGB: Ins883(G)5-Ins422(GA)7;
HGC: Ins883(G)5-Ins422(GA)8). The (G)6 allele of
Ins883 was associated with late flowering time, high berry weight and large cluster width (Figure 6). All hap-lotypes in HGA presented the (G)6 allele, in contrast
with haplotypes in HGB and HGC that contained the (G)5allele Regarding Ins422, the (GA)8allele was
associ-ated with early flowering time, low berry weight and small cluster width (Figure 6). All haplotypes carrying the (GA)8 allele belonged to HGC, mainly represented
by haplotype 60, while haplotypes in HGA and HGB contained the (GA)7allele.
As other polymorphisms appeared associated with these phenotypic traits, the phenotypic values were also analysed considering the three major haplotypes 32, 3 and 60 from HGA, B and C, respectively. As an average, individuals presenting at least one haplotype 32 exhib-ited late flowering, big berries and large cluster clearly in contrast to the phenotypic features of individuals containing at least one haplotype 3 or 60 (Figure 7). This was more obvious when homozygous individuals or heterozygous individuals for haplotypes 3 and 60
Table 4 MLMM results
Trait Forward step mBonf <0.05 EBIC Markers in the model Gene region Haplogroup R2 Markers R2 Model Flowering time 1 8.98E-03 609 Ins883 Intron3 HGA 0.11 0.19
2 2.61E-01 603 + W1087 Exon4 0.16 0.25
Cluster width 1 5.38E-04 492 Ins883 Intron3 HGA 0.13 0.34 Berry weight 1 1.26E-06 431 M-196 Promoter 0.21 0.76 2 1.49E-01 412 + Ins883 Intron3 HGA 0.25 0.80 The models presented corresponded to the optimal models, i.e., optimizing EBIC and mBonf criteria. R2 Markers = variance explained by polymorphisms in each model, R2 Model = cumulative variance explained by markers and genetic variance (structure and kinship).
Figure 6 Effects ofVvTFL1A INDEL Ins883 and Ins422 on flowering time, berry weight and cluster width. Box plots represent minimum and maximum (whisker), median (square dot), and 25th and 75th percentiles (box) values.
Figure 7 Phenotypic value for flowering time, berry weight and cluster width related to major haplotypes. Phenotypic values of individuals containing the major haplotypes H32, H3 and H60 and for the recombinant haplotype H18 at heterozygous or homozygous state. Box plots represent minimum and maximum (whisker), median (square dot), and 25th and 75th percentiles (box) values.
were taken into account considering the absence of homozygous individuals for haplotype 60 (Figure 7). The phenotypic value for the more frequent recombin-ant haplotype 18 found in Eastern table cultivars was also analysed, which presented the (G)6 allele at the
major INDEL Ins883 such as haplotypes of HGA. Phenotypic values for flowering time, berry weight and cluster width for haplotype 18 were slightly higher than those of individuals carrying haplotype 32 (Figure 7).
Discussion
Arabidopsis TFL1 plays a critical role in the specification of the inflorescence meristem and inflorescence archi-tecture [54,55]. This role seems to be conserved in other plant species [56] likely through a conserved regulatory pathway [24]. In grapevine, the previous identification of misexpression of the Arabidopsis homolog VvTFL1A as the molecular cause of the reiteration of reproductive meristems (RRM) mutant [26], also supported the possible conservation of its biological function in this species in agreement with previous results [57,58]. Phenotypic characterization of the RRM plants showed that VvTFL1A overexpression was related to a delay in the time of anthe-sis and to an increase in the size and branching pattern of the inflorescences [26], similar to the effects of TFL1 over-expression in transgenic Arabidopsis [21]. To provide add-itional evidence on the involvement of VvTFL1A in natural variation for flowering time and inflorescence de-velopment and to identify nucleotide sequence polymor-phisms that could be partially responsible for those traits in grapevine, a genetic diversity analysis of this gene se-quence and genetic association studies with those traits were carried out.
Nucleotide variations for VvTFL1A in the grapevine core collection analysed is relatively high with an average of one polymorphic site every 50 nucleotides. However, only five out of the 70 polymorphisms detected are lo-cated in exonic regions and only three of them result in non-synonymous amino acid substitutions. This result is in agreement with the slight negative Tajima’s D values observed along VvTFL1A coding sequences and suggests that the protein structure admits few variations. Reduc-tion in overall level of nucleotide variaReduc-tion was also re-ported for the Arabidopsis TFL1 gene when compared with other flowering genes [59]. Among the three non-synonymous polymorphisms identified in VvTFL1A, W13, located in first exon, had a very low frequency and was not considered for the association analyses. The two other, W1087 and M1094, are located in the fourth exon in a region of the protein responsible for the functional divergence between FT and TFL1 [60]; although the substituted amino acids do not correspond to conserved residues [60] and the SNP did not associate with in-florescence related traits under single-locus models.
However, W1087 was selected by the multi-locus mixed-model analysis to explain part of flowering time variation together with Ins883 suggesting a possible functional ef-fect of this SNP in this trait. Regarding the 17 polymor-phisms found in intron regions, two INDEL (Ins422 and Ins883) showed significant association with flowering and cluster trait variation. INDEL Ins422 is located in intron 2 and corresponds to a microsatellite sequence of GA repe-titions; while INDEL Ins883 is located in intron 3 and cor-responds to a G nucleotide repetition. The 48 remaining VvTFL1A polymorphisms identified in the core collection were located upstream of the translation start codon and included four INDEL. No traces of the Hatvine1-rrm transposon were detected in the promoter of VvTFL1A in the whole core collection which demonstrates the specifi-city of the insertion event causing the Carignan RRM mu-tant phenotype [26].
Nucleotide polymorphisms in VvTFL1A LD blocks that discriminate the three haplogroups displayed differential as-sociation with cluster traits under linear regression models. Among all traits analysed, polymorphic sites characteristic of HGA and HGC haplogroups explained part of the phenotypic variation for flowering time, berry weight and cluster width. In the same way, polymorphisms specific of HGB associated with cluster width as well as polymor-phisms from HGA. These results suggest that variation at VvTFL1A has an effect on flowering time, berry weight and cluster width with different alleles having differential effects on the traits. Interestingly, both flowering time delay and cluster width increase were observed in the phenotypic characterization of the RRM somatic variant related to VvTFL1A overexpression. Unfortunately, berry size was not measured in that study [26].
Among all the polymorphic sites tested, insertion Ins883 discriminating HGA from HGB and HGC explained alone part of flowering time, berry weight and cluster width varia-tions. According to the multi-locus analysis, Ins833 ex-plained up to 16%, 13% and 25% of flowering time, cluster width and berry weight variation in the best models, being the only polymorphism contributing to berry weight vari-ation. INDEL occurring in functionally important regions of genes could affect gene function, through gene expres-sion modification [61] or RNA structure alterations [62]. However, a preliminary VvTLF1A RT qPCR expression ana-lysis carried out in young inflorescences of the cultivars of the core collection did not reveal any association between gene expression variation and the VvTFL1A polymorphisms (data not shown). Likewise, no clear correlation (Pearson’s r <0.28) between VvTFL1A expression and phenotypic traits was identified (data not shown). Nevertheless, these negative results do not discard a possible role of this intron sequences in transcriptional or posttranscriptional pro-cesses given the difficulties in carrying out transcriptional comparisons among different genotypes with different
flowering behaviour. Analysis of maize TFL1 homologs expression in different tissues and developmental stages showed the existence of differential transcript process-ing [63]. In fact, in a preliminary study, the existence of alternatively spliced RNA forms was detected for the first and the second introns of VvTFL1A (data not shown). Further research will be required to demon-strate any functional role of this alternative splicing as well as its relationship with the described VvTFL1A Ins833 polymorphism. In any case, further association analyses using larger samples and specific segregation analyses will be required to confirm the detected associations.
Together with Ins883, M-196 and W1087 without LD with other VvTFL1A polymorphisms explain part of berry weight and flowering time variation according to multi-locus analysis, respectively. In contrast to Ins883 that discriminates haplotypes of HGA from those of HGB and HGC, M-196 and W1087 corresponded to mutations differentiating haplotypes within the HGA haplogroup (Figure 4). The M-196 base change located in the proximal promoter and the W1087 non-synonymous substitution in the fourth exon of VvTFL1A might rep-resent relevant structural modifications at the promoter and the protein sequence, respectively, likely affecting VvTFL1A function in a non-redundant way with Ins883. Moreover, in silico analysis using SIFT program (http:// sift.jcvi.org/) predicts that substitution of T by S at pos-ition 144 of the VvTFL1A sequence affects protein func-tion with a score of 0.04 based on the alignment of 240 closely related sequences.
VvTFL1A haplotype network differentiates three hap-logroups of closely related haplotypes. Each HG is repre-sented by a high frequency haplotype, haplotypes 32 for HGA, 3 for HGB and haplotype 60 from HGC. Consistent with the results of the association analyses, individuals containing haplotype 32 of HGA, exhibited late flowering, large cluster width and larger berries. Interestingly, most of the cultivars of K1 and K3 classified to table or table/ wine uses, characterized by these phenotypic features [6], present HGA haplotypes. This relationship is also true for accessions carrying the recombinant haplotype 18. Indeed, haplotype 18 contains Ins883 insertion present in HGA haplotypes and mostly present in Eastern table cultivars belonging to K1 and K3 genetic groups. The fact that cul-tivars carrying haplotype 18 display late flowering, large cluster width and larger berries supports a clear relation-ship between Ins883 polymorphism and the eastern table cluster characteristics. In contrast, individuals containing haplotype 60 of HGC with Ins422 insertion exhibited early flowering, shorter cluster width and smaller berries. Con-sistently, HGC haplotypes are enriched in Western wine grape cultivars mostly belonging to K2 genetic group, which are known to display those cluster and berry
features [6]. Finally, HGB haplotypes do not contain Ins422 or Ins883 insertions. The phenotype of individ-uals containing haplotype 3 (most frequent within HGB) is similar to some extent to that of cultivars carry-ing haplotype 60 (HGC). Consistently with this pheno-type, HGB haplotypes are mostly present in cultivars for wine use. Because no homozygous individuals were ob-served for haplotype 60 in the core collection, the phenotypic effect of this haplotype is supposed to be much stronger in homozygous state, which suggests that haplotype 60, related to extreme phenology and cluster characteristics, could be less favored in cultivars in homozygous state than haplotype 3. Interestingly, par-tial sequencing of VvTFL1A in 20 V.v ssp. sylvestris plants from the Iberian Peninsula identified wild haplo-types similar to haplotype 60 and belonging to HGC (data not shown). These data could indicate a western origin for haplotypes of HGC.
Conclusions
Three major VvTFL1A haplogroups were identified in cultivated grapevines based on the presence of three main polymorphism LD blocks. These haplogroups are associated to characteristic phenotypic values for flow-ering time, cluster width and berry size. Phenotypic dif-ferences between VvTFL1A haplogroups are consistent with the classification of grapevine phenotypic diversity in three different morphotypes proposed by Negrul [12] and could result from the use of different genetic pools in grapevine domestication and/or the existence of dif-ferent selection pressures on the development of table and wine cultivars. Polymorphic markers identifying haplogroups can also be relevant in marker-assisted breeding programs addressing the improvement of clus-ter structure and berry size.
Additional files
Additional file 1: List of the 140 individuals of the core collection used in this study. Variety name, pedigrees when available, bred cultivars and classification according to origin and use are indicated. Classification of individuals according to K1, K2, K3 and admixed groups is described (see materials and methods section) as well as haplotype combination and corresponding haplogroups. [N.D. not determined]. Additional file 2: Principal component analysis of phenotypic data. Additional file 3: Phenotypic value presented by the 140 individuals of the core collection for the 10 traits analysed in this study.
Additional file 4: Distributions of the ten phenotypic traits analysed in the core collection. Red line corresponds to the expected normal distribution.
Additional file 5: Genotype of the 140 core collection accessions for the 70 polymorphisms ofVvTFL1A. The standart IUB’s nomenclature for nucleic acid has been used to code SNPs. For INDEL A = deletion, C = insertion, M = heterozygous, and for triallelic microsatellites third allele has been codify as T. [n/a = not available].
Additional file 6: Sequences of the 53 haplotypes found for the VvTFL1A gene. Only polymorphic sites are indicated. Frequency and recombinant haplotypes are indicated.
Competing interests
The authors declare that they have no competing interests. Authors’ contributions
LF, PT, LT and JMM-Z conceived the study. LLC, TL, JMB, SL and PT created and characterized the core collection. LF and GB generated and characterized the sequence data. LF, LLC, JT, AFL analysed the data. LF and JMM-Z wrote the paper with the input of all authors. All authors read and approved the final manuscript.
Acknowledgments
We would like to thank Dr Javier Ibanez and Dr Stéphanie Mariette for helpful discussions; Virginia Rodriguez for her assistance for DNA extraction; Dr Carlos Alonso Blanco for his helpful comments and critical reading of the manuscript; and Dr Vincent Segura is acknowledged for assistance using MLMM software and critical reading of the manuscript. This work was funded by grant BIO2008-03892 and BIO2011-026229 from the MICINN and MINECO of Spain to JMM-Z. Networking activities were also funded by COST Action FA1003 “East–west Collaboration for Grapevine Diversity Exploration and Mobilization of Adaptive Traits for Breeding”. JT was recipient of a fellowship from the MICINN. Author details
1Instituto de Ciencias de la Vid y del Vino (ICVV), (CSIC, Universidad de La
Rioja, Gobierno de La Rioja), CCT, C/Madre de Dios 51, Logroño 26006, Spain.
2UMT Geno-Vigne® (IFV- INRA-SupAgro), 2 Place P. Viala 34060, Montpellier,
Cedex 1, France.3Bio21 Institute, Department of Genetics, University of
Melbourne, 40 Flemington road, Melbourne 3010, Australia.4INRA-SupAgro,
UMR AGAP, équipe Diversité et Adaptation de la Vigne, 2 Place P. Viala, Montpellier, Cedex 1 34060, France.5CNB-CSIC, Dpto. de Genética Molecular
de Plantas, Darwin 3, Madrid 28049, Spain.6INRA, Unité Expérimentale du
Domaine de Vassal, Route de Sète, Marseillan-plage 34340, France.7current
address: INRA, UMR Biologie du Fruit et Pathologie, B.P. 81, Villenave-d’Ornon, Cedex 33883, France.
Received: 28 March 2014 Accepted: 23 July 2014 Published: 5 August 2014
References
1. Mc Govern PE, Glusker DL, Exner LJ, Voigt MM: Neolithic resinated wine. Nature 1996, 381:480–481.
2. Levadoux L: Les population sauvage et cultivées de Vitis vinifera L. Annales de l' Amélioration des Plantes 1956, 6:59–118.
3. Mc Govern PE: Ancient wine. The search for the origins of viniculture. Princeton, NJ: Princeton University Press; 2003.
4. Aradhya MK, Dangl GS, Prins BH, Boursiquot JM, Walker MA, Meredith CP, Simon CJ: Genetic structure and differentiation in cultivated grape, Vitis vinifera L. Genet Res 2003, 81:179–192.
5. Arroyo-Garcia R, Ruiz-Garcia L, Bolling L, Ocete R, Lopez MA, Arnold C, Ergul A, Soylemezoglu G, Uzun HI, Cabello F, Ibanez J, Aradhya MK, Atanassov A, Atanassov I, Balint S, Cenis JL, Costantini L, Goris-Lavets S, Grando MS, Klein BY, McGovern PE, Merdinoglu D, Pejic I, Pelsy F, Primikirios N, Risovannaya V, Roubelakis-Angelakis KA, Snoussi H, Sotiri P, Tamhankar S, et al: Multiple origins of cultivated grapevine (Vitis vinifera L. ssp. sativa) based on chloroplast DNA polymorphisms. Mol Ecol 2006, 15:3707–3714. 6. Bacilieri R, Lacombe T, Le Cunff L, Di Vecchi-Staraz M, Laucou V, Genna B,
Peros JP, This P, Boursiquot JM: Genetic structure in cultivated grapevines is linked to geography and human selection. BMC Plant Biol 2013, 13:25. 7. Emanuelli F, Lorenzi S, Grzeskowiak L, Catalano V, Stefanini M, Troggio M,
Myles S, Martinez-Zapater JM, Zyprian E, Moreira FM, Grando MS: Genetic diversity and population structure assessed by SSR and SNP markers in a large germplasm collection of grape. BMC Plant Biol 2013, 13:39. 8. Myles S, Boyko AR, Owens CL, Brown PJ, Grassi F, Aradhya MK, Prins B,
Reynolds A, Chia JM, Ware D, Bustamante CD, Buckler ES: Genetic structure and domestication history of the grape. Proc Natl Acad Sci U S A 2011, 108:3530–3535.
9. Myles S, Chia JM, Hurwitz B, Simon C, Zhong GY, Buckler E, Ware D: Rapid genomic characterization of the genus vitis. PLoS One 2010, 5:e8219. 10. Branas J: Viticulture. Montpellier: Paul Dehan; 1974.
11. Boursiquot JM, Dessup M, Rennes C: Distribution des principaux caractères phénologiques, agronomiques et technologiques chez Vitis vinifera L. Vitis 1995, 34:31–35.
12. Negrul AM: Origin and classification of cultured grape. In The Ampelography of the USSR. Edited by Baranov A, Kai YF, Lazarevski MA, Palibin TV, Prosmoserdov NN, Baranov A, Kai YF, Lazarevski MA, Palibin TV, Prosmoserdov NN. Moscow: Pischepromizdat; 1946:159–216.
13. Molitor D, Rothmeier M, Behr M, Fischer S, Hoffman L, Evers D: Crop cultural and chemical methods to control grey mould on grapes. Vitis 2011, 50:81–87.
14. Vail ME, Marois JJ: Grape cluster architecture and the susceptibility of berries to Botrytis cinerea. Phytopatholog 1991, 81:188–191.
15. Shavrukov YN, Dry IB, Thomas MR: Inflorescence and bunch architecture development in Vitis vinifera L. Aust J Grape Wine Res 2003, 10:116–124. 16. Tello J, Ibáñez J: Evaluation of indexes for the quantitative and objective
estimation of grapevine bunch compactness. Vitis 2014, 53:9–16. 17. Bradley D, Ratcliffe O, Vincent C, Carpenter R, Coen E: Inflorescence
commitment and architecture in Arabidopsis. Science 1997, 275:80–83. 18. Shannon S, Meeks-Wagner DR: A mutation in the Arabidopsis TFL1 gene
affects inflorescence meristem development. Plant Cell 1991, 3:877–892. 19. Prusinkiewicz P, Erasmus Y, Lane B, Harder LD, Coen E: Evolution and
development of inflorescence architectures. Science 2007, 316:1452–1456. 20. Schoentgen F, Saccoccio F, Jolles J, Bernier I, Jolles P: Complete amino acid
sequence of a basic 21-kDa protein from bovine brain cytosol. Eur J Biochem 1987, 166:333–338.
21. Hanano S, Goto K: Arabidopsis TERMINAL FLOWER1 is involved in the regulation of flowering time and inflorescence development through transcriptional repression. Plant Cell 2011, 23:3172–3184.
22. Weigel D, Alvarez J, Smyth DR, Yanofsky MF, Meyerowitz EM: LEAFY controls floral meristem identity in Arabidopsis. Cell 1992, 69:843–859.
23. Parcy F, Nilsson O, Busch MA, Lee I, Weigel D: A genetic framework for floral patterning. Nature 1998, 395:561–566.
24. Liu C, Teo ZW, Bi Y, Song S, Xi W, Yang X, Yin Z, Yu H: A conserved genetic pathway determines inflorescence architecture in Arabidopsis and rice. Dev Cell 2013, 24:612–622.
25. Carmona MJ, Cubas P, Calonje M, Martinez-Zapater JM: Flowering transition in grapevine (Vitis vinifera L.). Can J Bot 2007, 85:701–711.
26. Fernandez L, Torregrosa L, Segura V, Bouquet A, Martinez-Zapater JM: Transposon-induced gene activation as a mechanism generating cluster shape somatic variation in grapevine. Plant J 2010, 61:545–557. 27. Barnaud A, Lacombe T, Doligez A: Linkage disequilibrium in cultivated
grapevine, Vitis vinifera L. Theor Appl Genet 2006, 112:708–716. 28. Lacombe T, Boursiquot JM, Laucou V, Di Vecchi-Staraz M, Peros JP, This P:
Large-scale parentage analysis in an extended set of grapevine cultivars (Vitis vinifera L.). Theor Appl Genet 2013, 126:401–414.
29. Adam-Blondon AF, Roux C, Claux D, Butterlin G, Merdinoglu D, This P: Mapping 245 SSR markers on the Vitis vinifera genome: a tool for grape genetics. Theor Appl Genet 2004, 109:1017–1027.
30. Bradbury PJ, Zhang Z, Kroon DE, Casstevens TM, Ramdoss Y, Buckler ES: TASSEL: software for association mapping of complex traits in diverse samples. Bioinformatics 2007, 23:2633–2635.
31. Rozas J, Sanchez-DelBarrio JC, Messeguer X, Rozas R: DnaSP, DNA polymorphism analyses by the coalescent and other methods. Bioinformatics 2003, 19:2496–2497.
32. Nei M: Molecular Evolutionary Genetics. New York, NY: Columbia University Press; 1987.
33. Watterson GA: On the number of segregating sites in genetical models without recombination. Theor Pop Biol 1975, 7:256–276.
34. Tajima F: Statistical method for testing the neutral mutation hypothesis by DNA polymorphism. Genetics 1989, 123:585–595.
35. Thornsberry JM, Goodman MM, Doebley J, Kresovich S, Nielsen D, Buckler ES: Dwarf8 polymorphisms associate with variation in flowering time. Nat Genet 2001, 28:286–289.
36. Yu J, Pressoir G, Briggs WH, Vroh Bi I, Yamasaki M, Doebley JF, McMullen MD, Gaut BS, Nielsen DM, Holland JB, Kresovich S, Buckler ES: A unified mixed-model method for association mapping that accounts for multiple levels of relatedness. Nat Genet 2006, 38:203–208.
37. Laucou V, Lacombe T, Dechesne F, Siret R, Bruno JP, Dessup M, Dessup T, Ortigosa P, Parra P, Roux C, Santoni S, Vares D, Peros JP, Boursiquot JM, This P: High throughput analysis of grape genetic diversity as a tool for germplasm collection management. Theor Appl Genet 2011, 122:1233–1245.
38. Pritchard JK, Stephens M, Donnely P: Inference of population structure using multilocus genotype data. Genetics 2000, 155:945–959. 39. Evanno G, Regnaut S, Goudet J: Detecting the number of clusters of
individuals using the software STRUCTURE: a simulation study. Mol Ecol 2005, 14:2611–2620.
40. Vigouroux Y, Glaubitz JC, Matsuoka Y, Goodman MM, Sanchez GJ, Doebley J: Population structure and genetic diversity of New World maize races assessed by DNA microsatellites. Am J Bot 2008, 95:1240–1253. 41. Fournier-Level A, Le Cunff L, Gomez C, Doligez A, Ageorges A, Roux C,
Bertrand Y, Souquet JM, Cheynier V, This P: Quantitative genetic bases of anthocyanin variation in grape (Vitis vinifera L. ssp. sativa) berry: a quantitative trait locus to quantitative trait nucleotide integrated study. Genetics 2009, 183:1127–1139.
42. Kang HM, Zaitlen NA, Wade CM, Kirby A, Heckerman D, Daly MJ, Eskin E: Efficient control of population structure in model organism association mapping. Genetics 2008, 178:1709–1723.
43. Segura V, Vilhjalmsson BJ, Platt A, Korte A, Seren U, Long Q, Nordborg M: An efficient multi-locus mixed-model approach for genome-wide association studies in structured populations. Nat Genet 2012, 44:825–830. 44. Qin ZS, Niu T, Liu JS: Partition-ligation-expectation-maximization
algorithm for haplotype inference with single-nucleotide polymor-phisms. Am J Hum Genet 2002, 71:1242–1247.
45. Stephens M, Donnelly P: A comparison of bayesian methods for haplotype reconstruction from population genotype data. Am J Hum Genet 2003, 73:1162–1169.
46. Martin DP, Williamson C, Posada D: RDP2: recombination detection and analysis from sequence alignments. Bioinformatics 2005, 21:260–262. 47. Maynard Smith J: Analyzing the mosaic structure of genes. J Mol Evol
1992, 34:126–129.
48. Posada D, Crandall KA: Evaluation of methods for detecting recombination from DNA sequences: computer simulations. Proc Natl Acad Sci U S A 2001, 98:13757–13762.
49. Boni MF, Posada D, Feldman MW: An exact nonparametric method for inferring mosaic structure in sequence triplets. Genetics 2007, 176:1035–1047. 50. Fournier-Level A, Lacombe T, Le Cunff L, Boursiquot JM, This P: Evolution of
the VvMybA gene family, the major determinant of berry colour in cultivated grapevine (Vitis vinifera L.). Heredity (Edinb) 2010, 104:351–362. 51. Bandelt HJ, Forster P, Rohl A: Median-joining networks for inferring
intraspecific phylogenies. Mol Biol Evol 1999, 16:37–48.
52. Jaillon O, Aury JM, Noel B, Policriti A, Clepet C, Casagrande A, Choisne N, Aubourg S, Vitulo N, Jubin C, Vezzi A, Legeai F, Hugueney P, Dasilva C, Horner D, Mica E, Jublot D, Poulain J, Bruyère C, Billault A, Segurens B, Gouyvenoux M, Ugarte E, Cattonaro F, Anthouard V, Vico V, Del Fabbro C, Alaux M, Di Gaspero G, Dumas V, et al: The grapevine genome sequence suggests ancestral hexaploidization in major angiosperm phyla. Nature 2007, 449:463–467.
53. Remington DL, Thornsberry JM, Matsuoka Y, Wilson LM, Whitt SR, Doebley J, Kresovich S, Goodman MM, Buckler ES: Structure of linkage disequilibrium and phenotypic associations in the maize genome. Proc Natl Acad Sci U S A 2001, 98:11479–11484.
54. Jack T: Molecular and genetic mechanisms of floral control. Plant Cell 2004, 16(Suppl 1):S1–S17.
55. Ratcliffe OJ, Amaya I, Vincent CA, Rothstein S, Carpenter R, Coen ES, Bradley DJ: A common mechanism controls the life cycle and architecture of plants. Development 1998, 125:1609–1615.
56. McGarry RC, Ayre BG: Manipulating plant architecture with members of the CETS gene family. Plant Sci 2012, 188–189:71–81.
57. Boss PK, Sreekantan L, Thomas MR: A grapevine TFL1 homologue can delay flowering and alter floral development when overexpressed in heterologous species. Funct Plant Biol 2006, 33:31–41.
58. Carmona MJ, Calonje M, Martinez-Zapater JM: The FT/TFL1 gene family in grapevine. Plant Mol Biol 2007, 63:637–650.
59. Olsen KM, Womack A, Garrett AR, Suddith JI, Purugganan MD: Contrasting evolutionary forces in the Arabidopsis thaliana floral developmental pathway. Genetics 2002, 160:1641–1650.
60. Ahn JH, Miller D, Winter VJ, Banfield MJ, Lee JH, Yoo SY, Henz SR, Brady RL, Weigel D: A divergent external loop confers antagonistic activity on floral regulators FT and TFL1. Embo J 2006, 25:605–614.
61. Warren ST, Zhang F, Licameli GR, Peters JF: The fragile X site in somatic cell hybrids: an approach for molecular cloning of fragile sites. Science 1987, 237:420–423.
62. Collins FS, Drumm ML, Cole JL, Lockwood WK, Vande Woude GF, Iannuzzi MC: Construction of a general human chromosome jumping library, with application to cystic fibrosis. Science 1987, 235:1046–1049.
63. Danilevskaya ON, Meng X, Hou Z, Ananiev EV, Simmons CR: A genomic and expression compendium of the expanded PEBP gene family from maize. Plant Physiol 2008, 146:250–264.
doi:10.1186/s12870-014-0209-3
Cite this article as: Fernandez et al.: Haplotype diversity of VvTFL1A gene and association with cluster traits in grapevine
(V. vinifera). BMC Plant Biology 2014 14:209.
Submit your next manuscript to BioMed Central and take full advantage of:
• Convenient online submission • Thorough peer review
• No space constraints or color figure charges • Immediate publication on acceptance
• Inclusion in PubMed, CAS, Scopus and Google Scholar • Research which is freely available for redistribution
Submit your manuscript at www.biomedcentral.com/submit