HAL Id: hal-01499069
https://hal.archives-ouvertes.fr/hal-01499069
Submitted on 2 Jun 2020
HAL is a multi-disciplinary open access
archive for the deposit and dissemination of sci-entific research documents, whether they are pub-lished or not. The documents may come from teaching and research institutions in France or abroad, or from public or private research centers.
L’archive ouverte pluridisciplinaire HAL, est destinée au dépôt et à la diffusion de documents scientifiques de niveau recherche, publiés ou non, émanant des établissements d’enseignement et de recherche français ou étrangers, des laboratoires publics ou privés.
Vine planting rights, farm size and economic
performance: do economies of scale matter in the French
viticulture sector?
Bernard Delord, Alfredo Manuel de Jesus Oliveira Coelho, Etienne Montaigne
To cite this version:
Bernard Delord, Alfredo Manuel de Jesus Oliveira Coelho, Etienne Montaigne. Vine planting rights, farm size and economic performance: do economies of scale matter in the French viticulture sector?. 8. International Conference of the Academy of wine business research, Academy of Wine Business Research (AWBR). INT., Jun 2014, Geisenheim, Germany. �hal-01499069�
1 +
Vine planting rights, farm size and economic performance:
do economies of scale matter in the French viticulture sector? (*)
Bernard DELORD
INRA-MOISA, France (delord@supagro.inra.fr) Alfredo COELHO
SupAgro-MOISA, France (coelho@supagro.inra.fr) Étienne MONTAIGNE
SupAgro-MOISA, France (montaigne@supagro.inra.fr)
Abstract
This paper assesses the existence of both greater profitability for large-scale farms and economies of scale in the French viticulture sector, thereby confirming or invalidating the argument put forward by the European Commission to justify the abolition of vine planting rights. According to this argument (1) economic efficiency increases with the extension of the vine area in vineyards, and (2) vine planting rights prevent the expansion of farms.
This article discusses the issue of economies of scale in agriculture and focuses on specific matters related to viticulture. The key issue of our demonstration lies in the impossibility of defining economies of scale by comparing the profits of farms producing different types of product at different prices. By using an assessment of these variables through FADN, it proposes and justifies the interest of using a measurement of output which is the net value added per unit of labor.
The report prepared on behalf of the European Parliament is criticized as it demonstrates a positive correlation between size and efficiency, without taking account of the broad farm gate price dispersion for wine. This article demonstrates that in the case of France, over the period 2005-2007, farm size has little impact on performance. The significant differences observed are the result of differences in the selling price of wine.
In summary, the main argument put forward by the European Commission to justify cancelling vine planting rights is not adapted to the case of France because it considers wine as a single product sold at a single price.
Key words: planting rights, wine growing farm, profitability, economies of scale, price.
2 The European Commission is pursuing the goal of reforming the Common Agricultural Policy through the adaptation of agriculture and farmers to market signs: the regulations are changing and interventions are gradually being redirected towards new efficiency goals on the one hand and sustainability on the other. Efforts aimed at increasing efficiency are accompanied by the hope that an improvement in the economic performances of producers will be based on increased farm size as this provides an opportunity to exploit economies of scale. According to some authors, such economies of scale can be achieved in agriculture just as in other industries (Nooteboom, 2006), even if some researchers have long contested their existence (Boussard, 1973).
The last CMO for wine, introduced in 2008, established new legislation ensuring the definitive suppression of vine planting rights. The main justification for this decision was based on the negative impact of the previous legislation on the production costs and competitiveness of European viticulture compared to New World wine producers (Montaigne, Coelho, 2006): according to the European Commissioner, M. Dacian Ciolos, “… this analysis
demonstrated that vine planting rights lead to an increase in the cost of production and are a barrier to the rationalization of farm holdings, thus decreasing competitiveness”1. In the months following this reform, many heated debates were held (Vautrin, 2010; Montaigne & al., 2012) concerning the existence of economies of scale in the viticulture sector and the Commission wrote a draft containing new rules for managing production potential through vine planting rights.
In the viticulture sector, increased farm size may be the result of two mechanisms: first, the promotion of economic concentration, when the total volume of production is unchangeable, through the elimination of small-scale producers. Such a phenomenon has been observed in many other agricultural segments (Kroll, 1987). While this mechanism worked well in viticulture, some researchers considered it insufficient. The suppression of vine planting rights will have no impact on this speed of change, at least in those zones where farm holdings are highly specialized in viticulture, because the mechanism depends on the life-cycle of farms and of the individual choices between sale of the land and grubbing-up of vines.
Second, the result may be achieved through the growth of certain farm holdings by planting new vines resulting in an increase in the total surface area of the vineyard. We can therefore raise two questions: first, what would be the consequences of increased production on the market in terms of prices and farmers’ revenues? While this is an important question, it exceeds the scope of this paper. Second, would large-scale farms, either newly created or recently expanded, be more efficient than the smaller ones?
Our article focuses on the final issue. We intend to determine the existence and extent of economies of scale in the viticulture segment as well as the direct link between the size of farm holdings and their profitability. At present, as a study at European level seems unfeasible due to access constraints to European agricultural data, we will focus here only on the case of France.
In the first section, we will address measurement issues relating to economies of scale in agriculture, and more particularly viticulture. Here, we will introduce an index to identify their existence and extent.
3 We will then study the variations in this index, illustrating the need to take account of the significant differences in the price of wine.
In the third section, we will demonstrate that for each class of prices in the French viticulture sector, variations in profitability as a function of vine surface area do not exist or are simply erratic. Whatever the case, these variations are too weak to increase the capacity of large-scale farm holdings to achieve acceptable revenues and small-scale farm holdings do not reach such revenues.
In the final section of this article, in order to extend our discussion beyond the French case, we will demonstrate that the legislation relating to vine planting rights in the European Union did not prevent the increase in the average size of farm holdings over the past 17 years.
1. THE SIZE OF FARM HOLDINGS: AN ECONOMIC ISSUE
“Economies of scale may be defined initially as those that result when the increased size of a
single operating unit producing or distributing a single product reduces the unit cost of production or distribution.” (Chandler, 1994)2
Economies of scale result from the existence of fixed costs or, in other words, the indivisibility of certain production factors, as well as from learning economies (improved skills) and economies relating to the cost of inputs in relation to changing production techniques (Vettori, 2003).
Economies of scale in agriculture
In agriculture, economies of scale are most often linked with mechanization which allows the use of more powerful and high-performance machines. However, the existence of economies of scale in agriculture has been always at the heart of agricultural studies. Some authors have contested their very existence or the extent to which they can be achieved in agriculture (Boussard, 1973 and 1987; Marshall et al., 1997; Gleyses, 2007; and initially Marshall, 1890)3. Others, without systematically questioning their existence, note their limited importance (Chavas, 2001).
With regard to the debate on the existence and extent of economies of scale, two recent studies in the dairy industry provide ambiguous conclusions: the first (Institut de l’Elevage, 2011) shows economies of scale ranging from €10 to 19 per thousand liters of milk, depending on the type of production system, for an estimated average cost of approximately €500.
If we exclude the cost of labor, these economies of scale exist for a volume of between 200 and 700 thousand liters of milk produced every year. Above this level of production, economies of scale do not exist. The main result shows that individual costs vary considerably
2 Here highlighted by the authors. 3
“In agriculture and other trades in which a man gains no very great new economies by increasing the scale of
his production, it often happens that a business remains of about the same size for many years, if not for many generations”. (Marshall, 1890, p. 238)
4 from one farm to another, independent of the size of the farm, a fact which can lead to very significant variations in the revenues of family labor.
A second study in the same industry in Canada (Perrier, 2011) reaches similar conclusions: small economies of scale are achieved for between 45 and 120 cows while economies of scale stabilize for larger farms. The author finds a lack of economies of scale if labor constraints are taken into account together with scattered profits: small farm holdings may be considerably more profitable than larger farms.
In the agricultural sector, the question of economies of scale is currently being reviewed, namely by taking account of environmental considerations and by establishing a link between economies of scale and economies of scope and learning. The French study of the dairy industry therefore compares the profits of specialized barns with those of farm holdings engaged on polyculture and cow breeding and suggests that self-supply (consumption of its own grain, pastureland and fodder) and the valorization of by-products (manure) balances any economies of scale achieved in specialized farms.
These studies therefore draw our attention to the specificity of the results according to the nature of the products, which can either be associated with the land (grass, grain) or removed from the land (milk). Furthermore, in all cases, these products or crops are essentially
commodities with a single market price. The studies also highlight the sensitivity of the
outcomes to the estimated remuneration of labor on farms. Thus, the decision whether or not to consider the hourly remuneration of labor can considerably alter the outcomes.
Economies of scale in viticulture
The above studies do not focus on viticulture yet it would appear important to examine this particular agricultural crop as previous studies show that the desire for economies of scale seems to be the main justification for changes to the legislation concerning the suppression of vine planting rights. Likewise, this question was also addressed in the goals of the study commissioned by the European Parliament (Sardonne, 2012)4.
Economies of scale are defined as the decrease in the average cost of production of ONE product when the quantities (or volumes) of that product increase.
Like most of the European viticulture segments, French viticulture is characterized by a supply of wines demonstrating varying levels of quality, with very different reputations and related to a wide range of PGI or PDO labels. Differences among wines go beyond the distinction between “Quality wine” and “Wine other than quality”. This distinction classifies farms according to the Type of Farming5 in the surveys and namely the FADN, a distinction adopted in the report commissioned by the European Parliament. Furthermore, these wines are generally produced in diverse geographical areas defined by law, often with heterogeneous yield constraints. Finally, wines are sold at very different prices with differences ranging from 1 to 206 and above.
4
“The expected advantages of liberalization are related to cost and supply flexibility. It is expected that a cost reduction may be achieved by eliminating the direct and indirect costs of requesting and acquiring planting rights and possibly the economies of scale linked to more suitable sizes of vineyards” p. 26 .
5 See definition in the appendix. 6
5 It is therefore clear that the “wine” category does not satisfy the condition of uniqueness of the product necessary to the pursuit of potential economies of scale; the same applies to the two categories of “Quality wines” and “Wine other than quality”. This situation is quite specific to viticulture because most agricultural crops are commodities with a standard quality whose price is unique and defined by the market (the exceptions, such as the case of milk used in the production of PDO cheese, are relatively rare and concern low volumes or quantities).
Concerning our problem statement, and considering the difficulty encountered in applying this rationale to each of the 350 French designations of origin, we will adopt a differentiation for the farm holdings according to the average selling price of the wine as a proxy for homogenous categories of wine.
Our insistence on the heterogeneity of the price of wine is not intended to highlight the existence of differences in revenues based on the price (which would be a quite trivial matter). It endeavors to show the need to take these differences into account when assessing economies of scale and, more generally, the size effect on profitability. From a methodological point of view, it seems impossible to compare the production costs of two farms producing different wines, i.e. different products7. The concept of economies of scale can be applied to a single product or to similar products from both farms.
Accordingly, if this precaution were not taken, an evaluation of the size effect on costs or on profitability would not make sense. We will now define the relationship between economies of scale and profitability.
Economies of scale and profitability
The main difficulty in measuring costs in agriculture (the same applies to viticulture) lies in the estimation and measurement of labor costs. Indeed, for the vast majority of farm holdings, the work of the leading farmer (or owner) and possibly of other members of his family accounts for the largest proportion, and often all, of the labor used in production. Currently, this family labor is not formally paid, at least not taking into account a relatively fixed rate from one farm holding to another: it is the profit of the farm holding that is used as a means to compensate family labor.
Consequently, one cannot speak of measuring the production costs related to labor involvement. We do not, therefore, include labor in the appraisal of production costs. However, in order not to ignore the importance of this production factor, we sought to establish an economic indicator of differences between farm holdings that takes account of labor productivity but does not involve cost. The ‘net value added per worker’ calculated on the basis of the FADN data satisfies this condition. However, we must also demonstrate that the variations in this indicator are good proof of the existence or absence of economies of scale and their potential magnitude.
Let us consider the following variables: nVA: net value added
7 There is no case here of economies of scope as we rank each vineyard according to the average price and
6 P: wine selling price
Q: wine production (volume) S: surface area of vineyard
Y: yield (wine volume per vineyard unit) L: labor quantity
C: production costs (without labor) = intermediate consumption + depreciation By definition, for a farm producing wine and only one type of wine:
nVA = (P*Q) - C
therefore:
nVA / Q = (P*Q)/Q – C/Q
so:
(nVA / L) * (L/Q) = P – C/Q
therefore:
nVA / L = [P – (C/Q)] * Q/L
so:
nVA / L = [P – (C/Q)] * (S/L)*Y (1)
In other words, the net value added per worker (nVA / L) is equal to the difference between the selling price and the cost (excluding labor) per unit of production (C / Q), multiplied by the yield and the physical productivity of labor (S / L, i.e. the surface area per worker).
Let us now focus on the variations of net value added per worker in light of changes to the unit cost and physical labor productivity. Together, these elements form the basis for assessing economies of scale if their significance decreases when the size (of the vineyard) increases. We have already stated the need to make assumptions for a given class of selling prices; therefore P is a constant that does not depend on the surface area. The same rationale applies to yields since within the same designation of origin, yields (like prices) are equal or similar8.
From the point of view of the existence of economies of scale, 4 cases – and only 4 – can arise:
H1: unit costs (excluding labor) decrease and physical labor productivity remains unchanged. According to equation (1) above, it is clear that our economic indicator (net value added per worker) increases.
H2: unit costs remain unchanged and physical productivity of labor increases: our economic indicator increases.
H3: unit costs decrease and physical productivity of labor increases: our economic indicator increases.
H4: unit costs increase and physical productivity of labor also increases9. In this case, reasoning according to production costs alone cannot lead to a decision being taken because
8 In French viticulture, there is a notable exception to this rule (for the production of Cognac) which we will
address later on.
9 We can relate to this situation a case where the unit costs decrease while physical labor productivity also
7 the unit price of family labor is unknown by nature and we cannot, therefore, find a balance for these opposite variations. In other words, nothing allows us in this situation to say whether or not economies of scale exist. However, reviewing our indicator (net value added per worker) can help us to make a decision. For example, if the indicator increases at the same time as the size of the vineyard, this can favor the development of economies of scale.
In short, at a given price (and performance) level, the net value added per unit of labor changes to the same extent as the average unit cost, although in opposite directions thus making it a very good indicator of whether or not economies of scale exist. It should also be noted that the study for the European Parliament (Sardonne, 2013) adopted exactly the same indicator.
Finally, and most importantly, this indicator (net value added per worker) allows us to measure the effectiveness of economies of scale (when they exist) in substantially improving incomes in large farm holdings, for example by helping them to meet or exceed the minimum socially accepted income. Indeed, the net value added per worker is primarily used to pay family labor (and possibly the salaries of non-family workers). Other uses (payment of interests on loans and land leases per worker) are much smaller and we have no reason to believe they vary a priori with the size of the vineyard since they primarily depend on the financial situation of the farm owner and not on the business operations of the farm holding. This indicator therefore shows whether it is possible to improve unit labor remuneration in viticulture by increasing farm size. These possible improvements in remuneration result from economies of scale, i.e. a lower unit cost excluding labor and / or improved physical labor productivity, all for a given (non-variable) level of wine selling prices.
Differences in net value added per worker between large and small farms are a good indicator of the adequacy of the EU policy aimed at fostering the growth of farms by eliminating vine planting rights with regard to its goal of improving farm performances and thus obviating the policy of supporting viticulture.
We can now discuss the economic effects of abolishing planting rights.
2. LIMITATIONS OF STUDIES NEGLECTING PRICE HETEROGENEITY
In 2011, a report prepared on behalf of the European Parliament (Sardone, 2012) addressed wine-growing issues. This report focused on the debate concerning the abolition of vine planting rights.
Some clear results
One argument developed in this study established a relationship between the profitability (as measured through the Net Value Added per unit of labor) of the farm holdings and the different sizes of the farms10. The data considered was provided by FADN for the period
10
“Currently, the existing economies of scale in viticulture (see §3.2.1; Cembalo et al., 2010) largely dependent on mechanization (Pomarici et al, 2006; Galletto e Barisan, 2007), may, in the event of liberalization, determine a pressure towards expanding vineyards. Such a phenomenon would accentuate the split between capital intensive processes based on large vineyards which may become larger, and small labor-intensive farms. In such a situation, the competitive pressure of larger farms on the smaller units may, in principle, determine the
8 2006-2009. With regard to France, only two regions were considered: Aquitaine and Languedoc-Roussillon (Graph 1). The study distinguishes between farms belonging to the different ‘types of farming’ (TF): ‘grape growing with designation of origin’ and ‘other grape growing’.
This study highlights a strong trend towards increased profitability when the surface area of the vineyard increases. This is true for the case of the ‘other grape growing’ TF and for the ‘grape growing with designation of origin’ TF, despite a slightly reduced significance for the latter.
Graph 1 – Farm net value added per average work unit per category of vineyard (k€/awu) - Aquitaine and Languedoc-Roussillon (period 2006-2009)
Source: Sardone et al., 2012 – p.77, figure 3.9 (Data source: EU-FADN – DG AGRI)
Some comments about this study
It should be noted that considering two regions together may influence the results. This is not of consequence for the “grape growing other than quality” TF, only available in Languedoc-Roussillon, but for the “grape growing with designation of origin” TF where 1/3 of the surface areas are located in Languedoc-Roussillon and 2/3 are situated in Aquitaine. These two regions are characterized by designations of different origin and therefore by different price levels. This explains why profitability in Languedoc is clearly lower than in Aquitaine. This situation, combined with the presence of larger farms in Languedoc, may affect the interpretations of the observations. “Quality wine” and “Wine other than quality”
One should also notice the distinction between the influences of the two TFs (“Quality wine” and “Wine other than quality”) in distinguishing wine selling price levels. However, this distinction is not sufficient. In Languedoc-Roussillon, in the case of the “wines with designation of origin” TF, the coefficient of variation (among the farms) of the selling price is approximately 0.60, which is relatively significant. Moreover, several direct relationships exist between farm size and selling price. For example, for a surface area of vines of more than 50 ha, the average price is around €75/hl in contrast to a price of less than €40/hl for farm sizes between 10 and 15 ha. Establishing a link solely between profitability and the size of the vineyards is relatively restrictive, even if our reasoning goes from one type of farming (TF) to another.
marginalization of the latter. Indeed, with the abolition of planting rights, small labor-intensive processes are exposed to the risks of shrinking.” (Sardone & al. 2012, p. 89-90)
-10 -5 0 5 10 15 20 25 30 35 <2,5 ha 2,5-5 5-7,5 7,5-10 10-15 15-20 20-30 30-50 >=50ha TF Quality wine Wine other than quality
9 Another interesting point highlighted in this study is that, considering the two regions globally or individually for whatever TF considered, independent of the size category retained, profitability never reaches a high level; in all situations the values are below the average profitability of French agricultural farms (i.e. approximately €31,000 per unit of labor, period 2005-2007).
Accordingly, if the study quoted above were to take into account other winegrowing regions in France and include differences in the wine selling prices, the results and conclusions would be considerably different.
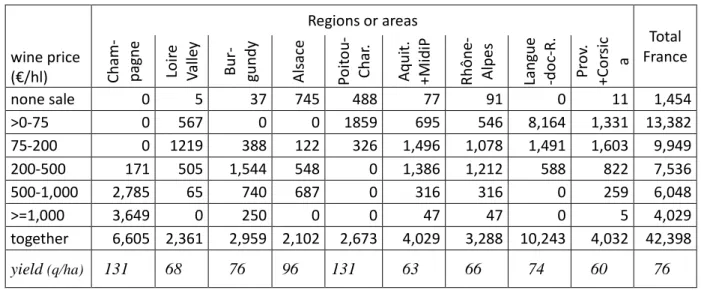
The selling price of the wine varies considerably from one farm to another. These variations are mainly related to the different designations of origin (Delord 2011). Even limiting the boundaries of our analysis to the regional level, the differences are significant (see Table 1). Table 1 - Distribution of farms represented according to the selling price of the wine and
the location wine price (€/hl) Regions or areas Total France Ch am - pa gn e Lo ire Valle y Bu r-gu nd y Als ac e Po ito u-Ch ar . Aq ui t. +M id iP Rh ôn e-Al pe s La ngu e -d oc -R . Pr ov . +C ors ic a none sale 0 5 37 745 488 77 91 0 11 1,454 >0-75 0 567 0 0 1859 695 546 8,164 1,331 13,382 75-200 0 1219 388 122 326 1,496 1,078 1,491 1,603 9,949 200-500 171 505 1,544 548 0 1,386 1,212 588 822 7,536 500-1,000 2,785 65 740 687 0 316 316 0 259 6,048 >=1,000 3,649 0 250 0 0 47 47 0 5 4,029 together 6,605 2,361 2,959 2,102 2,673 4,029 3,288 10,243 4,032 42,398 yield (q/ha) 131 68 76 96 131 63 66 74 60 76
Source: FADN-France, constant sample 2005-2007– authors’ computation
Let us now identify some possible variations in profitability for homogeneous groups of wine according to the size of farms in the French viticulture segment.
3. SURFACE AREA, PRICE AND PROFITABILITY IN VITICULTURE
Because of the difficulty encountered in accessing FADN databases for all European countries, we decided to limit our analysis to the case of France. We consider a constant sample for the period from 2005 to 2007: from a total of 42,400 farms (viticulture), a sample of 797 was surveyed (for more details, see Appendix).
Differentiation according to wine selling prices
We have already emphasized the need to take account of regional differences in wine production (beyond the traditional distinction between viticulture ‘with’ or ‘without’ designation of origin) and differences in the price ranges for those wines. We will satisfy this obligation by identifying five price levels. Moreover, considering that the distribution of French farms (viticulture) according to their surface area varies considerably from one price
10 range to another, we chose not to define categories of surface area with fixed boundaries but to use a distribution in percentiles, in this case quartiles (the boundaries are provided in the appendix).
Among the grape farms with a high average selling price (i.e. greater than €500/hl), i.e. accounting for 24% of French specialized grape farms, surface area is not a significant factor in explaining the variation in the profitability of labor (see graph 2). For grape farms with a grape price ranging from €200 to €500/hl (i.e. approximately 18% of French farms specialized in grape growing), there is an increasing labor profitability trend which is nevertheless relatively, ranging from 10% in the first (<7.47 ha) and the last quartile (>20.8 ha).
Graph 2 – Profitability by wine price classes
Source: FADN-France, constant sample 2005-2007– authors’ computation
Whenever the price is lower than €200/hl, the variations in labor profitability are more significant and almost regular: between the 1st and the 4th quartile, it increases by about 50% for the grape farms selling wines at a price below €75/hl (35% of French farms specialized in viticulture) and it almost doubles for grape farms selling wine at an average price ranging from €75 to €200/hl (24% of French grape farms specialized in viticulture). Likewise, in this case, it is the increase in the physical productivity of labor (i.e. the number of hectares of vines per unit of labor) that is the main factor underlying the variations.
Price and yield
The grape farms with a price below €75/hl are quite heterogeneous: a proportion of these farms (i.e. about 1/5) are located in the Poitou-Charentes region where the production of PDO Cognac (distilled from wine) is predominant. By taking account of the special conditions of this production, and in particular the relatively high yields, the profitability of these farms is very high. We do not need to treat farms producing Champagne in the same way (they also have very high yields) as they are sufficiently isolated in the category, representing a price of more than €1000/hl price.
0 10 20 30 40 50 60 70 80 90 Q1 Q2 Q3 Q4 far m n et v al u e ad d ed p er av er ag e w o rk u n it ( k € /a w u ) quartiles of vineyards price of wine (€/hl) <75 75-200 200-500 500-1000 >=1000 together
11 If we exclude the grape farms in the Poitou-Charentes region, the profitability of selling at less than €75/hl is significantly lower and, most importantly, fluctuates erratically according to the surface area (see Graph 3).
Graph 3 - Profitability by wine price categories, not including Poitou-Charentes
Source: FADN-France, constant sample 2005-2007 – authors’ computation
We should notice that, in the case of grape farms selling wine at low prices, the level of profitability is low. Even in the case of large farms (i.e. farms included in the last quartile, owning more than 26 or 27 ha of vines), the value does not exceed €28,000 per worker; it reaches €24,000 when the selling price is lower than €75/hl; even if we exclude grape farms from the Poitou-Charente region, the maximum values would reach €25,000 and €15,000 respectively.
Among those farms obtaining less than €200/hl, such a level of profitability is not sufficient to pay for labor according to the minimum legal labor rules: the minimum wage (SMIC in French) is about €20,000/year for this period, when the cost of social protection is included. After incorporating taxes, the payment of interest on debts and land rental (fermages), the revenue per unit of labor never reaches the minimum wage level. For prices ranging from €75 to €200/hl, revenue increases considerably (almost doubling) between the 1st and 4th quartiles; however, if we exclude the Poitou-Charentes region, it remains below the minimum wage. For prices below €75/hl and excluding Poitou-Charentes, the revenue per unit of labor varies erratically when compared with the areas of vines and always remains inferior to half of the minimum wage.
This minimum income level can only be reached in the case of average selling prices ranging from €200 to €500/hl. Even then, it only slightly exceeds the minimal wage in the same way (i.e. approximately 10 percent), independently of the quartile considered.
A synthetic overview
An initial attempt to summarize the results is provided using a Multiple Correspondence Analysis combining the variables that may have an impact on profitability for every farm: size of the vineyard, physical productivity (surface per unit of labor), yield (volume of grapes
0 10 20 30 40 50 60 70 80 90 Q1 Q2 Q3 Q4 F a rm n e t v a lu e a d d e d p er av er ag e w o rk u n it ( k € /a w u ) Quartiles of vineyards Price of wine (€/hl) <75 75 à 200 200 à 500 500 à 1000 >=1000 together
12 harvested per unit of surface area), average selling price and profitability (net value added per unit of labor). These are the modes of those variables that we did split in classes. The French wine-growing regions are included as additional variables, but not in the first step. These variables were not included ex-ante to determine the values of the axis and we therefore simply added these supplementary variables to the axis afterwards.
In the first 2 axes – among 27 possibilities – there is an overall contribution of 24% to total inertia (see graph 4 in the appendix). Of the 27 modalities of the variables, 18 have one correlation (squared-cosine) greater than 0.1, of which 12 are greater than 0.2. Graph 4 introduces a “scaphoid” (here a horizontal “U shaped” curve).
If we consider typology, the modalities of the 5 variables are represented in the scaphoid in a logical order. However, their signification is not the same: profitability (red in the graph) and wine price (yellow) go in one direction (‘upstream’), while the representation of the surface areas (green) and physical productivity (blue, measured as hectares per annual work unit) go in another direction (‘downstream’).
The yield (measured as quintals of grapes per hectare – black), whose modes are put together near the center of gravity, is independent of this order except at the point where the higher yields (> 100 q/ha) are located in an area of high profitability and high prices, i.e. close to the Champagne area. We therefore notice the very specific position of Poitou-Charentes in the graph, located between profitability and high yields (Champagne) and the low prices with high physical productivity (surface per labor unit) typical of Languedoc-Roussillon. This representation therefore confirms that it is necessary to study each region individually.
As in the entire TF, physical labor productivity (i.e. the number of hectares per worker) seems to be relatively dependent on farm size. However, in the case of the TF specialized in grape growing, physical productivity does not provide a significant explanation of the differences in productivity and the differences in income; it provides a contrasting explanation to what we would expect. The key factor, which is positively related to profitability and revenues, is the price of wine.
Our results therefore show that the profitability of farms is rarely more important in large-scale farming concerns than in smaller ones. This association is only true when the price of wine is low. In the case of a particular zone (Cognac), the increase in profitability for large farms holds, but when the profitability of small farms is already significant. For the remaining regions of France and for low prices, the increase in profitability is high in terms of relative value but modest in terms of absolute value: the profitability levels reached by large farms are too low to allow the average revenue per unit of labor to reach the minimal legal wage in France. Accordingly, it does not seem feasible for the abolition of vine planting rights in France to impact all the categories of “sizes” and “prices”. Consequently, it would not lead to an improvement in the profitability of farms or, by extension, to an improvement in grape growers’ incomes. In short, the wine policy would not be effective.
13 GRAPH 4 - FACTORIAL CORRESPONDENCE ANALYSIS
14
4. CONCENTRATION OF EUROPEAN WINE PRODUCTION
There is another way in which to examine the potential impact of cancelling vine planting rights on grape production: we should look at the evolution of the production structures over time. One of the arguments put forward by experts supporting the suppression of vine planting rights states that vine planting rights would ‘freeze’ the production structures, preventing the expansion of farms in Europe and therefore hindering the improved profitability associated with the expansion of vineyard surface areas.
The progressive growth of farms
Eurostat data shows that, among the oldest member states of the EU, domestic vineyard surface areas decreased over the past two decades (1990-2007) by factors ranging from 35% in Portugal to between 10% and 20% in Italy and France and a little less than 10% in Greece, Spain and Germany.
Graph 5 – Average vineyard surface area by farm cultivating vines (ha)
’
Source: Eurostat – authors processing
At the same time, a considerable number of farms producing grapes disappeared entirely, or at least the farms no longer produce grapes. One of the direct consequences of the decrease in surface areas is that the average size of farms has increased considerably (see Graph 5). In France, Italy and Spain, the average size of farms in the viticulture segment almost doubled during this period.
On the evolution of regional vineyards
Consequently, while national vineyard surface areas decreased over the past two decades (and the same phenomenon was observed in many regions), we nevertheless note that in some regions, vineyard surface areas actually increased: + 40% in Extremadura, + 20% in Burgundy, Alsace and Champagne-Ardennes and +5% in Catalonia, Rioja, Castilla-y-Leon, Aquitaine, Baden-Württemberg and Friuli-Venezia-Giulia. Finally, we can also note that these ‘evolutions’ in the vineyards as well as the in every European country do not generally benefit the regions that a priori enjoy more favorable conditions for planting and developing vines.
15 In short, the persistence of a vine planting rights system in Europe appears to be compatible with vigorous growth of farm sizes while also facilitating the transfer of vine surface areas between regions, at least over the past two decades.
5. CONCLUDING REMARKS
This work has established that from a theoretical point of view the net value added per worker is a good estimator for economies of scale. Further, the use of this estimator is quite interesting as it is almost impossible to measure economies of scale directly (i.e. a decrease of average cost when the farm size increases) in agriculture due to the non-fixity of the cost of family labor.
Furthermore, this work demonstrates – at least for the French case – that the performances of farms growing grapes are only slightly influenced by their size. Differences in profitability between farms are based on differences in the selling price of wine. These differences are related to the location and the designation of origin (PDO wines), i.e. influenced by the control of the supply and its potential, the surface areas and the means used to manage vine planting rights in every country, region or PDO.
When large farms enjoy profitability higher than that of small farms, i.e., when the selling price is low, the levels of profitability reached by large farms do not avoid low incomes, at least if we take account of the legal minimal wage.
We noted that, despite the existence of regulations governing vine planting rights, European farm holdings recently enjoyed a period of considerable growth with regard to average size as well as demonstrating a change in geographic location.
Furthermore, and in order to find a solution to this problem, ceteris paribus, it is possible to expect that an increase in vine plantings will lead to market imbalances (plethora). This would lead to a negative impact on prices and therefore on the profitability of farms. Consequently, further public intervention would be required to regulate the markets and maintain grape growers’ income.
Another important point to be stressed is the need to find a balance in the markets, but this debate goes beyond the abolition of regulations governing production and trade. In summary, it would be necessary to take account of the organization of the value chains, the sharing of value-added and the means of obtaining access to the land markets.
16
APPENDIX
Sources, methods and definitions
FADN: is an annual European survey focusing on the economic data of farm holdings. Depending on the European Commission, the constraints for accessing the database are significant. In this study, we focus on the French FADN for the period covering 2005-2007. From 2008, access to the database became more complex. In order to improve the reliability of the results, we used average data for the three-year period (2005-2007) concerning the variables related to the farm holdings using a “constant sample” (i.e. using the same farm holdings available across all three years.
Eurostat: Eurostat provides results from agricultural censuses and surveys relating to the structures of agricultural farm holdings. Data is available for every country of the EU-28.
Net Value Added: it includes ‘value added’ (sales + stock variations + residual product + subsidies – intermediary consumptions) less depreciation; it is included as a proportion of annual labor. ‘Net value added’ is a good indicator of labor profitability in agricultural farm holdings.
SGM (Standard Gross Margin): this is a measure of the economic dimension of farm holdings. The regional SGM coefficient of a crop or livestock item is defined as the value of output from one hectare or from one animal less the cost of the variable inputs required to produce that output.
Types of Farming (TF): this characterizes the orientation of production at farm level according to the contribution of each crop or animal to the total SGM of the farm retained. For farms specialized in viticulture, there are 2 main types of farming (TF) in viticulture: “wines with designation of origin” and “other wines”.
Definition of quartiles For graph 2:
Division into quartiles according to the number of farms after extrapolation (number of farms represented below) ranked according to the area under vines for each one of the five categories of wine sales.
The upper limits established in hectares of vines for each quartile are defined below:
Wine price
(in €/hl) … first quartile Upper limit (in ha) of vineyard surface for … … second quartile … third quartile
0-75 13.00 17.58 25.69 75-200 9.58 16.77 26.97 200-500 7.47 11.86 20.84 500-1,000 1.90 2.88 7.24 >=1,000 2.59 4.49 6.62 together 6.94 12.61 21.60 For graph 3: Wine price
(in €/hl) … first quartile Upper limit (in ha) of vineyard surface for … … second quartile … third quartile
0-75 12.61 17.58 25.919 75-200 9.58 16.61 26.61 200-500 7.47 11.86 20.84 500-1,000 1.90 2.88 7.24 >=1,000 2.59 4.49 6.62 together 6.50 11.86 20.19
17 Graph 6 – Axis describing the multiple factor analysis
The CORRESP Procedure
Decomposition of <inertia and Khi 2
Value Inertia Per- Percent.
singul. main Khi 2 centage cumulative 3 6 9 12 15 ----+----+----+----+----+ 0.82466 0.68006 211326 14.78 14.78 ************************* 0.64686 0.41843 130024 9.10 23.88 *************** 0.55573 0.30884 95970 6.71 30.59 *********** 0.53044 0.28137 87434 6.12 36.71 ********** 0.51529 0.26553 82511 5.77 42.48 ********** 0.48963 0.23974 74497 5.21 47.69 ********* 0.47375 0.22444 69743 4.88 52.57 ******** 0.46906 0.22002 68370 4.78 57.36 ******** 0.46327 0.21462 66692 4.67 62.02 ******** 0.44891 0.20152 62620 4.38 66.40 ******* 0.44199 0.19536 60707 4.25 70.65 ******* 0.43855 0.19232 59763 4.18 74.83 ******* 0.41126 0.16914 52558 3.68 78.51 ****** 0.40127 0.16102 50036 3.50 82.01 ****** 0.38569 0.14876 46225 3.23 85.24 ***** 0.37896 0.14361 44625 3.12 88.36 ***** 0.35417 0.12544 38978 2.73 91.09 ***** 0.33889 0.11485 35688 2.50 93.59 **** 0.31778 0.10099 31381 2.20 95.78 **** 0.27492 0.07558 23487 1.64 97.43 *** 0.24776 0.06138 19074 1.33 98.76 ** 0.20453 0.04183 12999 0.91 99.67 ** 0.12314 0.01516 4712 0.33 100.00 * Total 4.60000 1429423 100.00
18 REFERENCES
Bourdon M. (1982), « Une justification par les comptes de surplus des subventions à l'agriculture », Économie rurale, n°149, Paris, 57-61.
Boussard J.M. (1973), « La notion d’économie d’échelle dans un secteur multiproduits, et l’avenir de l’agriculture », Annales d'Economie et de Sociologie Rurales, Vol.2 T.1, INRA, Paris, 25-44.
Boussard J.M. (1987), Économie de l’agriculture, Cujas, Paris.
Chandler A. and Hikino Takashi (1994) Scale and Scope: Dynamics of Industrial Capitalism, Harvard University Press.
Chavas J.-P. (2001) Structural change in agricultural production: economics, technology and policy, in Gardner B. and Rausser G. (ed.) Handbook of Agricultural Economics - vol 1, Elsevier Science B. V., New York, NY, 262-283.
Delord B. (2011), « La forte dispersion des revenus dans la viticulture française », Économie
Rurale, n° 324, Paris, 60-70.
European Commission (2008), Agriculture : CAP Health Check will help farmers meet new challenges available at : http://europa.eu/rapid/press-release_IP-08-1749_en.htm (accessed 14 April 2014).
Gleyses, G. (2007) Rendement d'échelle et économies d'échelle en agriculture, Cemagref, UMR G-Eau, Montpellier.
Institut de l’Elevage (2011), Économies d’échelle et économies de gamme en élevage bovin laitier : Analyse comparée des coûts de production et des externalités environnementales en polyculture-élevage laitier bovin par rapport aux systèmes spécialisés. Départements Économie, Actions Régionales, Techniques d’élevage et Qualité, Paris.
Marshall A. (1890). Principles of Economics (First Edition). London: Macmillan. Retrieved 2012-12-07, Chapter XI: Industrial organization, continued, Production on large scale, 232-242
Marshall E., Brossier J., Chia E., Petit M. (1997) Gestion de l’exploitation agricole familiale : Eléments théoriques et méthodologiques, ENESAD, Dijon.
Montaigne E. (1997), “The common market organisation for wine: autopsy of a reform”, in Tracy M. et al., CAP reform - The southern products, Agricultural Policy Studies, Genappe, Belgium, 41-54.
Montaigne E. and Coelho A. (2006), “The reform of the common market organisation for wine”, Report presented to the European Parliament, Policy Department Structural and Policies, IP/B/REGI/ST/2006-22, Brussels.
19 Montaigne E., Coelho A., Delord B., Khefifi L. (2012), « Etude sur les impacts
socio-économiques et territoriaux de la libéralisation des droits de plantations viticoles », Rapport d’étude, presented at the international board of AREV, Brussels, available at :
http://umr-moisa.cirad.fr/actualites/etude-sur-les-impacts-socio-economiques-et-territoriaux-de-la-liberalisation-des-droits-de-plantations-viticoles-tome-1-et-2 (accessed 22 January 2014).
Nooteboom B. (2006), “Service value chains and effects of scale”, Service Business - An International Journal, available at : http://link.springer.com/article/10.1007/s11628-006-0009-4/fulltext.html (accessed 14 April 2014)
Perrier J.-Ph. (2011) Réussir en agriculture une question de taille ou de tête, Canada, Trajet Laval, Université Laval,
http://www.mapaq.gouv.qc.ca/SiteCollectionDocuments/Regions/Monteregie-Est/AV2011_2012/Conference_Jean_Philippe_Perrier.pdf, (accessed 17 April 2014). Sardone R. (dir.), Cardinale V., dell’Aquila C., Doria P., Solazzo R., Coelho A.M., Montaigne
E., Boatto V., Dal Bianco A., Galletto L., Rossetto L., Albisu L.M., Del Rey R. Pomarici E., Diana S. (2012), « The Liberalisation of planting rights in the EU wine sector », European Parliament's Committee on Agriculture and Rural Development, Directorate general for internal policies, Policy department B: Structural and cohesion policies, 184 p. available at :
http://bookshop.europa.eu/en/the-liberalisation-of-planting-rights-in-the-eu-wine-sector-pbBA3112158/;pgid=y8dIS7GUWMdSR0EAlMEUUsWb0000UIq6g7a6;sid=DqJjPlVK PetjMQeVchb9mTdvrGEfblKZCHE=?CatalogCategoryID=d0sKABst5wEAAAEjeZEY 4e5L (accessed 22 January 2014).
Vautrin, C. (2010), « Les Droits de Plantation : Un outil éprouvé et moderne de gestion harmonieuse du potentiel viticole européen », available at :
http://agriculture.gouv.fr/filiere-viticole-catherine-vautrin (accessed 22 January 2014). Vettori G. (2003), « Economies d'échelle - Les résultats de la recherche sur le secteur bancaire
suisse », available at : http://archive-ouverte.unige.ch/unige:5801 (accessed 22 January 2014).
![[PDF] Cours java : undo redo notions de base | Cours java](data:image/gif;base64,R0lGODlhAQABAIAAAP///wAAACH5BAEAAAAALAAAAAABAAEAAAICRAEAOw==)