HAL Id: hal-00296953
https://hal.archives-ouvertes.fr/hal-00296953
Submitted on 26 Sep 2006
HAL is a multi-disciplinary open access
archive for the deposit and dissemination of
sci-entific research documents, whether they are
pub-lished or not. The documents may come from
teaching and research institutions in France or
abroad, or from public or private research centers.
L’archive ouverte pluridisciplinaire HAL, est
destinée au dépôt et à la diffusion de documents
scientifiques de niveau recherche, publiés ou non,
émanant des établissements d’enseignement et de
recherche français ou étrangers, des laboratoires
publics ou privés.
Analysis of runoff for the Baltic basin with an integrated
Atmospheric-Ocean-Hydrology Model
K.-G. Richter, M. Ebel
To cite this version:
K.-G. Richter, M. Ebel. Analysis of runoff for the Baltic basin with an integrated
Atmospheric-Ocean-Hydrology Model. Advances in Geosciences, European Geosciences Union, 2006, 9, pp.31-37.
�hal-00296953�
K.-G. Richter and M. Ebel
Consulting Engineers Dr.-Ing. Karl Ludwig, Herrenstr. 14, 76133 Karlsruhe, Germany
Received: 23 January 2006 – Revised: 22 May 2006 – Accepted: 3 July 2006 – Published: 26 September 2006
Abstract. A fully integrated Atmospheric-Ocean-Hydrology
Model (BALTIMOS = Baltic Integrated Model System) has been developed using existing model components. Exper-iment and model design has been adapted to the Baltic basin with a catchment area of approximately 1 750 000 km2. A comprehensive model validation has been completed using large meteorological and hydrological measurement database. Comparing the calculated runoff from the inte-grated and non-inteinte-grated model system with measurements for three different representative subbasins and the entire Baltic basin, the effect of the integrated model is described. The results display a good agreement between measured and calculated runoff. The effect of the integrated model is rather negligible looking at computed mean values: There is no sig-nificant difference between mean monthly runoff of the inte-grated and non-inteinte-grated model during the year with the ex-ception of spring. There is a delay of one month with regard to peak runoff for the non-integrated model in spring caused by different interactive processes during the melting period.
1 Introduction
The major task of the Baltic Sea Experiment (BALTEX) is to simulate the whole water and energy cycle of the Baltic basin and to identify important processes relevant to it.
In the project BALTIMOS (Development and Validation of a Integrated Model System in the Baltic Region), which is funded by the German government a fully integrated model system for the Baltic Sea region is developed. This is done by linking the existing model components REMO for the atmosphere (Jacob, 2001), BSIOM for the ocean and sea ice (Lehmann, 1995), and LARSIM for the hydrology (Bremicker, 2000; Richter and Ebel, 2003).
Correspondence to: K.-G. Richter
(karl-gerd.richter@ludwig-wawi.de)
In addition, a comprehensive validation of the integrated model for the Baltic Sea and its catchment area has been performed using data from a period of about two decades to achieve reliable estimates of the water and energy bud-gets for the Baltic Sea area for present climatic conditions (Richter and Ebel, 2003; Richter et al., 2004).
2 Theoretical background
Climatic modeling systems have been improved with regard to the hydrological cycle during the last years. Overviews are given by Pitman et al. (1993), Henderson-Sellers et al. (1995) and Viterbo (1996). A better understanding of the compo-nents of the hydrological cycle and the interaction between atmosphere, biosphere and the land phase of the water is described in SVATS-models (Soil Vegetation Atmospheric Transfer Schemes) (Dickenson et al., 1986; Wigmosta et al., 1994).
An improved hydrological model for describing the infil-tration and runoff generation was implemented into the cli-matic model ECHAM/REMO (DKRZ, 1994) by D¨umenil and Todini (1992); the division of rainfall in infiltration and surface runoff is coupled to an orographic factor. The cli-matic model REMO included two parameterizations for a short term and a long-term prediction, which is not effi-cient enough to describe the hydrological cycle on a regional scale. Therefore, REMO has been coupled to the water bal-ance model LARSIM. LARSIM has been developed dur-ing the first phase of BALTEX with respect to the climatic model REMO/ECHAM (Bremicker, 2000). It has been im-plemented as a grid-based hydrological model, describing the interaction of the whole water cycle between atmosphere, biosphere and land phase similar to the SVATS models. It has been verified on various scales for different basins (Weser, Danube, Neckar and Rhine).
32 K.-G. Richter and M. Ebel: Analysis of runoff for the Baltic basin
Fig. 1. Block diagram of the integrated atmospheric-hydrological-ocean model BALTIMOS.
LARSIM is a mesoscale model constructed to simulate the water balance of large river basins continuously. Not only does it incorporate the calculation of runoff generation across the land surface and translation and retention within river channels, but also the processes of interception, evapotran-spiration and water storage in the soil and aquifer as well as artificial influences (e.g. storage basins, diversions) (Fig. 1).
The flow direction of each grid element is given by one of eight possible flow directions, recognising the slope and the river system. Catchment storage is calculated for direct runoff and baseflow runoff within each grid element using parallel linear reservoir approaches.
The calculation of translation and retention in channels implemented in LARSIM is depending on channel geom-etry and roughness conditions to avoid the introduction of further calibration parameters in the water balance model. To confine the amount of calculation efforts it is assumed that consistent geometrical proportions apply for the viewed channel section, which can be described by a twin-trapezium cross-section. Furthermore, in determing the stage-discharge relationship, the discharge is presumed to be stationary and homogeneous.
The implemented channel routing uses a variable storage coefficient method developed by Williams (1969). Since no information on actual channel geometries were avail-able, channel width and depth were calculated according
Fig. 2. Baltic basin area and river routing scheme of BALTIMOS.
to the downstream hydraulic geometry theory developed by Leopold and Maddock (1953). This theory describes the in-terrelationships between dependent variables such as width, depth and area as functions of independent variables such as discharge. The exponents and coefficients in these relation-ships determined by Allen et al. (1994) were used to calculate channel geometries for the described model.
3 Model design and experiment
The model area of the atmospheric model covers a region be-tween 0 and 30 degrees East and bebe-tween 45 and 75 degrees North with a horizontal grid mesh size of 1/6 degree. The hydrological model area with a catchment area of approxi-mately 1 750 000 km2and the river routing scheme using an identical grid size is shown in Fig. 2.
The data, which are used to derive the channel network, are available on a global scale. To calculate the channel length the Digital Chart of the World (DCW, 1992) has been used. To evaluate the channel slope, the USGS height data base (USGS, 1993, 1-km resolution) has been utilized.
The experiment was carried out in 5 consecutive steps: 1. Calibration and validation of LARSIM as an existing
high-resolution hydrological model, covering the whole BALTEX land area and river network.
2. Estimation of the river runoff from the entire Baltic Sea basin using measured climatic data as an essential addi-tional information for oceanographic models.
3. Parameterization of REMO with the hydrological model LARSIM for the improved modeling of the terres-trial water regime in a high resolution atmosphere-hydrological-ocean model.
4. Determination of the river runoff from the entire Baltic Sea basin based on calculated climatic data for a 20 year period.
Fig. 3. Daily (left side) and monthly (right side) simulated and measured discharge at the gauges Raktfors/Thorne (top), Riga/Daugava (middle) and Hohensaaten/Odra (bottom) (Legend left side: blue line = measured runoff, red line = calculated runoff).
5. Calculation of the river runoff from the entire Baltic Sea basin using calculated climatic data within the inte-grated atmospheric-hydrology-ocean-model for a three-year period.
4 Results
In order to calibrate and validate the components of the ter-restrial hydrological cycle, three different test catchments were chosen, which represent the different meteorological and hydrological characteristics of the BALTEX basin: the Thorne basin (78 000 km2), representing the hydrology of the cold climate, the Odra basin (109 000 km2), representing the hydrology of the continental climate, and the Daugava basin
(84 000 km2), representing the hydrology of a mixed climate (Fig. 2).
4.1 Validation of the hydrological model with measured meteorological data
For the three representative basins and the total Baltic basin meteorological data such as temperature, relative humidity, sunshine duration, wind measurements (about 2000 stations) and rainfall (about 4500 stations) and runoff measurements were available for a period from 1996 to 2000. These data were used for the calibration and validation of the hydro-logical model LARSIM. During the calibration process, the model parameters were adjusted aiming at an optimum fit of simulated versus measured discharge. The time step for all
34 K.-G. Richter and M. Ebel: Analysis of runoff for the Baltic basin
Fig. 4. Total mean monthly runoff to the Baltic Sea.
calculations is one day. Results of the calibration are shown in Fig. 3. The validation was performed comparing daily and monthly discharge.
The daily values of discharge at the gauge Rakt-fors/Thorne show an underestimation of calculated peaks in spring. During the other time of the year, the simulated runoff corresponds well with the measured runoff. Addition-ally, the calculated values of mean monthly runoff sort well with the respective measured values. Minimal values for dis-charge are computed during winter and early spring.
For the gauge Riga/Daugava daily values of discharge were available until the end of 1997. The measured runoff is influenced by river regulations. There is a good general agreement between simulated and measured runoff. During the winter however, the runoff is overestimated by the simu-lation.
At the gauge Hohensaaten/Odra, the quality of the simu-lated runoff is the highest among the three basins. Further-more, it is notable that the major flood event during the sum-mer of 1997 is simulated quite well. There is also a good agreement between simulated and measured runoff with re-spect to mean monthly values.
Based on the parameter evaluation of these three represen-tative basins, the model parameters were used for the com-parable regions of the entire Baltic basin.
In Fig. 4 the mean monthly simulated runoff for the total Baltic area for a time period from 1996 to 2000 is compared to the estimated runoff. The mean monthly estimated runoff has been prepared by the Swedish Meteorological and Hy-drological Institute (SMHI) using a combination of runoff measurement and model-output from hydrological models for regions where measured data has not been available. There is a good agreement between the estimated measured and calculated runoff.
Hence, the hydrological model LARSIM is able to de-scribe the hydrological processes of the different regions of the Baltic basin and their different hydrological characteris-tics well.
Fig. 5. Yearly total accumulated runoff (estimated and simulated).
Fig. 6. Mean monthly rainfall (measured and simulated).
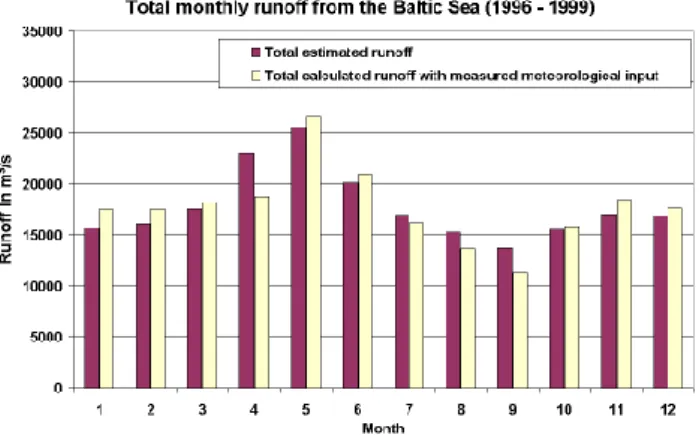
4.2 Validation of the hydrological model with REMO Input The runoff components of the non-integrated model were compared to measurements by using the meteorological out-put from the atmospheric model (i.e. temperature, wind, pressure, relative humidity and rainfall) as input in the hy-drological model LARSIM. This comparison had the goal to analyse the different cumulative effects of measured versus calculated meteorological input data on the resulting runoff. The calculated runoff is compared to estimated runoff for two decades (1980–2000) (Fig. 5). There is an overestimation of the calculated total runoff in comparison with the estimated total runoff over the whole period of about 10 to 15 percent. In Fig. 6, the total mean monthly rainfall (measured and simulated by REMO) for two different periods (1980–2000 and 1996–2000) is displayed. Measured values have been corrected using the Sevruk method (Sevruk, 1991). There is a typical variation of rainfall during the year with a maximum in June and a good agreement between the mean monthly measured and calculated rainfall between 1996 and 2000 with the exception of March, April and May. The total mean monthly runoff to the Baltic Sea is shown in Fig. 7. There is a good correspondence of the total mean monthly calculated runoff to the mean monthly measured runoff, except in May
Fig. 7. Long-term mean monthly (measured and simulated) runoff (period 1980 – 2000).
and June. In these two months a significant overestimation of the calculated runoff can be observed, possibly caused by an overestimation of snow depths during the winter months resulting in too much snowmelt in May and June.
4.3 Validation of the integrated and non-integrated model Runoff has been calculated with the integrated (IM) and non-integrated (NIM) model system and subsequently compared to measurements. Using the integrated model should lead to a better understanding of hydrological processes within atmospheric models and improve overall results.
When the calculations were performed with the non-integrated model, the two runoff components of REMO were routed using the LARSIM routing scheme offline. When us-ing the integrated model, the three model components (atmo-sphere, hydrology and the ocean model) were joined in one single program to be run together.
In Fig. 8 the mean monthly runoff for the representative basins Thorne, Daugava and Odra for the period from 1999 to 2001 (for the Daugava only up to 2000) calculated with both model systems is compared.
At the gauge Raktfors/Thorne, an overestimation of runoff during January to March and in May using the non-integrated model can be largely reduced with the integrated model. Be-tween June and November there is a good agreement be-tween the mean monthly measured and calculated runoff val-ues with both IM and NIM model runs. The yearly variation of the mean measured and calculated monthly values is low in both simulations. The mean monthly simulated runoff val-ues are about 10% higher than the measured valval-ues.
At the gauge Riga/Daugava runoff values from both simu-lations are overestimated significantly throughout the months of January to March. During the rest of the year, the runoff measurements and calculated runoff values with both sys-tems are very similar. During the winter and spring peri-ods, there are small differences between the IM and NIM mean monthly runoff simulation values. In summer, mean monthly runoff simulation values with the IM are higher than
Fig. 8. Mean monthly (measured and simulated) runoff for the inte-grated and non-inteinte-grated model for the three representative basins.
those of the NIM, caused by more interaction of atmosphere and ground during weather situations which are dominated by ground-heating (convective weather situations).
At Hohensaaten/Odra, the calculated runoff values of both model runs are close to the measured ones for the entire year, with an underestimation for both simulation methods in Jan-uary and from April through December. In FebrJan-uary and March, a slight overestimation of the mean monthly simu-lated runoff can be detected.
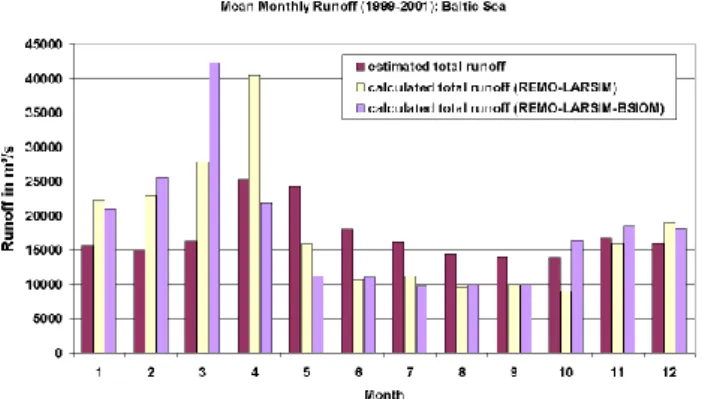
The results for the total measured and calculated mean monthly runoff are shown in Fig. 9. Runoff is overestimated during winter, with a maximum in March (IM) and April (NIM), and underestimated during summer. The effect of
36 K.-G. Richter and M. Ebel: Analysis of runoff for the Baltic basin
Fig. 9. Mean monthly (measured and simulated) total runoff for the integrated and non-integrated model.
using the integrated model versus the non-integrated model to simulate runoff is rather small throughout most months of the year, with an exception in spring. There is a delay of one month in the runoff peak for the non-integrated model in spring, which is caused by different interactive processes during the melting period.
5 Conclusions and outlook
The integrated BALTIMOS system has been validated in de-tail. The model validation shows that the hydrological model LARSIM is able to describe the hydrological processes of the different regions of the Baltic basin and their different hydrological characteristics well.
By using the meteorological output of REMO as input for the hydrological model LARSIM the calculated runoff can be used as an integrating indicator for the influence of REMO meteorological data to runoff, without comparing simulated meteorological parameters to measured meteorological pa-rameters in detail. The results show an overestimation of runoff from 10 to 15% on a long term period (1980–2000), caused by an overestimation of precipitation within REMO.
Comparison of the results of the integrated BALTIMOS model system and the non-integrated model for a three-year period show only a small difference between mean monthly runoff values with the exception of spring. There is a delay of one month in the runoff peak for the non-integrated model in spring caused by different interactive processes during the melting period.
Looking ahead, it is expected that rainfall simulation will be improved within atmospheric models. This is a prereq-uisite for enhanced results in runoff simulation within inte-grated models.
Acknowledgements. The authors thank the Swedish
Meteorologi-cal and HydrologiMeteorologi-cal Service SMHI) for preparing the runoff data (BALTEX RUNOFF DATA CENTER) and the German Weather Service DWD (BALTEX DATA CENTER) for providing the meteorological data.
Edited by: R. Barthel, J. G¨otzinger, G. Hartmann, J. Jagelke, V. Rojanschi, and J. Wolf
Reviewed by: anonymous referees
References
Allen, P. M., Arnold, J. G., and Byars, B. W.: Downstream channel geometry for use in planning level models, Water Resour. Bull., 30, 4, 663–671, 1994.
Bremicker, M.: Das Wasserhaushaltsmodell LARSIM-Modellgrundlagen und Anwendungsbeispiele, Freiburger Schriften zur Hydrologie, Band 11, 2000.
Dickenson, R. E., Henderson-Sellers, A., Kennedy, P. J., and Wil-son, M. F.: Biosphere-atmosphere transfer scheme (BATS) for the NCAR Community Climate Model. Tech. Note NCAR/TN-275+STR, Nat. Cent. for Atmos. Res., Boulder, Colorado, 1986. DCW: Digital Chart of the World , Edition 1, Defense Mapping
Agency, Fairfax, USA, 1992.
DKRZ: The ECHAM 3 Atmospheric General Circulation Model, Deutsches Klimarechenzentrum, Technical Report No. 6, Revi-sion 3, July 1994, Hamburg, 1994.
D¨umenil, L., Todini, E.: A rainfall-runoff scheme for use in the Hamburg climate model, in: Advances In Theoretical Hydrology, A tribute to James Dooge, European Geophysical Society Series on Hydrological Sciences, 1, Elsevier, 129–157, 1992.
Henderson-Sellers, A., Pitman, A., and Love, P. K.: The Project for Intercomparison of Land-Surface Parameterisation Schemes (PILPS: Pase 2 and 3), Bull. Am. Meteor. Soc., 94, 489–503, 1995.
Jacob, D.: A note to simulation of the Annual and Interannual Vari-ability of the Water Budget over the Baltic Sea Drainage Basin, Meteorol. Atmos. Phys., 77, 1–4, 61–74, 2001.
Lehmann, A.: A three-dimensional baroclinic eddy-resolving model of the Baltic Sea, Tellus, 47A, 1013–1031, 1995. Leopold, L. B. and Maddock Jr., T.: The hydraulic geometry of
stream channels and some physiographic implications, Geolog-ical Survey Professional Paper 252, United States Goverment Printing Office, Washington, 1953.
Pitman, A. J., Henderson-Sellers, A., Abramopoulos, F., Avissar, R., Bonan, G., Boone, A., Dickinson, R. E., Ek, M., Entekhabi, D., Famiglietti, J., Garratt, J. R., Frech, M., Hahmann, A., Koster, R., Kowalczyk, E., Laval, K., Lean, J., Lee, T. J., Lettenmaier, D., Liang, X., Mahfouf, J.-F., Mahrt, L., Milly, P. C. D., Mitchell, K., de Noblet, N., Noilhan, J., Pan, H., Pielke, R., Robock, A., Rosenzweig, C., Schlosser, C. A., Scott, R., Suarez, M., Thomp-son, S., Verseghy, D., Wetzel, P., Wood, E., Xue, Y., Yang, Z.-L., and Zhang, L.: Project for Intercomparison of Land-Surface Pa-rameterization Schemes (PILPS), Results from off-line control simulations, GEWEX Report, IGPO Publication Series No. 7, 1993.
Richter, K.-G. and Ebel, M.: Analysis of the Water Cycle of the Baltic Area under present and future Conditions, German