HAL Id: insu-00800689
https://hal-insu.archives-ouvertes.fr/insu-00800689
Submitted on 3 Apr 2013HAL is a multi-disciplinary open access archive for the deposit and dissemination of sci-entific research documents, whether they are pub-lished or not. The documents may come from teaching and research institutions in France or abroad, or from public or private research centers.
L’archive ouverte pluridisciplinaire HAL, est destinée au dépôt et à la diffusion de documents scientifiques de niveau recherche, publiés ou non, émanant des établissements d’enseignement et de recherche français ou étrangers, des laboratoires publics ou privés.
Coastal chalk cliff erosion: experimental investigation on
the role of marine factors
Jérôme Brossard, Anne Duperret
To cite this version:
Jérôme Brossard, Anne Duperret. Coastal chalk cliff erosion: experimental investigation on the role of marine factors. Geological Society of London. Coastal Chalk Cliff Instability, Geological Society of London, pp.109-120, 2004, Engineering Geology Special Publications 20, �10.1144/GSL.ENG.2004.020.01.08�. �insu-00800689�
Coastal chalk cliff erosion: experimental investigation on the role of
marine factors
Jérôme Brossard and Anne Duperret
Laboratoire de Mécanique, Physique et Géosciences, Université du Havre, 25 rue Philippe Lebon, BP
540, 76058 Le Havre cedex, France.
E-mail address of the corresponding author: brossard@univ-lehavre.fr number of words of text : 6738
number of references : 33 number of tables : 1 number of figures : 16
abbreviated title : Marine factors of cliff erosion
Abstract : In this paper the marine factors of erosion contributing to the chalk cliffs located on either
side of the English Channel are examined. From an analysis of the literature, the main physical phenomena determining the marine erosion of the shore platform and the foot of the cliff are drawn. Field observations of the coastal chalk cliff show that the vertical erosion of the shore platform does not appear to be the main cause of cliff erosion which is mainly governed by cliff collapse processes. To estimate the impact of waves on the base of the cliff experiments were carried out in a wave flume. The pressure due to the waves and the dissipation of waves were measured for three simple configurations of the boundary conditions between the cliff and the sea. The pressure never exceeded the compressive strength of chalk rock. Nevertheless, pressure fluctuations due to periodic waves can induce a fatigue process within the fracture structures.
The experimental results showed that the shingle by itself has a low effect on wave energy dissipation. The main effect of shingle is to reduce the water depth at the toe of the cliff. Furthermore, it is demonstrated that a lower water depth leads to a lower impact of the waves on the cliff.
______________________________________
The French and English chalk cliff coastline located on either side of the English Channel retreats with a mean recession rate varying between 0 and 0.7 m/year (May 1971 ; Costa 2000). However the erosion is not uniform with time, but occurs by sudden collapse that may induce a cliff
retreat of 10-20 m in one event. A European scientific project named ROCC (Risk Of Cliff Collapse) has therefore been launched involving the coastlines of Upper-Normandy and Picardy in France (120 km long) and East-Sussex in the UK (40 km long), in order to identify the critical parameters leading to coastal cliff collapses in chalk rock (fig. 1).
The stability of coastal chalk cliffs is governed simultaneously by both subaerial and marine processes, as well as the mechanical characteristics of the rock (lithology, fracture pattern). The evolution of the cliff, from stability towards failure, depends on changes occurring within the rock mass, such as the development and opening of fractures (resulting from stress relief, fatigue, wetting and drying, freeze-thaw action) and the deterioration of the rock material as a result of the infiltration of water (resulting in solution, chemical alteration, physical breakdown through freeze-thaw or salt crystallisation). These internal changes in the rock mass are brought about through external agencies of meteorological origin (including rain, wind, frost, drought), removal of stress constraints at the cliff face and of marine origin (including wave action, tidal conditions, the presence or absence of deposits at the cliff toe, vertical erosion of the shore platform) (Duperret et al., 2002).
Some authors have suggested that rock material strength subjected to subaerial processes is the main mechanism of sea cliff erosion, such as the Californian calcareous coast (Benumof et al. 2000) or along the English Channel chalky coast (Duperret et al. 2002). The marine parameters, such as wave impact factors appear as a secondary mechanism of sea cliff erosion. Nevertheless Benumof et al. (2000) suggest that wave energy distribution may be important in determining the timing of cliff collapse events. The role of marine parameters needs to be specified more closely in such geological contexts. The aim of this paper is to study the contribution of marine factors on coastal chalk cliffs erosion, using experimental investigations focus on pressure wave measurements on a wall/cliff and wave attenuation through sediments located at the toe of the wall/cliff.
Chalk cliffs geomorphology
Coastal chalk cliff exposures along each part of the English Channel are composed of nearly vertical cliffs ranging from 20 to 200 m high and the foreshore area is often a chalky seaward beach platform with a low slope. The foreshore area exposes a flat beach platform made of eroded chalk or hardground levels with a higher material strength than chalk. In some places, the beach platform is
partially covered by a thin veneer of sand and by shingle accumulation composed of smooth flints, whose distribution is somewhat discontinuous along the coastline. The shingle accumulations are always located in the upper part of the foreshore area at the toe of the cliff (fig. 2), whereas sand cover may extends seaward to low tide level. Such sand cover is transitory, readily resuspended and may be absent under storm conditions (D.J. Pope, pers. com.).
Chalk cliffs geomorphology is a type of foreshore often referred as a wave cut platform (e.g. Sunamura 1977, 1992 ; Robinson 1977) . Marine parameters of chalk cliff erosion may act on the shore platform, by vertical erosion and on the cliff face, by horizontal recession.
Marine parameters on the shore platform
The shore platform erosion results from subaerial weathering and wave action. The two main weathering processes are salt weathering and water layer weathering (Stephenson & Kirk 2000, part II). The salt effects refer to the expansion in volume due to the growth of salt crystals and their subsequent hydration, which can induce high pressure in the cracks of the platform (Cooke & Smalley 1968). The water layer weathering is associated with the wetting and drying process during the tidal cycle and can induce a superficial disintegration of the rock (Trenhaile 1987). Stephenson & Kirk (2000, part II) have evidenced that the highest rate of shore platform erosion occurs between 0.6 and 0.9 m above mean sea level which, they argue, suggests that shore platform erosion results mainly from weathering caused by repeated wetting and drying. Weathering processes may be accentuated by living organisms such as micro-organisms, boring organisms and grazing organisms (Trenhaile 1987 ; Spencer 1988 ; Sunamura 1992), which can play a double role firstly by building some specific morphologies and secondly by enhance morphological denudation rates due to other geomorphological processes (Fornos et al. 2001).
According to Sunamura (1977, 1992) and Trenhaile (1987), the primary agent of shore platform development is deduced from the relative intensity of two forces : the erosive force of waves and the lithology-related resistance. The erosive force of waves is due to the bed shear stress and to the dynamic pressure. Sanders (1968) proposed that breaking wave shock, water hammer and air compression in joints are the main causes of erosion on the shore platform. Stephenson & Kirk (2000, part I) suggested that erosion by waves can only occur when waves break on the shore platform, and the depth of water in front of platforms therefore appears to be an important control on wave energy
arriving on platforms. But, generally, the erosion induced by the bed shear stress and the pressure is very much lower than the erosion induced by the abrasion phenomenon. The abrasion is due to the sand, rock fragments or shingle produced by the erosion itself. Sunamura (1977) has developed a model of temporal evolution of erosion taking account of this phenomenon. Nevertheless, vertical erosion is of greatest concern for soft cohesive sediments and soft rocks (Davidson-Arnott & Ollerhead 1995 ; Skafel & Bishop 1994).
Along the cliffed coastlines, the ratio between the mechanical resistance and the marine stresses for the platform is, everywhere, very large. Along chalk coasts of the Channel, the vertical erosion of the shore platform does not appear to be the main cause of cliff recession, which is mainly governed by cliff collapse processes. After a collapse, a lobate deposit made of large pieces of chalk coming from the cliff expands on the shore platform. In this case, waves have an effect on the alteration of chalk blocks which result from cliff collapses.
Marine parameters at the cliff base
Marine processes acting at the base of the cliff are also closely linked to the water depth and therefore vary significantly in macro-tidal contexts. A large number of authors have argued that wave action is the main parameter of coastal cliff erosion, by wave-attack processes at the toe of the cliff (e.g. Sanders 1968 ; Sunamura 1977 ; Robinson 1977 ; Hoek & Bray 1977 ; Mc Greal 1979 ; Sunamura 1982). Wave action consists of (1) hydraulic action such as compression, tension, cavitation and wear, (2) abrasive action due to pebbles and boulders in motion by wave action, (3) wedge action due to the air compressed in fissures by waves. Erosion occurs when the assailing forces from waves are higher than the resisting force of the rocks. Even if the resisting force of the rocks is controlled by their mechanical properties and their structure (such as joints and stratification), the deterioration of the resisting force is brought about by weathering and fatigue due to the repeated stresses generated by wave action (Sunamura 1977).
Along the coastline, three main cases of wave impact may occur : (a) wave breaking on the shore platform, (b) wave reflection at the cliff face without breaking, (c) wave breaking impact directly on the cliff face.
(a) when waves break on the shore platform, initially a rapid flow occurs and a large part of the potential energy is transformed into kinetic energy. If the flow reaches the foot of the cliff and if some pebbles, shingle or sand are available on the beach, the abrasion induced by the removal of sediments during the swash may produce a slight basal notching at the cliff base. In the case where no sediments are available, weathering by salt and by repeated drying and wetting processes during the tidal cycle may also induce slight peeling of the chalk surface. Field observations along the Channel chalk coastline have found basal notching in only a few places, with a maximum undercutting of about 0,5-1m (fig. 3a).
(b) when waves are reflected at the cliff face without breaking, the maximum variation of the wave pressure on the cliff is very low, in the order of 2gH where H is the wave height. For example, for a
wave of H = 5m the variation of pressure is of the order of 1.1 MPa and, in most cases, it never exceeds the compressive strength of wet chalk rock (1 to 20 Mpa, for chalks dated from Turonian to Senonian) (pers. comm. CETE 1980). The highest impact pressures was recorded by Rouville(1938) on a prototype sea wall at Dieppe in France, with a magnitude of 610 kPa (Wolters and Müller, this issue), that is always lower than the compressive strength of wet chalk rock.
The occurrence of storm surges increases the absolute pressure, because the increasing of the still water level, but has a limited effect on the variation of the pressure. Nevertheless, the repeated cycles of wave pressure may generate processes of fatigue within the cracks of the rock. In the case of large cracks, Peregrine & Kalliadasis (1996) have demonstrated that the filling flow may induce an especially large pressure in cracks, leading to a large tensile stress in the rock itself and higher susceptibility to fatigue processes. Such processes may occur on a chalk cliff coastline, within caves of several meters in height and 1 - 2 m in depth, which may develop at the base of the cliff along large-scale fracture structures (fig. 3b).
(c) the last type of wave-impact occurs when waves are breaking directly on the cliff face. It is the so-called “perfect breaking” (Kirkgöz 1991, 1995). Perfect breaking appears when the breaker has a perfect vertical face and strikes a vertical wall. In only this case is the greatest wave impact pressure produced. The pressure is greater by one or two orders of magnitude than the wave pressure without perfect breaking (i.e. 1 to 20 Mpa) on the cliff face and the pressure values may reach the compressive strength of the weakest wet chalk rock. The pressure profile on the wall shows a large peak but with a very short duration of a few milliseconds.
From experimental studies in a wave flume, the highest impact pressures occur with a foreshore slope of 1/10 in front of the cliff (Kirkgöz 1982). The maximum impact pressure probability in a flume follows a log-normal distribution. The maximum pressures are reached for a wall with a slope angle varying between 10° and 30° and occur most frequently just below the still water level. For any given wave conditions there is a critical value of the water depth at the wall, dwm, for which perfect breaking occurs
(Kirkgöz 1991). To analyse the effect of wave breaking on a cliff it is necessary to know the water
depth at the foot of the cliff. The empirical relation : [(1 0.3tanh(20H /L )] 78
. 0
H
dwm 0 0 0 where H0 is
the wave height and L0 the wavelength in the offshore zone gives the height of the waves which could
just break on the front of the cliff (Kirkgöz 1995). As noted by Kirkgöz (1995), perfect breaking obtained during laboratory experiments shows variations in the magnitude of impact on which the unevenness of waves in the natural environment must be added. Consequently a wave height band can be defined for which perfect breaking can occur, in a probabilistic sense, and this band is determined by the water depth at the foot of the cliff.
The Channel coastlines are subjected to macro tidal effects, with variations of 0.1 to 10 m in water height. Observations in the field have shown that sea water level at high tide does not always reach the base of the cliffs. For these reasons, the frequency of violent wave impacts with perfect breaking seems to be low along the cliffs of the Channel, even if this frequency may increase during periods of both storms and spring tides.
Where cracks occur at the base of the cliff, they can be filled by sea water during the high tide. The propagation into cracks of impact pressures due to wave breaking may occur when cracks are filled by water. From experimental modelling on water filled cracks, Müller (1997, 1998), demonstrated that the magnitude of the pressure peak decreases during the propagation into the crack and that the propagation velocity is finite. In fact, the celerity is very dependant on the dissolved air. Additional experimental work on cracks has shown that partially submerged cracks show a faster propagation of wave impact pressure (300 m/s) than fully submerged cracks (50-100 m/s) and without significant attenuation (Wolters & Müller, this issue).
The short duration of the peak pressure and the finite celerity induces a phase difference between the peak pressure at the crack entrance and the end of the crack and this may lead to dislodgement of a piece of rock at the front of the cliff (Müller 1997)
The base of the chalk cliffs of the Channel shows numerous types of vertical fracture pattern, with various apertures and persistence, such as open master joints with a persistence all over the cliff height and open isolated joints with a persistence of several meters from the base of the cliff. Normal and strike-slip faults may also extend over the full cliff height, but they are often filled by clays and are consequently closed, except in the case where a cave develops at the base of the fault (fig. 3b) (Genter et al. 2001). Open fissures may also develop horizontally along hardground levels or marl seams within the chalk cliff (fig. 3c).
The presence or the absence of shingle on the beach platform has an effect on the dissipation of waves and therefore on cliff erosion. The dissipation of energy is related to the roughness of the shingle beach and to the momentum transfer from flow to the cobbles. However, another effect of shingle is to decrease the water depth at the base of the cliff and as suggested by Kirkgöz (1995) and Stephenson & Kirk (2000, part I), the water depth above the platform is the main parameter controlling erosion.
To investigate this assumption and to further understand the role of marine factors on chalk cliff erosion, experiments were carried out in a wave flume. To take into account the large diversity of morphological conditions observed along the Channel, three simple configurations of the boundary conditions between the cliff and the sea have been tested. They have been selected from the natural configurations of the chalk cliffs observed on each side of the Channel. Their behaviour was compared through measurements of the pressure on a wall modelling the cliff, the wave reflection characteristics and the dissipation of wave energy.
In such experimental work it is necessary to measure, with high accuracy, the wave characteristics ;
these are the period T or the angular frequency
T
2
, the wavelength or the wave number
2
k
, the direction of propagation or the sign of the celerityk
T
C
and the amplitude A or the wave heightH
2
A
.Method of wave measurement in the flume
The method of wave measurements (Brossard et al. 2000) allows an accurate measurement of all regular modes propagating in the wave flume. Each mode has its own celerity. If the level of the free surface is recorded by a moving probe (fig. 4) with a fixed speed V, the signal is shifted by the Doppler effect (Brossard et al. 2000). In the spectrum of the signal, for any mode, the frequency is different from that obtained with a fixed probe. The Doppler shift has a negative value if the probe is moving towards the direction of propagation of the mode and has a positive value if the probe is moving against the direction of propagation. Nevertheless the Doppler shift method is applicable to conditions where the wave celerity maintains a constant value, consequently the measurements must be carried out upstream or offshore of the sand accumulation where the water depth is constant. This method enables measurement of the amplitudes of the fundamental incident and reflected modes and subsequently the reflection coefficient. Concerning the higher harmonics; there are two kinds of harmonics travelling in a wave flume. Non linear modelling of the free surface provides a description of this by the sum of sinusoidal components (Stokes model components) so-called “phase locked modes” because these modes have the same celerity as the fundamental mode. Furthermore, even if the wave generator produces a regular wave (only one angular frequency corresponding to the fundamental mode), the non linear interaction between the gravity waves and a beach, a breakwater or a wall, produces higher harmonics (free modes) by transference of energy from the fundamental mode to higher harmonics. However, for the free modes the harmonic celerity is not dependant on the fundamental mode celerity ; their angular frequencies are a multiple of the fundamental one but their wave numbers are not multiples of the fundamental mode. The wave numbers of the free harmonics follow the dispersion relationship of the fundamental mode. Consequently the Doppler shift is different to that of the phase locked modes although they have the same angular frequencies. The frequency peaks are separated in the spectrum and the discrimination of the phase locked modes and the free modes allows the generation of harmonics to be quantified and non linear interactions between the waves and sediment accumulation to be analysed.
Experimental set up
The cliff was modelled by a vertical, impermeable wall and the beach platform by an impermeable surface with various gradients. Three configurations were modelled :
(1) a flat smooth foreshore area, without shingle or fresh deposits of debris, (2) a sloping smooth foreshore area with 1/20 slope, without shingle cover and (3) a sloping (1/20) foreshore area with shingle cover (fig. 5).
Each configuration was subjected to various levels of water, which represented the tidal effect.
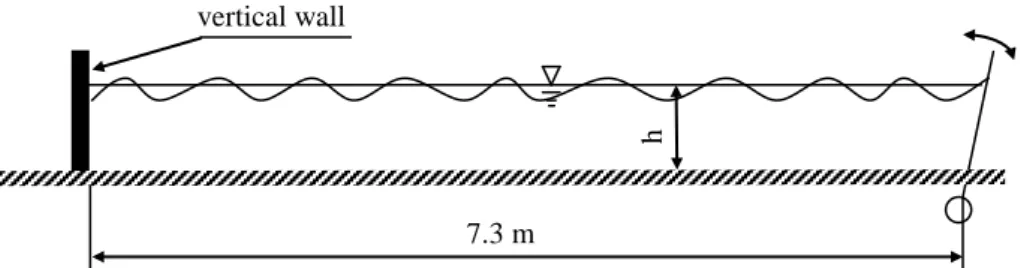
The experiments were carried out in a regular wave flume 0.3 m wide. The wave generator was an oscillating paddle driven by an electrical motor. The generated waves were regular with a 2nd free harmonic amplitude less than 4% of the fundamental amplitude. At the downstream end, the vertical wall was located at 7.3 m from the paddle (fig. 5).
The shingle was modelled by sand in these experiments. The sand had a narrow particle size distribution with a mean grain size of 0.4 mm. At a geometric model scale of 1/60, the Froude scaling law indicates a corresponding in situ shingle size of 24 mm. This size average is closely representative of the natural shingle of the Channel coastline. The Froude similarity law is well adapted for sea hydrodynamic problems because it represents the scaled ratio between the gravitational force and the inertial force. Nevertheless this similarity law leads to a lower porosity effect at model scale than in situ. The sediment thickness above the slope bed was 0.05 m (fig. 5) corresponding to a 3 m high natural beach. As sediment accumulation extended over a length of 1.2m in the flume, the remaining length for wave measurements, at constant depth, was 6.2 m long.
The tidal effects were modelled by varying the water depth in the range [0.07 m – 0.15 m] in the off-shore horizontal section corresponding to [4.2 m – 9 m] in situ. For all experimental runs the wave period was 0.79 s corresponding at a wave period of 6.12 s in situ. The dispersion characteristics in the flume resulted in a wavelength varying in the range 0.6 m for a water depth of h = 0.07 m to 0.8 m for a water depth of h = 0.15 m. The wave amplitudes were adjusted to avoid wave breaking within the offshore section and to limit the non linear effects associated with the closed geometry of the flume. In all experiments, wave breaking occurred above the sediment accumulation.
Pressure measurement at the vertical wall.
The intention was to estimate the stresses induced by non-breaking waves on the cliff face. The pressure profile at the front of the vertical wall was measured, using six pressure transducers. The measuring range of these sensors was [0 – 104 Pa] with an active sensor area of 12 mm diameter. The variation of the pressure at the front of the vertical wall in the flume was small in comparison to
the pressure range of the sensors used, but to achieve a significant increase in sensitivity would have required a sensor too large in relation to the spatial resolution required. The experimental conditions were not that of perfect breaking ones, consequently there were not transitory effects like rapid peak pressures. The frequency of the signal was the wave frequency (1.27 Hz) and this value was very low in relation to the ability of the sensors. To improve the accuracy of the measurements all transducers were calibrated frequently using a parabolic calibration relationship. Such measurements enabled the response of the cliff to be followed to stresses induced by the repeated pressure variation during tidal cycles.
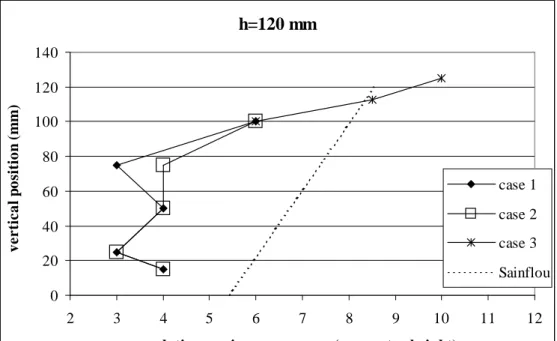
The pressure measurements have been carried out at two water depths (h = 0.150 m and h = 0.120 m) which correspond to high tide and low tide. At each of these two water depths the three cases of shore platform morphology have been examined. In the next sections the results obtained are compared with the Sainflou model (Sainflou 1928) that predicts the pressure field on a vertical wall. Table 1 gives the amplitude of the incident waves for each experiment.
Two sets of values have been extracted from the pressure measurements : the maximum value of the pressure and the amplitude of the pressure oscillations due to the periodic waves. Information about the maximum pressure is useful for studying the behaviour of the cliff by a comparison with the resisting force of the chalk rock. The amplitude of the pressure oscillations is an important parameter to enable analysis of the fatigue stress phenomenon at the front of the cliff or directly on the shore platform.
Maximum pressure
In figures 6 and 7 plots of the relative (in relation to the hydrostatic pressure) maximum pressure along the wall are presented. At high tide, h = 0.150 m in the flume, the relative water depth, defined as the distance between the mean sea level and the bed at the cliff toe, is large. The pressure plots are similar for all three cases and agree well with that of Sainflou model (fig. 6). When the water reaches the cliff face during high tide level, the pressure induced by the waves on the cliff are similar for each geomorphologic situation. In fact, the occurrence of sediment accumulation at the toe of the cliff does not induce perturbation of the wave impact on the cliff, if the sediment accumulation is well covered during high tide.
At low tide, h = 0.120 m in the flume and for case 1 and 2 (horizontal and sloping smooth beds) the pressure distributions are similar and only differ slightly from the Sainflou model although there is probably some drift of the zero pressure reading of the sensors (fig. 7). For case 3 (sloping shingle beach) the pressures are higher than both the previous ones. In this case the relative water depth is small but the sea level can reach the vertical wall with a rise of the mean sea level due to the occurrence of sediment accumulation. This rise therefore induces an increase in pressure at the toe of the cliff. Nevertheless, the measured pressure values at low tide (28 Pa-100 Pa) are lower than pressure values measured during high tide (70 Pa-130 Pa).
Pressure fluctuations
The amplitude of the pressure variations recorded on the wall for each case are compared with each other and with the Sainflou model at both high tide (fig. 8) and low tide (fig. 9). For each case, the amplitude of the pressure variations are lower than for the Sainflou model. This result cannot be related to a zero drift of the sensors because the amplitudes of pressure oscillations are calculated by difference between the maximum pressure and the minimum pressure. It can be explained by a dissipation effect because the Sainflou model assumes the fluid as inviscid. Nevertheless, for the two tide conditions, the pressure variations are higher for the sloping bed (case 2) than for the horizontal bed (case1). For an equivalent vertical position of the sensor, pressure variations for the sloping bed with sediment (case 3) are lower than for the sloping bed without sediment (case 2) ; this result can be explained by a larger dissipation with shingle present. The last recorded value for case 3 in figure 9 is drastically lower than the previous one at low tide (fig. 8) ; this lower value is due to the fact that the sensor is not covered with water throughout all of the wave period.
Comparisons between the three cases do not indicate large amplitude variations in pressure on the vertical wall. A gently sloping shore platform favours higher pressure variations on the cliff face than a flat shore platform because of a shoaling effect, whilst sediment accumulation on a gently sloping shore platform seems to decrease the pressure variations on the cliff face. For this last case, the dissipation effects due to the bottom shear stress and the breaking of waves are more important than the shoaling effect.
Morphology of the beach profile (case 3).
Waves were generated in the flume for the equivalent of half a tide (about 6 hours in situ) to analyse the behaviour of the shingle beach. The evolution of the sand modelling the shingle was recorded by means of a video camera.
At a tidal time scale, the mean section of sediment accumulation is stable, with a slope of about 1/20, which is significantly below the accepted equilibrium value of 1/10 (Dean 1977), under such conditions. As experiments were performed in a wave flume and not in a basin, only the cross-shore sediment transport was observed. At smaller scale, the sediment accumulation shows several morphological characteristics, such as bars, ripples and scouring.
At higher water depths, during high tide, when the water reaches the vertical wall, the reflected waves interfere with the incident waves and lead to the formation of a set of nodes and anti-nodes within the water oscillations at sea bed level. This induces sediment transport and the formation of transverse bars whose wavelength is about half that of the free surface propagating waves. These bars have a beneficial effect on cliff erosion by increasing wave reflection and, consequently, by decreasing wave energy arriving at the cliff front.
The second effect is the development of superficial ripples with a wavelength of about 30 mm. This wavelength is related to water depth and is a classical phenomenon with bed sediments and an oscillating flow (Fredsoe & Deigaard 1992). But in situ this phenomenon has not been observed with shingle. Such differences may be due to the model sediment density and size, which are not ideally suitable for simulating shingle transport at this scale.
At high tide the wave impact on the vertical wall produces a very high vertical velocity, inducing scour of the sediment at the toe of the vertical wall. At mid-level of the ebb tide during the following tidal cycle, the scour hole is re-filled as the wave-breaking zone migrates seaward across the sediment, thus inducing significant sediment transport (fig. 10 a-b). At the end of the ebb tide, a bank or berm is formed at the top of the sediment.
The experimental investigation show that shingle berms located at the cliff toe are temporarily removed seaward at high tide. This fact may be increased under storm conditions so exposing the toe of the cliff/wall to subsequent wave impact.
Wave energy and sediment accumulation
Reflection of waves
Measurement of incident and reflected waves allow us to quantify the dissipation of the wave energy through the sediment accumulation of the foreshore area. The reflection coefficient is defined as the ratio of the amplitude of the reflected fundamental wave to the amplitude of the incident fundamental wave. But, the energy of the various waves is related to the square of the respective amplitudes. The experimental results concerning the change in reflection coefficient with water depth in the offshore zone are reported in figure 11 for all three cases of shore platform morphology.
Case1 : Wave reflection is greatest in the case of the flat smooth shore platform. For this case there is no energy transfer to higher harmonics. Reflection coefficient values less than 1 can be interpreted as a dissipation process at the wall. Decreasing values of reflection coefficient in relation to the decreasing water depth reinforce this assumption because the flow velocities under gravity waves increase when the water depth decreases. Consequently, case 1 can be used as a reference state for the other experiments.
Case 2 : This behaviour can also be observed for the sloping smooth shore platform in the range [0.1 m – 0.15 m] of water depth because the water depth above the smooth slope is lower than in case 1 and dissipation by viscous drag at the floor increases in a similar way to that for case 1 at the lowest values of water depth.
For the range [0.07 m – 0.1 m] in case 2, the decrease in reflection coefficient is linked both to the dissipation process and to an energy transfer from fundamental mode to higher harmonic (fig. 12), where the second free harmonic rate (ratio of the amplitude of the second free harmonic mode to the amplitude of the fundamental mode) increases with a fall in water depth. This last effect is related to the non linear behaviour of the wave propagation in the shoaling zone due to the low water depth. Nevertheless, the reflection coefficient is always lower than that for the case 1, with a reduction of about 0.1 unit.
Case 3 : For the sediment shore platform case, the variation in reflection coefficient exhibits two quite different behaviours. For water depths greater than 0.12 m within the offshore area, i.e. during the tidal cycle from low tide to high tide (flood tide), the reflection coefficient is similar to that for the case 2, with a reduction of about 0.1 unit due to energy dissipation by viscous drag and a transfer of energy from fundamental mode to the higher harmonics (fig. 12). For water depths lower than 0.11 m, the reflection
coefficient is very low (between 0 and 0.1). Because the water level does not reach the wall the wave impact conditions are very different. As shown in figure 12 the energy transfer to higher harmonics is very low ; in this case, all the energy is dissipated by the beach sediment.
Effectively we can consider the relative water depth above the sediment, which is the water depth at the top of the sediment located at the toe of the wall and expressed by hr in fig. 5. The variation in
reflection coefficient with water level above the shingle has been compared for all three cases (fig.13). For each case, this change is continuous. Thus, if the foreshore zone is completely covered by sea water, the presence of a slope and shingle cover reduces the water depth above the beach and wave attack conditions become similar to an horizontal smooth slope (case 1) with a lower water depth. If the sea level does not reach the top of the foreshore the main phenomenon is a dissipation process and the effect of the waves on the cliff is very small.
Dissipation of waves
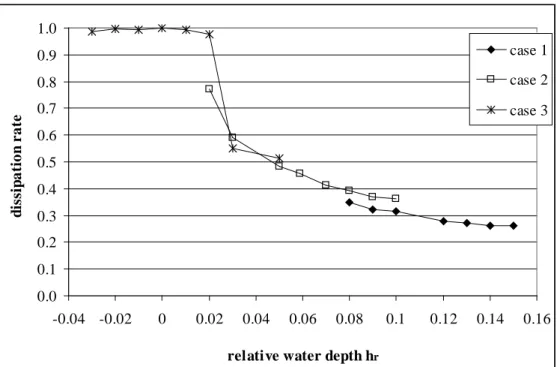
The wave energy dissipation in the foreshore zone can be represented by the coefficient D = 1 – Er/Ei where Er is the incident energy flux and Er the reflected energy flux. For this calculation
both the fundamental mode and the second harmonics (free and phase locked modes) are taken into account. Wave energy dissipation versus relative water depth above the foreshore zone are plotted in figure 14 for all three cases. Dissipation is therefore mainly a function of the relative water depth hr.
For case 3, the dissipation effect of the sediment cannot be distinguished from that of a simple non porous sloped beach. Nevertheless, in these laboratory conditions, the ratio between the permeability of the sediment and the viscosity of the fluid was lower than in prototype conditions.
The dissipation rate gives an indication of wave impact on the cliff toe and shows that the type of material covering the foreshore area is not the main parameter for wave dissipation. The water depth above the foreshore area seems to be the predominant parameter for wave dissipation.
Discussion
Field observations along the French and English coastline have indicated local erosion of the chalk cliff, by rock-fall events over the various coastal configurations. These beach and cliff forms include a shore platform with shingle (rock-fall at Le Tilleul, Upper-Normandy, France, in November 1998), a shore platform without shingle (rock-fall at Criel sur mer, Upper-Normandy, France, in
December 1997), a shore platform with sea wall at the toe of the cliff (rock-fall at Peacehaven, East Sussex, UK, in January 2001), poorly fractured coastal chalk cliffs (rock-fall at Puys, Upper-Normandy, France, in May 2000) and highly fractured coastal chalk cliffs (rock-fall at Beachy Head, East Sussex, UK, January 1999, May 2001) (fig. 1). The problem is to define if rock-falls and the subsequent cliff erosion along the Channel coastline are mainly governed by subaerial or marine parameters. On the one hand, Le Tilleul and Peacehaven rock-falls are clearly not linked to marine action at the toe of the cliff, because even at high tide, the sea-level never reaches the base of the cliff. At Le Tilleul, the shingle thickness is very high and at Peacehaven, the base of the cliff is protected by a continuous sea-wall. On the other hand, the Criel s/mer rock-fall may be linked to marine action at the toe of the cliff, because the water level reaches the toe of the cliff at high tide and the cliff face presents large open fractures extending the full cliff height and ending in caves at the base of the cliff.
The link between marine attack of the toe of the cliff and the initiation of a rock-fall also needs to be specified. One of the proposed solutions is to determine the volume involved for each observed rock-fall. Field observations of recent rock-falls have indicated different volumes of cliff collapse : either collapse occurs on the lower part of the cliff with small volumes of material involved or, with the largest events, the collapse involves the whole cliff height. Marine factors can only be implicated in the triggering of a collapse where the collapse is located in the lower part of the cliff, i.e. for cliff falls involving volumes below ten thousand cubic meters for one event (Duperret et al. 2001a, b).
Repeated pressure fluctuations may favour fatigue phenomenon at the base of the cliff face and the pressure changes can propagate within the chalk rock if an open network of fractures transversely oriented to the cliff face is located at the base of the cliff. Very little is known about the minimum pressure change needed to initiate rupture along a pre-existing fracture within chalk and hence trigger a rock-fall. The initiation of the rupture, which may lead to a collapse by pressure propagation through fractures, can only occur along a previous horizontal or vertical fracture network transversely-oriented to the cliff face, with open cracks at the base of the cliff.
The other mode of marine attack is wetting and drying processes and salt weathering, which may favour the superficial disintegration of the chalk rock at the toe of the cliff. Such processes only lead to a slight basal notching of the cliff.
Finally, marine action is also responsible for removal of cliff fall material by abrasion and chalk dissolution. Littoral drift characteristics would be informative to know cliff fall material and shingles displacements on the foreshore area.
Conclusion
One of the frequently asked questions regarding Channel coastline erosion is : What is the role of shingle in the cliff recession? The common idea is that shingle dissipates the wave energy and that this dissipation of energy is the main factor which protects the chalk cliff from erosion. The implied reasons are the roughness of the shingle beaches, the dissipation by infiltration into the porous medium and the momentum transfer from the water to the cobbles. The experiments conducted in the wave flume show that the dissipation of wave energy by beach sediments and particularly through shingle accumulation is too poor to protect a cliff when the foreshore area is completely covered by the sea. The main effect of shingle accumulation is to decrease the water depth at the base of the cliff. From the literature and the experiments conducted in the wave flume it can be deduced that the lower the water depth, the less the wave impact energy. But, in fact, if the water level covers the shingle, the wave attack at the base of the cliff presents the same conditions as that of a shore platform devoid of sediment.
The experiments show that, for non breaking waves on the front of cliff, the simple Sainflou model is appropriate for predicting the pressure field at the front of cliff.
Along the Channel coastline, the water depth at the cliff toe is low in most of the cases and the intensity of compression stress due to the impacts of waves on the front of the cliff is too low and is not sufficient to trigger a large rock fall.
Among the marine factors of erosion, the abrasion phenomenon of the base of cliff can be retained to explain any slight rock falls, restrained to the lower part of the cliff. In this case, the collapse is limited upward by horizontal hardgrounds levels, marl seams or flint bands. This phenomenon is favoured by a slight sloping shore platform by comparison to a horizontal bare shore platform.
The literature on the pressure propagation into cracks and the observations of open fracture networks in situ suggest that the fatigue phenomenon due to pressure oscillations could be a sensitive parameter of erosion. Further work would be very useful to obtain more exhaustive the knowledge on cliff erosion.
Acknowledgements
The ROCC project is funded by the European community through the INTERREG II Rives Manche initiative (contract I99059). This research work has also been funded by the Centre National de la Recherche Scientifique in the framework of Programme National des Risques Naturels, through the contract PNRN 99-35-AS. We thank David J. Pope for his critical and helpful review of the first version of this manuscript.
References
Benumof, B.T., Storlazzi, C.D., Seymour, R.J. & Griggs G.B. 2000. The relationship between incident wave energy and seacliff erosion rates : San Diego County, California. Journal Of Coastal Research, 16(4), 1162-1178.
Brossard, J., Hémon, A. & Rivoalen, E. 2000. Improved analysis of regular gravity waves and coefficient of reflection using one or two moving probes. Coastal Engineering 39(2-4), 193-212.
Cooke, R.U. & Smalley, I.J. 1968. Salt weathering in deserts. Nature, 220, 1226-1227.
Costa, S. 2000. Le recul des falaises du pays de Caux, Bulletin d’Information des Géologues du Bassin de Paris, 37(1), 31-34.
Davidson-Arnott, R.G.D. & Ollerhead, J. 1995. Nearshore erosion on a cohesive shoreline. Marine Geology, 122, 349-365.
Dean R.G. 1977. Equilibrium beach profiles : US Atlantic and Gulf Coasts. Ocean Eng. Report No 12, Univ. od Delaware, Newark.
De Rouville, A. 1938. Etat actuel des études internationales sur les efforts dus aux lames, Annales des Ponts et Chaussées, 108 (II), Paris, 5-113.
Duperret, A. Genter, A., Mortimore, R.N., Delacourt, B. & De Pomerai, M.R. 2002, Coastal rock cliff erosion by collapse at Puys, France : the role of impervious marl seams within chalk of NW Europe. Journal of Coastal Research, 18 (1), 52-61.
Duperret, A., Martinez, A., Genter, A., Mortimore, R.N. & Watremez, P. 2001a. Subaerial chalk cliff failures on the English channel coast, based on field data from recent collapses. trans. AGU Fall Meeting (San Fransisco, USA).
Duperret, A., Martinez, A., Genter, A., Mortimore, R.N. & Lawrence, J. 2001b. Recent collapses along the coastal chalk cliffs of the English channel : the role of lithology and fracturation on the rupture type, European Rock Coasts 2001 Conference, Brighton, UK, 17-18 December 2001, 56-57.
Fornos, J.J., Sousa-Dias, A., Pons, G., Melo, R. 2001. Possible causes of regional variations in platform morphology and rates of downwearing on European coasts : Biological variations, European Rock Coasts 2001 Conference, Brighton, UK, 17-18 December 2001, p.17.
Fredsoe, J. & Deigaard, R. 1992. Mechanics of coastal sediment transport. Advanced Series on Ocean Engineering, World Scientific, 3, 290-309.
Genter, A., Duperret, A., Martinez, A. & Vila, J-L. 2001. Fracture evaluation along the french chalk coast. Structural guidelines for building a GIS application for the ROCC project. International Conference on coastal Rock Slope Instability : Geohazard and Risk Analysis (Le Havre, France), 16-17.
Hoek, E. & Bray, J. 1977. Rock slope engineering. Inst. Mining and Mettalurgy, London.
Kirkgöz, M.S. 1982. Shock pressure of breaking waves on vertical walls. Journal of waterway, port, coastal, and ocean engineering,108, 81-95.
Kirkgöz, M.S. 1991. Impact pressure of breaking waves on vertical and sloping walls. Ocean Engineering, 18(1/2), 45-59.
Kirkgöz, M.S. 1995. Breaking wave impact on vertical and sloping coastal structures. Ocean Engineering, 22(1), 35-48.
Mc Greal, W.S. 1979. Marine erosion of glacial sediments from a low-energy cliffline environment near Kilkeel, northern Ireland. Marine Geology, v. 32, 89-103.
Müller, G. 1997. Propagation of wave impact pressures into water filled cracks. Institution of Civil Engineers, Water, Maritime and Energy, 124(2), 79-85
Müller, G. 1998. Time scale effects in pressure propagation into cracks. Minutes of 1st BLOCS workshop, HR Wallingford.
Peregrine, D.H. & Kalliadasis, S. 1996. Filling flows, cliff erosion and cleaning flows. Journal of Fluid Mechanics., 310, 365-374.
Robinson, L.A. 1977. Marine erosive processes at the cliff foot. Marine Geology, v. 23, 257-271.
Sainflou, S. 1928. Essai sur les digues maritimes verticales. Annales Ponts et Chaussées, v. 98, No. 4.
Sanders, N.K. 1968. Wave tank experiments on the erosion of rocky coasts. Royal Society of Tasmania Papers and Proceedings, v. 72, 106.
Skafel, M.G. & Bishop C.T. 1994. Flume experiments on the erosion of till shores by waves. Coastal Engineering, 23, 329-348.
Spencer T., 1988. Coastal biogeomorphology, in H.A. Viles, Biogeomorphology, Basil Blackwell, Oxford, 255-318.
Stephenson, W.J. & Kirk R.M. 2000. Development of shore platforms on Kaikoura Peninsula, South Island, New Zeland, part I : the role of waves, p. 21-41, part II : the role of subaerial weathering, p. 43-56, Geomorphology, 32.
Sunamura, T. 1977. A relationship between wave-induced cliff erosion and erosive force of waves. Journal Of Geology, 85, 613-618.
Sunamura, T. 1982. A predictive model for wave-induced cliff erosion, with application to Pacific coasts of Japan. Journal Of Geology, 90, 167-178.
Sunamura, T. 1992. Geomorphology of rocky coasts. Wiley, New York, 302 p.
Trenhaile, A.S. 1987. The Geomorphology of Rock Coasts. Oxford University Press, 338 p..
Wolters, G. & Müller, G. this issue. The propagation of wave impact induced pressures into cracks and fissures. in Mortimore R.N. and Duperret A. (eds), Coastal Chalk Cliff Instability, The Geological Society special publication.
Tables
Table 1 Amplitudes of the incident waves for the test cases
water depth h = 0.150 (m) h = 0.120 (m)
case 1 : horizontal smooth platform
6.6 10
-3(m)
4.2 10
-3(m)
case 2 : sloping smooth platform 6.9 10-3 (m) 4.2 10-3 (m) case 3 : sloping platform covered by shingle 6.7 10-3 (m) 4.4 10-3 (m) Sainflou model for horizontal smooth platform 6.6 10-3 (m) 4.2 10-3 (m)Figure captions.
Fig. 1. Location of the study area along the coasts of the English Channel. Continuous black line represents portion of coasts made of chalk cliffs, used for the study. All reported sites are cited in the text.
Fig. 2. Schematic sketch of a chalk cliff profile of the channel coasts.
Fig. 3.
(a) basal notching at the toe of the chalk cliff, which is clearly evidenced by the retreat of the cliff and the white colour of the washed chalk. Noted the shingle occurrence. The person gives an approximate scale. Veules-les-Roses, Upper-Normandy, France.
(b) large-scale fracture (Normal fault in-filled by clays) expanding all over the cliff height, ending by an open cave at the toe of the cliff. Noted the associate excavation of the cliff face. The person gives an approximate scale. Veules-les-Roses, Upper-Normandy, France.
(c) horizontal and vertical cracks at the base of the cliff. The horizontal fissure is located at the top of a hardground level and the vertical crack is an open joint. Note that the base of the cliff is more white, due to washing by sea-water during high tide. Fécamp, Upper-Normandy, France.
Fig. 4. Experimental set up for wave measurements.
Fig. 5. Modelled beach morphologies.
Fig. 6. Maximum pressure distributions along the vertical wall for 0.150m water depth. case 1 : horizontal smooth platform, case 2 : sloping smooth platform, case 3 : sloping platform covered by shingle, Sainflou : Sainflou model for horizontal platform.
Fig. 7. Maximum pressure distributions along the vertical wall for 0.120m water depth. Same cases than Fig.6.
Fig. 8. Pressure variation distributions along the vertical wall for 0.150m water depth. Same cases than Fig.6.
Fig. 9. Pressure variation distributions along the vertical wall for 0.120m water depth. Same cases than Fig.6.
Fig. 10. Modifications of the beach profile during a half a tide.
Fig. 11. Relationship between the reflection coefficient and the water depth. Same cases than Fig.6.
Fig. 12. Evolution of the harmonic rate with the water depth h at the offshore area. Same cases than Fig.6.
Fig. 13. Evolution of the reflection coefficient with the relative water depth hr at the toe of vertical wall.
Same cases than Fig.6.
Fig. 14. Evolution of the dissipation rate with the relative water depth hr at the toe of vertical wall.
Fig. 4
V
reflected wave incident wave
Case 1 : horizontal smooth foreshore
Case 2 : sloping smooth foreshore
Case 3 : sloping foreshore with shingle
Fig. 5
h 7.3 m vertical wall 1/20 slope 0. 05 m h hr shingle 0. 10 m h hrFig. 6
h=0.150 m
0 20 40 60 80 100 120 140 160 6 7 8 9 10 11 12 13 14relative maximum pressure (mm water height)
v e r tic a l p o sit io n ( m m ) case 1 case 2 case 3 Sainflou
Fig. 7
h=120 mm
0 20 40 60 80 100 120 140 2 3 4 5 6 7 8 9 10 11 12relative maximum pressure (mm water height)
v e r tic a l p o sit io n ( m m ) case 1 case 2 case 3 Sainflou
Fig. 8
h=0.150 m
0 20 40 60 80 100 120 140 160 10 15 20 25pressure variation (mm water height)
v e r tic a l p o sit io n ( m m ) case 1 case 2 case 3 Sainflou
Fig. 9
h=0.120 m
0 20 40 60 80 100 120 140 5 7 9 11 13 15 17pressure variation (mm water height)
v e r tic a l p o sit io n ( m m ) case 1 case 2 case 3 Sainflou
Fig. 11
0 0.1 0.2 0.3 0.4 0.5 0.6 0.7 0.8 0.9 1 0.06 0.07 0.08 0.09 0.1 0.11 0.12 0.13 0.14 0.15 0.16 water depth h (m) ref lec ti o n co ef fi ci en t case 1 case 2 case 3Fig. 12
0 0.05 0.1 0.15 0.2 0.25 0.3 0.06 0.08 0.1 0.12 0.14 0.16 water depth h (m) h ar m o n ic r at e case 1 case 2 case 3Fig. 13
0 0.1 0.2 0.3 0.4 0.5 0.6 0.7 0.8 0.9 1 -0.04 -0.02 0 0.02 0.04 0.06 0.08 0.1 0.12 0.14 0.16relative water depth hr (m)
re fl ec ti o n c o ef fi ci en t case 1 case 2 case 3
Fig. 14
0.0 0.1 0.2 0.3 0.4 0.5 0.6 0.7 0.8 0.9 1.0 -0.04 -0.02 0 0.02 0.04 0.06 0.08 0.1 0.12 0.14 0.16relative water depth hr
di ss ipa ti o n r a te case 1 case 2 case 3