HAL Id: hal-00298420
https://hal.archives-ouvertes.fr/hal-00298420
Submitted on 11 Sep 2006
HAL is a multi-disciplinary open access
archive for the deposit and dissemination of sci-entific research documents, whether they are pub-lished or not. The documents may come from teaching and research institutions in France or abroad, or from public or private research centers.
L’archive ouverte pluridisciplinaire HAL, est destinée au dépôt et à la diffusion de documents scientifiques de niveau recherche, publiés ou non, émanant des établissements d’enseignement et de recherche français ou étrangers, des laboratoires publics ou privés.
Development of a new expendable probe for the study of
pelagic ecosystems from Voluntary Observing Ships
M. Marcelli, A. Di Maio, D. Donis, U. Mainardi, G. M. R. Manzella
To cite this version:
M. Marcelli, A. Di Maio, D. Donis, U. Mainardi, G. M. R. Manzella. Development of a new expendable probe for the study of pelagic ecosystems from Voluntary Observing Ships. Ocean Science Discussions, European Geosciences Union, 2006, 3 (5), pp.1515-1541. �hal-00298420�
OSD
3, 1515–1541, 2006The T-FLAP a new expendable probe M. Marcelli et al. Title Page Abstract Introduction Conclusions References Tables Figures J I J I Back Close Full Screen / Esc
Printer-friendly Version Interactive Discussion
EGU
Ocean Sci. Discuss., 3, 1515–1541, 2006 www.ocean-sci-discuss.net/3/1515/2006/ © Author(s) 2006. This work is licensed under a Creative Commons License.
Ocean Science Discussions
Papers published in Ocean Science Discussions are under open-access review for the journal Ocean Science
Development of a new expendable probe
for the study of pelagic ecosystems from
Voluntary Observing Ships
M. Marcelli1, A. Di Maio2, D. Donis1, U. Mainardi3, and G. M. R. Manzella4
1
Department DECOS, Tuscia University, Via S. Giovanni Decollato n.1, 01100 Viterbo, Italy
2
AQSmare, Via del Molo di Levante, 1, 00054 Fiumicino (Roma), Italy
3
Maisoft, Via Ronchi n.18, 24020 Villa di Serio(Bg), Italy
4
ENEA ACS, Forte S.Teresa, Loc. Pozzuolo, 19036 Lerici, Italy
Received: 9 August 2006 – Accepted: 10 August 2006 – Published: 11 September 2006 Correspondence to: M. Marcelli ([email protected])
OSD
3, 1515–1541, 2006The T-FLAP a new expendable probe M. Marcelli et al. Title Page Abstract Introduction Conclusions References Tables Figures J I J I Back Close Full Screen / Esc
Printer-friendly Version Interactive Discussion
EGU
Abstract
Physical and biological processes of the marine ecosystem have a high spatial and temporal variability, whose study is possible only through high resolution and synoptic observations. The T-FLAP (Temperature and Fluorescence LAunchable Probe) was charted in order to answer to the claim of a cost effective temperature and fluores-5
cence expendable profiler, to be used in ships of opportunity. The development of the expendable fluorimeter has followed similar concepts of the XBT (a wire conduct-ing the signal to a computer card), but differently from that, T-FLAP was developed with an electronic system that can be improved and adapted to several variables mea-sure channels. Commercial components were utilized to reach the aim of a low-cost 10
probe: a glass bulb temperature resistor for the temperature measurement, blue LEDs, a photodiode and available selective glass filters, for fluorescence measurement. The measurement principle employed to detect phytoplankton’s biomass is the active fluo-rescence. This method is an in vivo chlorophyll measure, that can get the immediate biophysical reaction of the cell inside the aquatic ecosystem; it is a non-disruptive 15
method which gives a real time measure and avoids the implicit errors due to the ma-nipulation of samples. The possibility of using continuous profiling probe, with an active fluorescence measurement, is very important in the study of phytoplankton in real time; it is the best way to follow the variability of sea productivity. In fact, because of the high time and space variability of phytoplankton, due to its capability to answer in a relatively 20
short time to ecological variations in its environment and because of its characteristic patchiness, there isn’t a precise quantitative estimation of the biomass present in the Mediterranean sea.
1 Introduction
Operational forecasting of marine physical and biochemical state variables is becoming 25
OSD
3, 1515–1541, 2006The T-FLAP a new expendable probe M. Marcelli et al. Title Page Abstract Introduction Conclusions References Tables Figures J I J I Back Close Full Screen / Esc
Printer-friendly Version Interactive Discussion
EGU
resources. The forecasting systems need multidisciplinary input data, the operational collection of which is hampered by two main factors: cost and technology.
The methodology actually used for an operational monitoring of the oceans is mainly based on lagrangian profiling buoys (Argo) and on Ships Of Opportunities. Potentially, the Argo floats can measure physical, chemical and some biological parameters. In 5
practice this potential capability is limited by cost and power supply. The Ships Of Opportunity Program (SOOP) is based on eXpendable BathyTermographs (XBT) tech-nology developed at the end of 60’s and provides only temperature profiles of the upper thermocline.
An operational observing and forecasting system for the physical properties of the 10
ocean was set up in the Mediterranean Sea from 1999 (Pinardi et al., 2003) in the framework of an EC-supported pilot project. The project follow-up, called Mediter-ranean Forecasting System (MFS) – Toward Environmental Prediction (TEP), has im-plemented the forecasting system of the biological state variables. A Voluntary Observ-ing Ship program (VOS) was devised, within the MFS – TEP project, to support ocean 15
weather forecasting. The voluntary observing ships are essential, since are integrat-ing ocean surface temperature from satellites, and contribute to the MFS capability of providing near real time analysis of the ocean state.
However, there is still a lack of basin wide, operational, multidisciplinary, in situ ob-serving system. Satellite remote sensing provides a unique synoptic view of phenom-20
ena such as chlorophyll concentration and sea surface temperature, but the measure-ment validation requires constant scrutiny and much sea-truth data as possible; for this reason the integration between field sampling and remote sensing technique should be improved also for the development of ecosystem model forecasts .
Remote sensing of primary production in the euphotic zone has been based mostly 25
on visible-band water-leaving radiance measured with the coastal zone color scanner. There are some robust, simple relationships for calculating integral production based on surface measurements, but they also require knowledge of photoadaptive parame-ters such as maximum photosynthesis which currently cannot be obtained from space
OSD
3, 1515–1541, 2006The T-FLAP a new expendable probe M. Marcelli et al. Title Page Abstract Introduction Conclusions References Tables Figures J I J I Back Close Full Screen / Esc
Printer-friendly Version Interactive Discussion
EGU
(Balch and Byrne, 1994). More than for the physical variables, the biological ones have to be observed in situ. Especially in the mid-high latitudes, a deep observation of the water column is needed, because of the typical distribution of phytoplankton’s biomass (Mann and Lazier, 1991).
The T-FLAP (Temperature and Fluorescence LAunchable Probe) was charted in or-5
der to answer to the claim of a cost effective temperature and fluorescence expend-able profiler, to be used in ships of opportunity. Its development, born inside the MFS – TEP – VOS, had the aim to add biological profiling measurements to the physical ones, in order to have more extensive information on chlorophyll concentration in the sea. Chlorophyll is an index of phytoplankton’s biomass, and is also the most common 10
property that characterizes marine productivity.
The possibility of using a continuous profiling probe, with an active fluorescence measurement, is very important in the study of phytoplankton in real time; it is the best way to follow the variability of sea productivity. In fact, because of the high time and space variability of phytoplankton, due to its capability to answer in a relatively short 15
time to ecological variations in its environment (Lewis et al., 1984) and because of its characteristic patched distribution, there isn’t a precise quantitative estimation of the biomass present in the Mediterranean sea. Moreover primary producers in the sea, phytoplankton at first, contribute for the 40% of global assimilation of inorganic carbon (Falkowski et al., 2002), resulting particularly relevant in the study of global change. 20
The development of the expendable fluorimeter has followed similar concepts of the XBT (a wire conducting the signal to a computer card), but differently from the latter, T-FLAP was developed with an electronic system that can be improved and adapted to several variables measure channels. Commercial components were used for the development of a prototype, with the aim of a low-cost probe: a glass bulb temperature 25
resistor for the temperature measurement, blue LEDs, a photodiode and commercial selective glass filters, for fluorescence measurement. The measurement principle for the detection of phytoplankton’s biomass is the active fluorescence. This method is an in vivo chlorophyll measure, that can get the immediate biophysical reaction of the
OSD
3, 1515–1541, 2006The T-FLAP a new expendable probe M. Marcelli et al. Title Page Abstract Introduction Conclusions References Tables Figures J I J I Back Close Full Screen / Esc
Printer-friendly Version Interactive Discussion
EGU
cell inside the aquatic ecosystem (Lorenzen, 1966). This is a non-disruptive method which gives a real time measure and avoids the implicit errors due to the manipulation of samples.
2 Instrument and method
T-FLAP is an expendable probe able to measure Chlorophyll “a” fluorescence and tem-5
perature, which has a transmission system and a shape developed in order to allow its use from moving ships. The simplicity in the use of this probe and its relatively low cost were the basic requirements of T-FLAP development. Other requirements were concerning the need to detect the deep chlorophyll maximum (DCM) with a sufficient accuracy, and temperature with an accuracy of 0.1◦C.
10
The T-Flap’s electronics and firmware, for sensors management and data transmis-sion, are placed inside the probe. Measurements take place in an internal cell, where the water flows while the probe descends along the water column. The data transmis-sion is allowed by a twin copper wire wrapped on a coil placed in the tail of the probe and in a canister.
15
T-FLAP is composed by:
– A measurement cell represented by an anticorodal aluminium tube where the
water flows in the inside; in the internal part of the tube are fixed the sensors which are in direct tuch with the water, while on the external part of the tube there are placed the batteries and the electronics.
20
– This central body is covered by a larger anticorodal aluminium tube, closed by two
flanges, constituing the case where are placed betteries and electronics.
– On the tail is placed a coil with the copper wire for data transmission. The tail has
OSD
3, 1515–1541, 2006The T-FLAP a new expendable probe M. Marcelli et al. Title Page Abstract Introduction Conclusions References Tables Figures J I J I Back Close Full Screen / Esc
Printer-friendly Version Interactive Discussion
EGU
– The frontal part is composed by heavy material to allow a vertical fall: it is
consti-tuted by a turned zinc ogive blocked by a metallic nail. Falling tests were made with several options in order to check the best weight of the probe to reach an ideal falling speed.
The main components of the T-FLAP are shown in Fig. 1, while a design of the longitu-5
dinal section of the probe is shown in Fig. 2.
The electronics are placed on two parallel faces of the measure cell. It is composed by two printed circuits and batteries (Fig. 3). These circuits contain the integrated electronic functions distinct for typology:
– Circuit 1, positioned at the photodiode side, has all the analogical measure
func-10
tions, signals conditioning and digital conversion functions.
– Circuit 2, has all the digital elaboration circuits, data transmission, LED diodes
piloting functions and the power supply system.
The optimal shape-structure of the T-FlAP is 8 cm diameter for a 35.9 cm length. These dimensions assure a good weight distribution and, as a consequence, a good vertical 15
lowering of the probe. The zinc ogive can be more or less heavy resulting a total weight in water from 1.50 kg to 2.15 kg.
3 Sensors
3.1 Fluorimeter
The fluorimeter is composed by: 20
– a source of light in the wavelengths of 430 nm, 450 nm 470 nm (blue LEDs) – an optical filter which selects the blue wavelength from 430 to 480 nm
OSD
3, 1515–1541, 2006The T-FLAP a new expendable probe M. Marcelli et al. Title Page Abstract Introduction Conclusions References Tables Figures J I J I Back Close Full Screen / Esc
Printer-friendly Version Interactive Discussion
EGU
– an amplified semiconductor element (with electronics integrated) as sensitive
re-ceptor
– an optical filter which selects the red light up to 600 nm
The fluorimetric device utilizes a light emission which saturates the measure section with a high intensity light impulses in the blue wavelength. Through a control electronic 5
circuit, the diodes can be modulated with impulses by 5 ms with a peak over 100 mA. This brings the light emission to a value over 10 cd for each led.
3.2 Fluorescence measurement system
For the Chlorophyll “a” fluorescence measurement is employed a semiconductor ele-ment with specific spectral sensitivity for the red band. In front of the photodiode there 10
is positioned an optical red filter specific for the red wavelength up to 600 nm. The weakness of the natural fluorescence signal makes critical the noise/signal rate, so that in the measure circuits project it has been paid particular attention to the static noise factor, the intrinsic current level which is not due to the photon activity; this is a characteristic of the quality of a photodiode but interferes with the signal amplification 15
process, enhancing the amplitude of the signal in a way that generates creep phenom-ena.
Directly connected to the photodiode, there is an high precision low noise j-fet am-plifier, in order to amplify the micro currents from 0 to 1 µA and convert them in a tension value between 0–5 V. For the compensation of the field free emission current 20
there were adopted digital subtraction techniques alternating the measure in presence of light with a measure without light.
For the dynamic noise instead, which has a random behavior, where adopted filter-ing and integration techniques for small periods on a sufficient number of impulses to maintain the measurement dynamic.
OSD
3, 1515–1541, 2006The T-FLAP a new expendable probe M. Marcelli et al. Title Page Abstract Introduction Conclusions References Tables Figures J I J I Back Close Full Screen / Esc
Printer-friendly Version Interactive Discussion
EGU
3.3 Temperature measurement
The temperature measurement is effectuated through a glass bulb micro sensor which comes out from
the measure cell for 10 mm (Fig. 4), the sensitive part is composed by resistive sen-sor inside a spherical glass bulb with the diameter of 1.5 mm. This sensen-sor has an high 5
sensitivity to temperature variations (0.01◦C) and to the dynamic variations (0.05 ms).
4 Electronics and firmware
4.1 Architecture of electronic system
The electronic scheme of the T-FLAP is shown in Fig. 5. The measurement system allows an high speed acquisition of all parameters data, including optional additive 10
ones (i.e. sensors not yet added to the probe); each channel is predisposed for the treatment of signals.
The fluorescence channel is the most complex, it includes a low noise amplification system with optional gain choice, with a bias current control of the receiving diode; the amplifier output signal is demodulated and filtered with a few hertz cut off frequency 15
and with an high attenuation coefficient (>50 dB/octava). The temperature signal is amplified and normalized. It doesn’t need particular conditioning.
The conditioners output signals are uniform for all the variables and are sent to the analogical digital converter through a multiplexer integrated in the AD converter chip. This is able to convert at a maximum speed of 100 000 channels/second with a total 20
resolution of 16 bit. The high speed conversion permits a successive digital elaboration of the variables measure data before sending the signal to the surface through the transmission wire.
The light emitters are constituted by two groups different LED diodes with emission in the blue light (430, 450, 470 nm). The emission is modulated in square wave at a 25
OSD
3, 1515–1541, 2006The T-FLAP a new expendable probe M. Marcelli et al. Title Page Abstract Introduction Conclusions References Tables Figures J I J I Back Close Full Screen / Esc
Printer-friendly Version Interactive Discussion
EGU
programmed frequency between 500 and 2000 Hz, the impulse so modulated permits us to obtain an alternate optical signal with dark and light symmetric phases.
The power supply is provided by rechargeable Ni-MH hermetic batteries suitable for providing energy required by the system for the foreseen functioning time for a maximum of 60–100 min with full charge batteries.
5
4.2 Digital transmission system
Data transmission is digital and is allowed by a twin copper wire (µlink) wrapped on two separate coils; one of these is mobile an positioned in the tail of the T-FLAP, while the other is fixed in the canister launcher, through which the probe is connected to the pc on board.
10
Data acquisition doesn’t need a specific software, it is enough to have a pc terminal as Windows ® HyperTerminal and follow the information transmitted by the connected device. The interactive menu allows different work activities including programming and controlling.
The twin copper wire has many particular characteristics that are necessary to as-15
sure an effective data transmission capability. The intrinsic characteristics of the wire are depending on: conductor section, insulation material thickness, distance between the conductors, copper resistivity, insulation thickness. Extrinsic characteristics of the wire are: wrapped wire length , unwrapped wire length, impedance, resistance, para-site capacity, coupling capacity, water temperature. These parameters change contin-20
uously during the descent of the T-FLAP, reducing progressively the inductance value but enhancing the parasite capacity value; instead temperature has a minimal effect. The experimental harmonic analysis provided the characteristics of the wrapped wire:
– Total resistance (measured on both the conductors): 11.26 ohm/m – Coupling capacitance(between conductors): 170 pF/m
25
OSD
3, 1515–1541, 2006The T-FLAP a new expendable probe M. Marcelli et al. Title Page Abstract Introduction Conclusions References Tables Figures J I J I Back Close Full Screen / Esc
Printer-friendly Version Interactive Discussion
EGU
– Specific inductance (wrapped on both the bobbins): 2.01 H on 1500 m – Impedance Z measured at 1000 Hz: 13.36 khom on 1500 m
4.3 Coil’s capacity
The mobile coil, inside the Tflap, has to contain a wire with a length as the maximum depth it could reach plus a tolerance length: the pre-serie has 700 m of wire.
5
4.4 Limits
The application for which the T-FLAP was designed is the profiling measure of fluores-cence and temperature along the water column until a depth of at least 350 m; being subjected to a progressive hydrostatic pressure, the functional limits of the instrument, concerning to the implosion of the materials, stand by 500 dBar, expecting this to be 10
the highest pressure we need to reach. The available energy for the electric functioning would allow a longer life of the device if there weren’t the physical limitations.
A second limit is the capability of the coils to host a longer or thicker couple of con-ductors: for each one it was prevented at the most a double length with the same diameter, or a bigger diameter with the present length.
15
5 Development and optimisation
The first phase of the experimental activities for the fluorimeter assembly has been directed to an accurate evaluation of any element which was able to full fit the charac-teristics of the instrument’s components (LEDs, diodes, filters), with particular attention to low cost components. The second part of the experimental study had the aim to find 20
the best combination of the selected components.
The spectral characteristics of different LEDs lights were analysed to detect eventual presence of emissions in the red band, which would interfere with the chlorophyll
mea-OSD
3, 1515–1541, 2006The T-FLAP a new expendable probe M. Marcelli et al. Title Page Abstract Introduction Conclusions References Tables Figures J I J I Back Close Full Screen / Esc
Printer-friendly Version Interactive Discussion
EGU
sure. Afterward it was verified the transmittance of the filters and it was analysed the spectral emission of the LED with blue and red filters.
In a second phase LEDs, filters and photodiodes were assembled in a not sub-mersible measurement cell. By using an oscilloscope, the photodiode output signal was measured to detect the “parasite” light (deduced from the noise signal).
5
Finally, a definitive geometry of the measure cell was defined, and fluorescence measurements in laboratory were done in order to study the sensor output signal and define its amplification. On the basis of the obtained results, different prototypes were assembled and tested.
The analysis of LEDs spectra and filters transmittance was done with an EPP2000C 10
UV+VIS Spectrometer (Wavelength Range 200–850 nm; resolution 0.75 nm) at first separately. Once found the best transmittances, selected LEDs with selected filters have been tested in the laboratory of Experimental Oceanology and Marine Ecology in Civitavecchia, Italy.
Different filters were analysed such as acetylene filters used for a first prototype 15
(LEEfilters) and glass photographic coloured ones. Once verified that there was no appreciable interference from glass on light emission, we had reason to utilize it as support for the filters. A final choice of the filters was operated in favor of photographic ones, in order to have retrievable and cheap components.
6 Fluorimeter calibration
20
Static calibration
Different dilutions of a concentrate Chlorella sp solution measured with a calibrated fluorimeter (PrimpProd 1.08) were used for the static calibration of T-FLAP. PrimProd is a very sensible fluorimeter , based on a photomultiplier sensible element, developed by the Institute of Biophysics of Moscow (Antal et al., 2001). The conversion laws used 25
OSD
3, 1515–1541, 2006The T-FLAP a new expendable probe M. Marcelli et al. Title Page Abstract Introduction Conclusions References Tables Figures J I J I Back Close Full Screen / Esc
Printer-friendly Version Interactive Discussion
EGU
Fmax are reported in Eq. (1) and Eq. (2).
Chla=((0.03874 + 0.00092 ∗ Fmax)−0.364)/2.377 (1)
Chla=((0.0431 + 0.00072 ∗ F0)−0.244)/1.108 (2)
The spectrophotometric analysis of the samples employed for the calibration of the fluorimeter was leaded following the method reported by Lazzara et al. (1990).
5
In Fig. 6 is shown the relation between fluorescence measurements of PrimProd and T-Flap.
Dynamic calibration
In order to acquire data simultaneously it was built a water flux circuit where the T-Flap was inserted togeter with a reference probe: the water flowed through the reference 10
probe and through the T-Flap thanks to a bulk insulated tube system connected to a circulation/feeder pump (0.7 bar, 5.7 l/min). which kept a constant flow.
In this way it has been possible to effectuate a dynamic calibration, which is neces-sary to test an instrument like T-Flap, that descends in the water column with a constant speed, letting the water flow inside of it.
15
The entire circuit caught the water from a tank and flowed it out in the same tank in which it was progressively added a certain quantity of living phytoplankton.
The probes were directly connected to the pc by a serial interface so that the values were available in real time; at the reference probe fluorescence value corresponded a T-Flap value expressed in Volt.
20
In Fig. 7 is represented the best fit curve for the calibration of the fluorescence sensor of T-Flap.
Reference probe
The reference probe, PrimProd 1.11 , is a submersible PC-controlled fluorimeter (accu-racy: 0.1 µg/l) which uses the double flash “pump and probe” technique for measuring 25
OSD
3, 1515–1541, 2006The T-FLAP a new expendable probe M. Marcelli et al. Title Page Abstract Introduction Conclusions References Tables Figures J I J I Back Close Full Screen / Esc
Printer-friendly Version Interactive Discussion
EGU
the constant and variable chlorophyll fluorescence in vivo, to estimate phytoplankton abundance and the quantum efficiency of phytoplankton photosynthesis, where the sensitive element is a photomultiplier (Piermattei et al., 2006).
7 Temperature calibration
Static calibration 5
The response of the temperature resistor is converted in a tension signal value. To find out the conversion law, which allows to transform the mV signal value in◦C, the T-FLAP was immersed in temperature controlled water and the degree temperature value has been obtained by a reference temperature sensor. It was used a PVC tank by the dimension of 40×40×40 isolated with a 3 cm thick polystyrene layer. The tank 10
was covered by a cap made by a plywood layer 0.4 cm thick, covered with polystyrene, on which it has been made a hole to host the reference sensor and one for the TFlap.
The temperature measurement inside the tub was done by means of an IDRONAUT 316 multi parametric probe which has got an accuracy of 0.003◦C. The probe is directly connected to the pc by the serial interface so that the values were available in real time. 15
When the water volume reached a stable temperature the T-Flap acquisition got started and the output values were saved on the pc.
The motion of the water was kept by a submerged pump with a 450 gallons capacity (1500 l/h). The pump permitted to keep mixed the water volume so that every point of the tank had the same temperature. The pump drew the water from the bottom and 20
let it out from 3 different spots: on the surface, inside the measure room near to the T-FLAP and near to the reference sensor.
The calibration was realized in 22 correspondent temperatures, in a range of 0 to 25◦C. To reach the 0◦C temperature some ice cubes were added, while to increase temperature hot water was added.
25
OSD
3, 1515–1541, 2006The T-FLAP a new expendable probe M. Marcelli et al. Title Page Abstract Introduction Conclusions References Tables Figures J I J I Back Close Full Screen / Esc
Printer-friendly Version Interactive Discussion
EGU
each of the 22 temperature values, correspondent voltage values were extracted from sensors and a regression analysis carried out (Fig. 8).
Dynamic calibration
The temperature sensor was dynamically calibrated using the same flow system em-ployed for the fluorescence calibration: this time the reference probe was a Falmouth 5
OTM with Platinum Resistance Thermometer which has an accuracy of 0.003◦C. The entire circuit caught the water from an insulated tank full of melting ice, and flowed it out in the same tank in which it was progressively added hot water.
In Fig. 9 is represented the best fit curve for the calibration of the temperature sensor of T-Flap.
10
8 Field tests
The T-FLAP field tests were conducted on November 2005 from the Urania R/V in the Tyrrhenian Sea and on April 2006 from Tuscia University boat Sampei, offshore Civitavecchia (Tyrrhenian Sea).
The reference probe utilized for measurements of fluorescence and temperature on 15
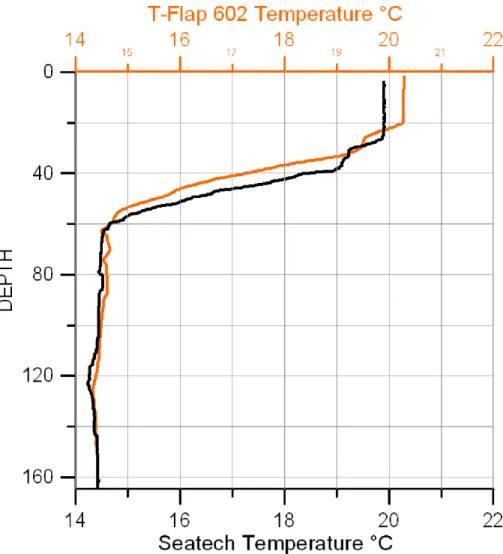
April, on Sampei boat, is PrimProd 1.11. The T-FLAP gives good results either for the fluorescence measure and for temperature measure. In Fig. 10 and Fig. 11 are shown the profiles. The water in this period is still warm in the upper layer; it is appreciable the T-FLAP resolution of the thermocline. The fluorescence measure of T-Flap can successfully describe the Chlorophyll distribution in the water column. Similar results 20
were obtained in all the field tests and in particular the Deep Chlorophyll Maximum is clearly discerned.
It is important to underline that the Tyrrhenian sea is the most oligotrophic area of the Mediterranean Western Basin, particularly in summer, with average Chl values by 0.06 mg m−3 in the upper layer (Bosc et al., 2003), while the DCM reaches 0.6 mg m−3 25
OSD
3, 1515–1541, 2006The T-FLAP a new expendable probe M. Marcelli et al. Title Page Abstract Introduction Conclusions References Tables Figures J I J I Back Close Full Screen / Esc
Printer-friendly Version Interactive Discussion
EGU
in late summer (Marcelli et al., 2005).
9 Conclusions
The T-FLAP development has been based on system components having a low cost, available in commerce and purchasable by stocks in order to allow the massive pro-duction required by an expendable probe. Temperature measurements have reached 5
the accuracy of 0.01◦C. For the fluorescence, even if was tested in an oligotrophic sea, the accuracy reached satisfies the aim of a clear detection of the deep chlorophyll maximum: this ensures the description of phytoplankton’s biomass in most of the seas which are more productive than the Tyrrhenian.
Acknowledgements. T-FLAP development was done in the framework of MFS – TEP, a project 10
supported by the EC under contract EVK3-CT-2002-00075
The authors would like to thank: N. Pinardi, A. Cruzado, G. Coppini, V. Piermattei, I. Nardello, L. Lazzara, M. Mainardi, A. Anav, G. Zappal `a and M. Scardi.
References
Pinardi, N., Allen, I., Demirov, E., De Mey, P., Korres, G., Lascaratos, A., La Traon, P-Y., Millard,
15
C, Manzella, G., and Tziavros, C.: The Mediterranean ocean Forecasting System, first phase of implementation (1998–2001), Ann. Geophys., 21, 3–20, 2003.
Balch, W. and Byrne, C.F.: Factors affecting the estimate of primary production from space, Geophys. Res. J., 99, 7555–7570, 1994.
Mann, K. H. and Lazier, J. R.: Dynamics of Marine Ecosystem, Blakwell Sci., 23–90, 1991.
20
Lewis, M. R., Cullen, J. J., and Platt, T.: Relationship between vertical mixing and phytoplank-ton: similarity criteria, Mar. Ecol. Prog. Ser., 15, 141–149, 1984.
Falkowski, P. G.: The ocean’s invisible forest, Scientific American, 287, 38–45, 2002.
Lorenzen, C. J.: A method for the continuous measurement of in vivo chlorophyll concentration, Deep-Sea Res., 13, 223–227, 1966.
OSD
3, 1515–1541, 2006The T-FLAP a new expendable probe M. Marcelli et al. Title Page Abstract Introduction Conclusions References Tables Figures J I J I Back Close Full Screen / Esc
Printer-friendly Version Interactive Discussion
EGU
Antal, T. K., Venediktov, P. S., Matorin, D. N., et al.: Measurements of phytoplankton photosyn-thesis rate using a pump and probe fluorometer, Oceanologia, 43, 291–313, 2001.
Lazzara, L., Bianchi, F., Falcucci, M., Modigh, M., and Ribera D’Alcal `a, M.: Pigmenti Clorofil-liani. Nova Thalassia, 2, 207–223, 1990.
Piermattei, V., Bortoluzzi, G., Cozzi, S., Di Maio, A., and Marcelli, M.: Analysis of mesoscale
5
productivity processes in the Adriatic sea: comparison between data acquired by SARAGO, a towed ondulatine vehicle, and by CTD casts, Chem. Ecol., in press, 2006.
Bosc, E., Bricaud, A., and Antoine, D.: Seasonal and interannual variability in algal biomass and primary production in the Mediterranean Sea as derived from 4 years of SeaWiFS ob-servations, Global Biogeochem. Cycles, 18, GB1005, doi:10.1029/2003GB002034, 2004.
10
Marcelli, M., Caburazzi, M., Perilli, A., Piermattei, V., and Fresi, E.: Deep Chlorophyll maximum distribution in the central Tyrrhenian Sea described by a towed ondulatine vehicle, 21, 351– 367, 2005.
OSD
3, 1515–1541, 2006The T-FLAP a new expendable probe M. Marcelli et al. Title Page Abstract Introduction Conclusions References Tables Figures J I J I Back Close Full Screen / Esc
Printer-friendly Version Interactive Discussion
EGU
OSD
3, 1515–1541, 2006The T-FLAP a new expendable probe M. Marcelli et al. Title Page Abstract Introduction Conclusions References Tables Figures J I J I Back Close Full Screen / Esc
Printer-friendly Version Interactive Discussion
EGU
Fig. 2. The schematic functioning of the T-FLAP. The water enters the measuring cell were temperature and fluorimeter measurements are done.
OSD
3, 1515–1541, 2006The T-FLAP a new expendable probe M. Marcelli et al. Title Page Abstract Introduction Conclusions References Tables Figures J I J I Back Close Full Screen / Esc
Printer-friendly Version Interactive Discussion
EGU
OSD
3, 1515–1541, 2006The T-FLAP a new expendable probe M. Marcelli et al. Title Page Abstract Introduction Conclusions References Tables Figures J I J I Back Close Full Screen / Esc
Printer-friendly Version Interactive Discussion
EGU
OSD
3, 1515–1541, 2006The T-FLAP a new expendable probe M. Marcelli et al. Title Page Abstract Introduction Conclusions References Tables Figures J I J I Back Close Full Screen / Esc
Printer-friendly Version Interactive Discussion
EGU
OSD
3, 1515–1541, 2006The T-FLAP a new expendable probe M. Marcelli et al. Title Page Abstract Introduction Conclusions References Tables Figures J I J I Back Close Full Screen / Esc
Printer-friendly Version Interactive Discussion
EGU
Fig. 6. On X axis there is the Chl “a” measured by T-Flap (mV) while on Y there is the Chl “a” measured by PrimProd 1.08 expressed in mg/m3.
OSD
3, 1515–1541, 2006The T-FLAP a new expendable probe M. Marcelli et al. Title Page Abstract Introduction Conclusions References Tables Figures J I J I Back Close Full Screen / Esc
Printer-friendly Version Interactive Discussion
EGU
Fig. 7. Best Fit curve for the calibration of the T-Flap fluorescence sensor: on Y is reported the Chlorophyll concentration measured by PrimProd (mg/m3) and on X is reported the signal given by the T-Flap’s fluorescence sensor.
OSD
3, 1515–1541, 2006The T-FLAP a new expendable probe M. Marcelli et al. Title Page Abstract Introduction Conclusions References Tables Figures J I J I Back Close Full Screen / Esc
Printer-friendly Version Interactive Discussion
EGU
Fig. 8. On X axis there is the temperature measured by T-Flap (mV) while on Y there is the temperature measured by Idronaut expressed in◦C.
OSD
3, 1515–1541, 2006The T-FLAP a new expendable probe M. Marcelli et al. Title Page Abstract Introduction Conclusions References Tables Figures J I J I Back Close Full Screen / Esc
Printer-friendly Version Interactive Discussion
EGU
Fig. 9. Best Fit curve for the calibration of the temperature sensor: on Y is reported the temperature measured by OTM Falmouth (◦C) and on X is reported the signal given by the T-Flap’s temperature sensor.
OSD
3, 1515–1541, 2006The T-FLAP a new expendable probe M. Marcelli et al. Title Page Abstract Introduction Conclusions References Tables Figures J I J I Back Close Full Screen / Esc
Printer-friendly Version Interactive Discussion
EGU
Fig. 10. Comparison between chlorophyll measurement of T-FLAP (orange line) and reference probe (black line).
OSD
3, 1515–1541, 2006The T-FLAP a new expendable probe M. Marcelli et al. Title Page Abstract Introduction Conclusions References Tables Figures J I J I Back Close Full Screen / Esc
Printer-friendly Version Interactive Discussion
EGU
Fig. 11. Comparison between temperature measurement of T-FLAP (orange line) and refer-ence probe (black line ).