HAL Id: hal-00298416
https://hal.archives-ouvertes.fr/hal-00298416
Submitted on 31 Aug 2006HAL is a multi-disciplinary open access
archive for the deposit and dissemination of sci-entific research documents, whether they are pub-lished or not. The documents may come from teaching and research institutions in France or abroad, or from public or private research centers.
L’archive ouverte pluridisciplinaire HAL, est destinée au dépôt et à la diffusion de documents scientifiques de niveau recherche, publiés ou non, émanant des établissements d’enseignement et de recherche français ou étrangers, des laboratoires publics ou privés.
The M3A multi-sensor buoy network of the
Mediterranean Sea
K. Nittis, C. Tziavos, R. Bozzano, V. Cardin, Y. Thanos, G. Petihakis, M. E.
Schiano, F. Zanon
To cite this version:
K. Nittis, C. Tziavos, R. Bozzano, V. Cardin, Y. Thanos, et al.. The M3A multi-sensor buoy network of the Mediterranean Sea. Ocean Science Discussions, European Geosciences Union, 2006, 3 (4), pp.1399-1440. �hal-00298416�
OSD
3, 1399–1440, 2006 The M3A multi-sensor buoy network of the Mediterranean Sea K. Nittis et al. Title Page Abstract Introduction Conclusions References Tables Figures J I J I Back Close Full Screen / EscPrinter-friendly Version Interactive Discussion Ocean Sci. Discuss., 3, 1399–1440, 2006
www.ocean-sci-discuss.net/3/1399/2006/ © Author(s) 2006. This work is licensed under a Creative Commons License.
Ocean Science Discussions
Papers published in Ocean Science Discussions are under open-access review for the journal Ocean Science
The M3A multi-sensor buoy network of
the Mediterranean Sea
K. Nittis1, C. Tziavos1, R. Bozzano2, V. Cardin3, Y. Thanos1, G. Petihakis1, M. E. Schiano4, and F. Zanon5
1
Hellenic Centre for Marine Research, Institute of Oceanography, Athens, Greece 2
Consiglio Nazionale delle Ricerche, Istituto di Studi sui Sistemi Intelligenti per l’Automazione, Genova, Italy
3
Istituto Nazionale di Oceanografia e di Geofisica Sperimentale, Department of Oceanography, Trieste, Italy
4
Consiglio Nazionale delle Ricerche, Istituto di Scienze Marine, Genova, Italy 5
Tecnomare SpA, Venezia, Italy
Received: 18 April 2004 – Accepted: 21 August 2006 – Published: 31 August 2006 Correspondence to: K. Nittis ([email protected])
OSD
3, 1399–1440, 2006 The M3A multi-sensor buoy network of the Mediterranean Sea K. Nittis et al. Title Page Abstract Introduction Conclusions References Tables Figures J I J I Back Close Full Screen / EscPrinter-friendly Version Interactive Discussion
Abstract
A network of three multi-sensor timeseries stations able to deliver real time physical and biochemical observations of the upper thermocline has been developed for the needs of the Mediterranean Forecasting System during the MFSTEP project. They follow the experience of the prototype M3A system that was developed during the
MF-5
SPP project and has been tested during a pilot pre-operational period of 22 months (2000–2001). The systems integrate sensors for physical (temperature, salinity, turbid-ity, current speed and direction) as well as optical and chemical observations (dissolved oxygen, chlorophyll-a, PAR, nitrate). The south Aegean system (E1-M3A) follows a modular design using independent mooring lines and collects biochemical data in the
10
upper 100 m and physical data in the upper 500 m of the water column. The south Adri-atic buoy system (E2-M3A) uses similar instrumentation but on a single mooring line and also tests a new method of pumping water samples from relatively deep layers, performing analysis in the protected “dry” environment of the buoy interior. The Lig-urian Sea system (W1-M3A) is an ideal platform for air-sea interaction processes since
15
it hosts a large number of meteorological sensors while its ocean instrumentation, with real time transmission capabilities, is confined in the upper 50 m layer. Despite their different architecture, the three systems have common sampling strategy, quality con-trol and data management procedures. The network operates in the Mediterranean Sea since autumn 2004 collecting timeseries data for calibration and validation of the
20
forecasting system as well for process studies of regional dynamics.
OSD
3, 1399–1440, 2006 The M3A multi-sensor buoy network of the Mediterranean Sea K. Nittis et al. Title Page Abstract Introduction Conclusions References Tables Figures J I J I Back Close Full Screen / EscPrinter-friendly Version Interactive Discussion
1 Introduction
Operational monitoring and forecasting of marine environmental conditions is a nec-essary tool for the effective management and protection of the marine ecosystem. It requires the use of multi-variable real-time measurements combined with advanced physical and ecological numerical models. Fixed oceanographic buoys contribute
sig-5
nificantly to operational monitoring especially when high frequency and multiple pa-rameters are among the requirements (Glenn et al., 2000).
Such a multi-sensor buoy system was developed for the needs of the Mediterranean Forecasting System (MFS) during the EU funded MFSPP project (1998–2001). The overall aim of MFS, according to its science plan, is the prediction of coastal
pri-10
mary producers’ variability from the time scales of days to months (Pinardi and Flem-ming, 1998). Among the main goals of its pilot phase (MFSPP) was to demonstrate that multi-parametric operational monitoring and near real time (NRT) forecasts of the large-scale basin currents are feasible (Pinardi et al., 2003). The Mediterranean Moored Multi-sensor Array (M3A) is one of the observing components of MFS and was
15
designed to provide real time biochemical data of the euphotic zone (0–100 m) and physical parameters of the upper thermocline (0–500 m, Nittis et al., 2003). The MFS observing system also includes a) the VOS system for collection of XBT profiles along selected transects, b) the ARGO floats for temperature / salinity profiles and estimates of the deep circulation characteristics, c) satellite remote sensing for SST, SLA and
20
Ocean Colour and d) an experimental Glider for temperature and salinity profiles along a single transect. The M3A data would be used for calibration and validation of the hydrodynamic and ecosystem models, for interpretation/calibration of satellite ocean colour data and for future assimilation into regional ecosystem models.
The development of the prototype M3A system was based on the experience of the
25
Tropical Atmosphere-Ocean (TAO) array of the Equatorial Pacific (McPhaden et al., 1998) and similar developments on multi-parametric measurements at the Bermuda Test-Bed Mooring (Dickey et al., 1998) and the HALO/ALOHA station of the HOT
OSD
3, 1399–1440, 2006 The M3A multi-sensor buoy network of the Mediterranean Sea K. Nittis et al. Title Page Abstract Introduction Conclusions References Tables Figures J I J I Back Close Full Screen / EscPrinter-friendly Version Interactive Discussion program (Chiswell and Lucas, 1990). The goal was to combine the operational
capabil-ities of the Atlas moorings with the multiparametric configurations of the BTM & HALO systems. Furthermore, its design took into account the requirements of the MFS Sci-ence Plan (open sea system, multi-parametric observation, real-time transmission) and the need for easy and cost-effective maintenance. Its pilot operation during 2000–2001
5
provided valuable time series for studies of ocean dynamics in the Cretan Sea (Cardin et al., 2003) and calibration-validation of regional ecosystem models (Triantafyllou et al., 2003).
During the MFSTEP project (Pinardi et al., 2005), the prototype M3A system has been upgraded, using the experience of its pilot operation, and was re-deployed in the
10
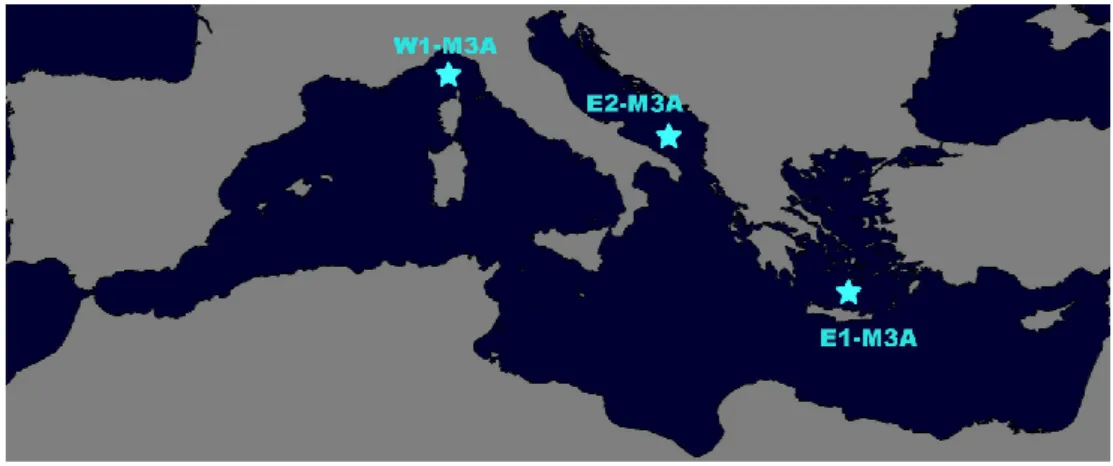
south Aegean Sea (E1-M3A) while two more similar systems have been developed: the first one in the southern Adriatic Sea (E2-M3A) and the second in the Ligurian Sea (W1-M3A). In this way, the basis of a coordinated, multiparametric, open-sea, buoy network for the Mediterranean basin has been established (Fig. 1). The development of the two new systems was based on upgrade of existing buoys that already had
15
a long record of operation, and/or commitments for operation through national initia-tives. The E2-M3A system is an upgrade of the BOMA buoy that has been developed through a project funded by the Italian Ministry of University, Scientific and Technologi-cal Research. Partnership included ENEA, TECNOMARE, OGS, IDROMAR, CNR-IOF (Tenomare, 2004). The W1-M3A system is an upgrade of the ODAS Italia-1 buoy that
20
operates in the Ligurian Sea since the begin of the ‘70ies (Cavaleri, 1984).
The areas where the three stations operate represent different hydrodynamic and ecosystem regimes of the Mediterranean Sea. The prototype M3A (E1-M3A) continues its operation in the Cretan Sea (south Aegean Sea, 35◦390N, 24◦580E), an extremely oligotrophic area where dense waters with intermediate and deep characteristics are
25
formed (Theocharis et al., 1999). The 2nd system (E2-M3A) is deployed in the south-ern Adriatic Sea (41◦180N, 17◦480E), at about 1200 m depth, another well-known area of dense water formation through open-sea convection. The center of the Southern Adriatic is an area where vertical mass transfer (upwelling, winter convection) has a
OSD
3, 1399–1440, 2006 The M3A multi-sensor buoy network of the Mediterranean Sea K. Nittis et al. Title Page Abstract Introduction Conclusions References Tables Figures J I J I Back Close Full Screen / EscPrinter-friendly Version Interactive Discussion rather prominent role in distributing physical and chemical water properties and
con-trolling the primary production (transfer of nutrients in the euphotic zone). Upwelling is determined by the intensity of the cyclonic circulation that in turn depends on the climatic conditions over the area (Gaˇci´c et al., 2002). The site is therefore appropriate for moored measurements since it is possible, under certain circumstances, to neglect
5
contributions of lateral advection processes. The 3rd system (W1-M3A) is deployed in the Ligurian Sea of the Western basin, one of the most dynamically active and produc-tive areas within the whole Mediterranean (43◦490N, 9◦070E). A permanent cyclonic circulation with seasonal and interannual variability triggered by the Tyrrhenian current dominates the area. During the winter, processes of dense water formation often occur
10
(Astraldi, 1990, 1992). Furthermore, this is an area that has been intensively mon-itored for several years in terms of surface atmospheric parameters (Sparnocchia et al., 2006) and water circulation.
The architecture of the three M3A systems and the results of their operation during 2004–2006 are presented in this paper. Section 2 provides technical details on the
15
design and instrumentation of the three systems. Quality control and data management issues are discussed in Sect. 3. The operation of the network during the MFSTEP project is described in Sect. 4 and sample timeseries are presented. The conclusions and future plans are summarized in Sect. 5.
OSD
3, 1399–1440, 2006 The M3A multi-sensor buoy network of the Mediterranean Sea K. Nittis et al. Title Page Abstract Introduction Conclusions References Tables Figures J I J I Back Close Full Screen / EscPrinter-friendly Version Interactive Discussion
2 M3A systems’ design
The development of the M3A network was based, in large, on upgrades of existing buoys and, thus, common architecture could not be used for the three systems. How-ever, efforts have been made to maintain common components such as: sampling strategy, quality assurance methods, data management procedures as well as
com-5
mon instrumentation when new investments could be made. The design and technical characteristics of the three systems are presented in the following paragraphs.
2.1 The E1-M3A system
E1-M3A is an evolution of the prototype M3A system (Nittis et al., 2003) with the follow-ing upgrades: a) a new telemetry system based on Iridium satellite is used b) a new pair
10
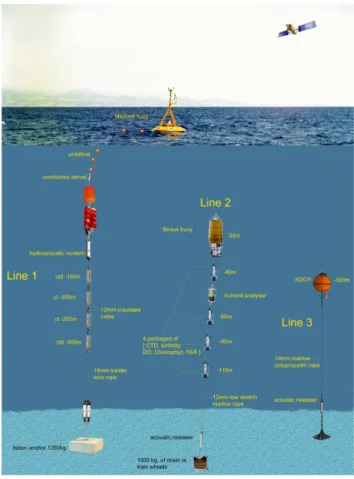
of underwater acoustic modems have been installed and c) antifouling methods have been tested and used for the optical sensors. The above upgrades were necessary to overcome the problems detected during the pilot operation of the system: the real time delivery of data and the quality of biochemical observations due to fouling. The overall system configuration is presented in Fig. 2. It is composed by a central (line 1) and two
15
peripheral mooring lines (line 2 and 3). This configuration allows separate, and thus easier, maintenance of lines 2 and 3 that need more frequent maintenance and can be handled by a medium size vessel. The central mooring line (1) has a lower mainte-nance frequency but, due to the size of the surface buoy, it requires the presence of a larger research vessel.
20
The central mooring line (1) hosts a surface buoy (wave rider “Medousa”), and the sensors for physical parameters at deep layers (below 100 m). Four SBE 37-IM CTD in-struments are used at 150, 250, 350, 500 m to measure temperature and conductivity. Pressure is also measured at 150 and 500 m. Data are transferred from the CTD sen-sors to the surface buoy by a 600 m inductive-modem cable. This cable is connected
25
to the subsurface umbilical by a conductive swivel at 30 m. The swivel allows the free rotation of the surface buoy, but in the same time it conducts the signal of the deep
OSD
3, 1399–1440, 2006 The M3A multi-sensor buoy network of the Mediterranean Sea K. Nittis et al. Title Page Abstract Introduction Conclusions References Tables Figures J I J I Back Close Full Screen / EscPrinter-friendly Version Interactive Discussion sensors. At 30 m depth, a hydroacoustic modem (Linkquest UWM300) receives the
data from mooring line 2 and transfers them to the surface buoy through the umbilical. The surface buoy is hosting, the sub-surface (1.5 m depth) sensors of temperature, and conductivity, the meteorological and wave sensors (wind speed and direction, air temperature, atmospheric pressure, humidity, wave height and direction), as well as the
5
data storage and transmission system. For the transmission of data to the operational centre an Iridium modem (A3ALA-I form NAL Res. Corp.) is used. A secondary, but more frequently used dew to lower cost, telemetry method is through the GSM network that has an increasing coverage in the Aegean Sea. Both telemetry systems allow two-way communication between the operational centre and E1-M3A.
10
Mooring line 2 is hosting four CTD probes (SBE-16) at 40, 65, 90 and 115 m. Apart of temperature, conductivity and pressure sensors, each probe is equipped with a trans-missometer (Wetlabs C-Star), a chlorophyll fluorometers (Wetlabs WETStar), a PAR (Photosynthetically Active Radiation) sensor (Li-Cor LI-193-SA) and a dissolved oxy-gen sensor (SBE 23B). The four probes are networked via an RS-485 interface. A
15
pressure container at 35 m depth is hosting the computer that controls line 2, stores the data and transmits them to mooring line 1 through the hydro-acoustic modem that is attached on the flotation device above the pressure container. Mooring line 2 is also equipped with two releasers at 125 and 1000 m and an Orca-BASM500 Argos beacon that transmits the mooring position if by accident the flotation device comes to surface.
20
A NAS2 nutrient (nitrate) analyzer of WS-OCEAN at 45 m depth has been used in the previous deployments but has been removed in 2004 due to malfunction.
The third mooring line (3) hosts the RDI 75 kHz Long Ranger ADCP. This device is at 500 m depth, measuring the current profile from that depth up to surface. The system does not include telemetry through the surface buoy since the large volume of ADCP
25
data does not allow real time transmission. With a sampling interval of 30 min the autonomy of the system is approximately 6 months, which is the maintenance interval for mooring line 3. An acoustic releaser at 1000 m allows the easy recovery and re-deployment of the system while an Argos beacon is also used on the flotation device for
OSD
3, 1399–1440, 2006 The M3A multi-sensor buoy network of the Mediterranean Sea K. Nittis et al. Title Page Abstract Introduction Conclusions References Tables Figures J I J I Back Close Full Screen / EscPrinter-friendly Version Interactive Discussion increased security. Additional technical information for the E1-M3A system including
sensors characteristics (models, accuracy etc.) are provided by Nittis et al. (2003). In order to reduce biofouling effects on the optical sensors, all the line 2 probes are equipped with canisters of bromide tablets while all plastic tubes have been replaced by copper. The bromine canister is attached to the SBE16 flushing circuit between the
5
fluorometer and the transmissometer. It maintains brominated water that prevents the growth of phytoplankton inside the circuit and the sensors, in-between measurements. The two methods have been tested during a dedicated experiment in the Aegean Sea and have proved to offer an efficient anti-fouling protection for at least three months (Petihakis et al., 2006).
10
2.2 The E2-M3A system
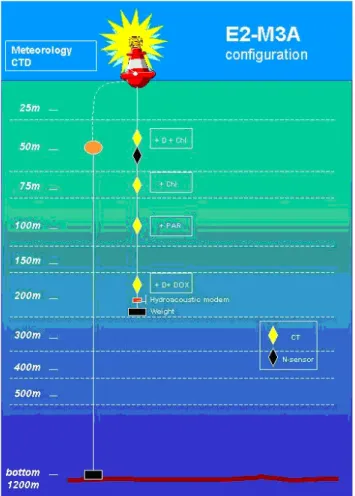
The E2-M3A system is positioned in the southern Adriatic Sea at a depth of 1200 m (41◦16.590N, 17◦39.890E). The configuration of the E2-M3A system follows the same principles applied as the M3A buoy in the Cretan Sea. However, choice of instruments, measurement depths and parameters to be monitored, are adapted to specific
oceano-15
graphic and bio-geo-chemical properties of the Adriatic Sea. The E2-M3A system is characterized by a surface buoy and a single mooring line (Fig. 3). The buoy hull of welded steel construction has a discus shape (6 m diameter, 1.4 m height), which provides three main compartments, provision for installation of sensors, ballast com-partments and provision for the attachment of the superstructure.
20
The buoy configuration includes data acquisition and control electronics, power man-agement systems, battery packs, photovoltaic panels, status monitoring sensors (such as GPS, battery voltage and current, panels current, internal temperatures, tilt, head-ing, acceleration, water detectors etc.) as well as signaling devices as required by the international regulations.
25
The ballast compartments have the capacity for 1135 kg (total) of water, which may be used to trim and/or ballast the buoy to the desired displacement as defined by the
OSD
3, 1399–1440, 2006 The M3A multi-sensor buoy network of the Mediterranean Sea K. Nittis et al. Title Page Abstract Introduction Conclusions References Tables Figures J I J I Back Close Full Screen / EscPrinter-friendly Version Interactive Discussion following information: – Displacement 13 600 kg – Hull weight 9080 kg – Mast weight 320 kg – Payload 2700 kg max 5
– Reserve (trim, ballast, payload) 1500 kg
The scientific payload of the E2-M3A system (Table 1) can be grouped into 3 main classes based on the type of measurement produced and/or on their position along the buoy’s body. The first group is dedicated to air-sea interface measurements and includes a meteorological station (RM Young) and a hull mounted C/T sensor (SeaBird
10
SBE-37SI). The second group includes the four probes (SBE16) attached on a 200 m inductive cable and performing measurements of: CTD at 50, 75, 100 and 200 m; fluo-rescence at 50 m and 75 m; dissolved oxygen at 200 m; PAR measurements at 100 m. The third group consists of an automatic water sampling system that makes available onboard the buoy seawater pumped from up to 5 different depths. This makes possible
15
to carry out, using a single nutrient analyser and multiparametric probe, measure-ments of nitrate, fluorescence and turbidity parameters at depths of 25, 50, 75, 100 and 200 m. Maintenance of the nutrient analyser, e.g. for reagent replacement, is also greatly simplified (no underwater operation necessary).
Other type of measurements aiming to control the correct functioning of the system
20
are also available. The GPS receiver is necessary to keep the clock of the data acqui-sition and control electronics correctly synchronized with the Greenwich Meridian Time and to get the correct position of the buoy: detection of a position out of a pre-defined “Watch Circle” will generate an alarm condition. The water detectors (one for each buoy compartment) will generate an alarm condition in case of detection of water at a
25
OSD
3, 1399–1440, 2006 The M3A multi-sensor buoy network of the Mediterranean Sea K. Nittis et al. Title Page Abstract Introduction Conclusions References Tables Figures J I J I Back Close Full Screen / EscPrinter-friendly Version Interactive Discussion certain level above the buoy floor. Finally, a Power System Monitoring Unit is used to
detect failures of power.
Regarding the operational mode of the buoy, there are two different states: IDLE and MISSION mode. In the IDLE mode only GPS and Water Detectors operate and in case of an alarm condition (buoy out of the watch circle or water detected in a compartment)
5
a message is sent through the telemetry system and the reception/execution of com-mands/data requests is possible via the communication system. In the MISSION mode the buoy automatically manages the acquisition of scientific data according to the pro-grammed configuration, the organization of collected data into files, the calculation of hourly reduced data, their daily transmission to the land station and back-up storage in
10
internal mass memory.
Data transmission is carried out via cellular modem. In particular, every day the buoy produces a file named *.SUM containing the reduced hourly data relevant to all scientific payload and status parameters. Two other files are produced, to enable further in-house processing on a significant subset of the original (raw) data acquired:
15
– file *.MET (produced hourly) containing 20’ of meteorological data acquired at
2 Hz;
– file *.SEA (produced every 3 h) containing 20’ of buoy motion data (pitch, roll,
heading) acquired at 2 Hz.
To manage these data and convert them in text format, a suitable MMI application has
20
been developed.
2.3 The W1-M3A system
The W1-M3A system is an upgrade of the existing ODAS Italia-1 buoy with main changes regarding a more powerful onboard acquisition system, a new communica-tion technology, and marine sensors with higher quality with respect to those previously
25
installed.
OSD
3, 1399–1440, 2006 The M3A multi-sensor buoy network of the Mediterranean Sea K. Nittis et al. Title Page Abstract Introduction Conclusions References Tables Figures J I J I Back Close Full Screen / EscPrinter-friendly Version Interactive Discussion ODAS Italia-1 is a large spar buoy specifically designed for air-sea interaction studies
and the collection of meteorological data even in rough sea (Fig. 4). Stability is the basic feature of this type of buoy with respect to the other more classical approach based on discus-shaped buoys (Berteaux, 1976).
The W1-M3A buoy consists of a main steel pole body divided into four sections firmly
5
joint by flanges and bolts. The three upper sections are water-tight, and one of them, the one in the middle, has a thicker portion to improve buoy stability and buoyancy. The fourth section is filled with water and has a stabilizing disk which, for the significant mass of water it moves, dampens the buoy vertical motion. A 1300 Kg ballast hangs from below this segment. The three water-tight floating sections were filled with a
10
closed-cell foam pre-shaped in pieces 1 m long of diameter close to inner diameter of the buoy and sealed in strong double nylon bags. The chosen foam was dense enough to limit, in case of complete flooding of the section, the volume reduction to less than 10%. This would cause the buoy to sink few meters with several meters of reserve buoyancy still available.
15
The mooring line is an S shape slack mooring usually employed to moor surface buoys in deep ocean. The basic configuration of this type of moorings consists in a heavy upper part whereas the lower part is buoyant or supported by glass balls to avoid possible piling on the ocean floor. The slack configuration ensures that the surface buoy is able to withstand even strong transversal thrusts, without sinking.
20
More in detail, the features of the W1-M3A system can be outlined as follows:
– location offshore and on a deep site, being about 64 Km far from the nearest coast
of La Spezia, 73 Km far from Genoa, and on a 1377 m seabed;
– capability of measuring a complete set of meteorological parameters; – capability of measuring physical parameters of the sea down to about 50 m;
25
– capability of measuring physical and chemical properties of the sea water by
means of a multiparametric device close or on the damping disk of the buoy, i.e. 1409
OSD
3, 1399–1440, 2006 The M3A multi-sensor buoy network of the Mediterranean Sea K. Nittis et al. Title Page Abstract Introduction Conclusions References Tables Figures J I J I Back Close Full Screen / EscPrinter-friendly Version Interactive Discussion at a favorable depth for measuring, for instance, the maximum of fluorescence;
– transmission of acquired data in NRT to the station ashore by means of a
dedi-cated satellite phone link;
– on-line application of data quality control procedures on the acquired data and
their forwarding to the data management centre.
5
All the equipment on board the buoy can be grouped into 4 subsystems:
– the control and acquisition module devoted to the control of all the equipment
installed onboard and to the acquisition of the measurements;
– the communication system providing the necessary tools for exchanging
com-mands, information, and data with the remote system ashore;
10
– the power supply system charging the battery pack that powers all the electronic
devices onboard the buoy;
– the instrumental payload including all the sensors installed on the buoy.
The core of the control and acquisition system is a National Instruments Compact Fieldpoint intelligent controller for reliable distributed or stand-alone deployment with
15
industrial ratings for what concern temperature range, shocks and vibration. Several acquisition and conditioning boards can be connected to the controller through a back-plane.
The W1-M3A system employs a Globalstar duplex satellite data modem that provides two-way business-to-business Internet communications with land or marine based
20
equipment via direct dial-up or direct internet access to communicate with the receiving station ashore. Globalstar is a low Earth orbit satellite constellation for telephone and low-speed data communications, similar to (and competing with) the Iridium satellite system.
OSD
3, 1399–1440, 2006 The M3A multi-sensor buoy network of the Mediterranean Sea K. Nittis et al. Title Page Abstract Introduction Conclusions References Tables Figures J I J I Back Close Full Screen / EscPrinter-friendly Version Interactive Discussion All the equipment onboard the buoy is powered by a combination of solar and wind
energy that charges a 12 V @ 180 AH battery pack. Eight photovoltaic panels having a typical peak power of 60 Watt each and arranged around the buoy upper part together with a wind generator provide the current. The charge of the battery is controlled by four shunt regulators each one acting on a couple of panels and a regulator for the
5
wind generator.
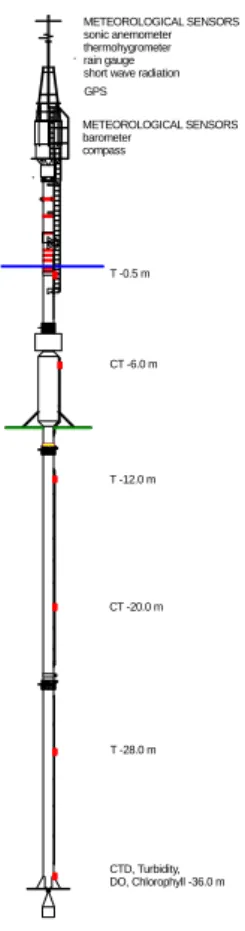
The scientific payload onboard the buoy can be grouped into three classes depend-ing on the type of measurements produced and/or on their position along the buoy’s body. Fig. 4 shows the technical drawing of the buoy with the notes about the onboard equipment. The meteorological set composed by precision spectral pyranometer, wind
10
speed and direction sensors (mounted at about 14.60 and 14.40 m over mean sea level, respectively), two piezoelectric barometers, two thermo-hygrometers (one in a standard shield, the other in a ventilated shield). Marine sensors set includes six tem-perature sensors positioned along the buoy body (one on the sea surface, the others at –6.0, –12.0, –20.0, –28.0, –36.0 m respectively) and three echosounders at about
15
–9.4 m on 120◦supports measure the distance from the sea surface above. The wave form on the sea surface is constructed from data obtained with these sensors after buoy response to the sea and buoy motion measured by other sensors are accounted for. A multiparametric probe (CTD plus turbidity, dissolved oxygen, chlorophyll) is in-stalled at about –36.0 m depth close to the damping disk of the buoy whereas other
20
2 temperature-conductivity sensors are placed at –6.0 and –20 m depth, respectively. The last set of sensors includes a double axis inclinometers, a compass, and a GPS receiver. The power supply system is monitored by a voltage sensor indicating bat-tery charge and by a group of electronic current detector sensors measuring power generated by each photovoltaic panel and the wind turbine.
25
Since the acquisition system was designed with some modularity, other types of measurements could be acquired provided the feasibility of the sensor’s installation onboard the buoy, the availability of the necessary power supply and the capacity of measuring and treating the type and the amount of data extracted by the sensor.
OSD
3, 1399–1440, 2006 The M3A multi-sensor buoy network of the Mediterranean Sea K. Nittis et al. Title Page Abstract Introduction Conclusions References Tables Figures J I J I Back Close Full Screen / EscPrinter-friendly Version Interactive Discussion
3 Data transmission and quality control
The NRT quality control procedures defined as Data Quality Control Level 0 and hereafter named DQCL0, are those developed during the MFSPP and MF-STEP projects (documentation available through http://www.poseidon.ncmr.gr/M3A/
Documents/M3A-documents.htm or through the MERSEA sitehttp://www.mersea.eu.
5
org/Insitu-Obs/DQCL0 M3A.pdf). The aim of these procedures is to assure the quality of the data by means of the application of a series of tests to identify erroneous data, establish, and identify corrupted data and to point out malfunction of sensors. These tests consist of checks on individual or consecutive data points and can be classified in four types: 1) instrument errors, 2) physical limits of the data, 3) rate of change, and
10
4) stationarity of data, i.e.
1. the values have to lie within the instruments ranges, 2. the values have to lie within the prefixed physical ranges, 3. the values have to respect a rate of the change in the time,
4. the values cannot be constant over a time period relevant to the specific
parame-15
ter.
Each check is performed in sequence and only if the previous one has been success-ful. Each of the automatic quality control checks generates a flag when the check fails and the flag is ascribed to the data point failing the check. Correct data are considered those having passed successfully all the tests. No editing of invalid data or replacement
20
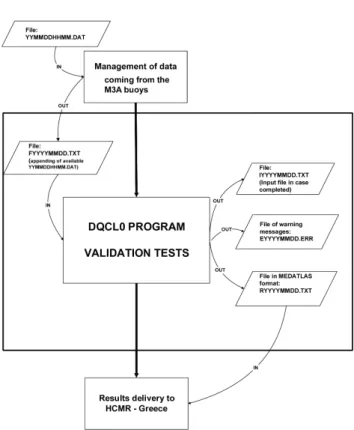
of missing values is performed. The result of this procedure is an output using the ME-DATLAS data format and named by a suffix NR followed by the date of measurement: NR20040701.TXT (Fig. 5)
The DQCL0 is activated by an automatic procedure, running on a computer of each centre: HCMR (Athens–Greece), OGS (Trieste–Italy) and CNR (Genoa–Italy) that
25
daily:
OSD
3, 1399–1440, 2006 The M3A multi-sensor buoy network of the Mediterranean Sea K. Nittis et al. Title Page Abstract Introduction Conclusions References Tables Figures J I J I Back Close Full Screen / EscPrinter-friendly Version Interactive Discussion
– collects files data coming from the corresponding M3A buoy, – prepares input file for the data quality control program,
– activates the data quality control program providing the day’s date,
– transmits the results (MEDATLAS file) to the collection centre: HCMR Athens–
Greece.
5
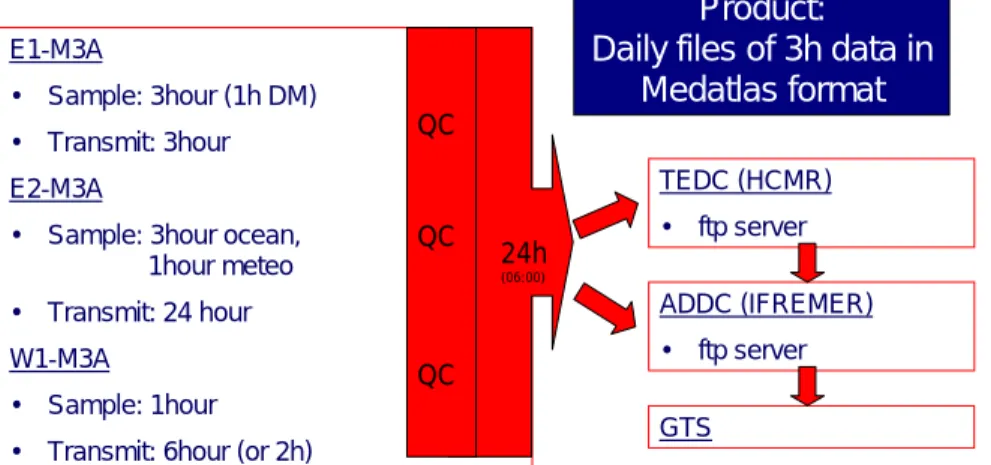
The sampling interval and type of measurement is different for each system / instru-ment (one hour in most cases) but the assembly of data by the control unit of each surface buoy and the consequent transmission is carried out every three hours (Fig. 6). The final product is one file per day containing all the 3-hourly data. More detailed information can be found in Cardin and Perini (2005).
10
An automated ftp procedure has been set up for daily transfer of the data to the Cori-olis data centre (http://www.ifremer.fr/coriolis/) and inclusion in the central MFSTEP and MERSEA information systems. The same procedure is followed for the delayed mode data received after each maintenance mission and after the completion of post calibration procedures (mainly applied on the chlorophyll-a and dissolved oxygen data)
15
approximately every two months. The complete data records are stored by the instru-ment’s loggers and are downloaded during each maintenance.
In order to handle the amount of data transmitted from the buoy to the fixed station either through the Iridium/Globalstar satellite system or GSM network, a simple UNIX program has been created and inserted in a cron-tab file. This program performs the
20
following steps:
– it verifies daily the existence of all synoptic files and their completeness – if this is true, an unique file containing all the data is created;
– this file together with the one of the previous day is used as input files for the NRT
quality control (DQCL0) procedure;
25
OSD
3, 1399–1440, 2006 The M3A multi-sensor buoy network of the Mediterranean Sea K. Nittis et al. Title Page Abstract Introduction Conclusions References Tables Figures J I J I Back Close Full Screen / EscPrinter-friendly Version Interactive Discussion
– after the DQCL0 procedure is applied and no errors are detected an output file in
Medatlas format is created;
– subsequently the DQCL0 data files are transmitted to HCMR via an automatic ftp
procedure from the two buoys (E2-M3A and W1-M3A);
– an email message containing the log file is send to the data transmission
respon-5
sible scientists .
4 Operation during 2004–2006
During 2004 the three buoy systems have been upgraded to the M3A configuration and prepared to contribute to the MFSTEP TOP phase (Targeted Operational Period, September 2004–March 2005). The network operation was sustained after the TOP
10
period of MFSTEP while since September 2005 it contributes to the observing system of the MERSEA project (Desaubies et al., 2005). The operation and performance of the three systems until the end of 2005 is described in the following paragraphs. 4.1 E1-M3A operation
The E1-M3A system was deployed by R/V Aegaeo in the south Aegean (Cretan) Sea
15
21/7/2004. The system operated during the TOP phase of MFSTEP and two mainte-nance cruises were carried out during that period (November 2004 and March 2005). A series of shorter maintenance visits aiming to fix system malfunctions were also performed using a small speed boat that allows easy approach to the surface buoy.
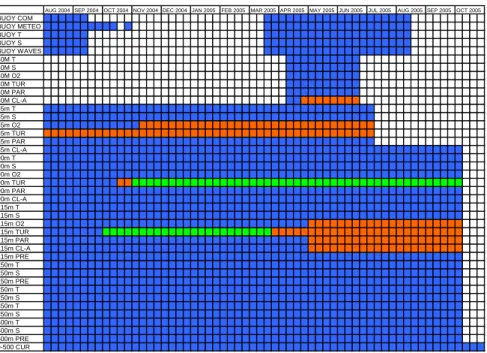
The overall performance of the E1-M3A system up to October 2005 is schematically
20
summarized in Fig. 7. The main problem during that period was the performance of the surface buoy that discontinued its operation between September 2004 and March 2005 and from August 2005 onwards. This did not allow collection of surface and me-teorological data during these periods and delivery of NRT data. However, the “deep”
OSD
3, 1399–1440, 2006 The M3A multi-sensor buoy network of the Mediterranean Sea K. Nittis et al. Title Page Abstract Introduction Conclusions References Tables Figures J I J I Back Close Full Screen / EscPrinter-friendly Version Interactive Discussion sensors of lines1-2-3 continued their operation and their data were made available
in delayed mode. The first malfunction of the buoy was due to failure of the central CPU (based on a i386 processor). It was detected in mid September 2004 and an emergency visit with speed boat was carried out on 19 September 2004. Since the problem could not be solved on-site, the surface buoy was recovered and replaced
5
by a spare one (minimum configuration: light, reflector etc.) during the maintenance cruise of November 2004. Following a replacement of the CPU the surface buoy was re-deployed during the next maintenance cruise of March 2005. The NRT delivery of data continued up to mid August 05 when the operation of the surface buoy was again halted due to malfunction of the buoy energy supply system.
10
Secondary problems during the same period were: a) the operation of the 40m CTD probe of line 2 due to power problems; during the first two maintenance visits it was not able to distinguish if the problem was due to badly preserved batteries or energy over-consumption and, thus, it was decided to replace the batteries and continue to operation of the probe; during the last maintenance cruise of November 2005 it was
15
decided to remove the specific device and send it to the manufacturer for further in-spection and repair b) the dissolved oxygen and turbidity sensors of the 65m probe did not provide reliable data (out of range, repeating spikes). The problem persisted after the usual maintenance of the sensors and is most likely attributed to material failure (connectors) c) the same applied for the dissolved oxygen, turbidity, PAR and
20
chlorophyll-a sensors of the 115 m probe after May 2005.
The overall performance of the E1-M3A system has been improved compared to its pilot operation in 2000–2001 (Nittis et al., 2003) mainly because the antifouling methods improved the quality of biochemical data. However the instrumentation of the system is ageing and, thus, the number of failures that need major and/or factory repair
25
is increasing. A major upgrade or replacement of system components is, therefore, necessary in the near future.
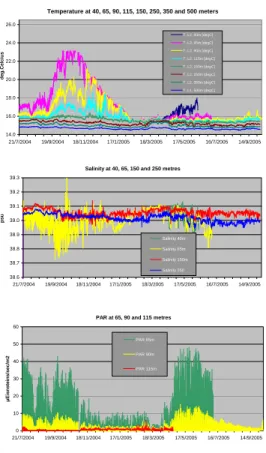
A subset of the data collected by E1-M3A during the 15 months operation under MF-STEP is presented in Fig. 8. A comparison between the temperature and salinity time
OSD
3, 1399–1440, 2006 The M3A multi-sensor buoy network of the Mediterranean Sea K. Nittis et al. Title Page Abstract Introduction Conclusions References Tables Figures J I J I Back Close Full Screen / EscPrinter-friendly Version Interactive Discussion series of 2004-2005 and those of 2000–2001 can be used to estimate the interannual
variability of water masses and their vertical structure in the Cretan Sea (the tempera-ture and salinity scale used in Fig. 8 is the same used by Nittis et al., 2006). The upper 100 m layer (seasonal thermocline for the Cretan Sea) of summer 2004 is significantly warmer compared to 2000 (by 3–4◦C) and 2005 (approximately 1–2◦C for June–July
5
for which complete timeseries are available for both years). The variability is strong even in the 100–150 m layer that presents a remarkable warming in 2001, possibly at-tributed to intensification or westward displacement of the anticyclonic component of the dipole that controls the circulation in the Cretan Sea (Cardin et al., 2003). Dur-ing the approximately 4 years of E1-M3A operation, deep mixDur-ing has been recorded
10
only during winter 2005. The south Aegean Sea is an area when the warm and saline Cretan Intermediate Water (CIW) is formed during wintertime mixing up to 300–500 m (Theocharis et al., 1999). Such mixing event has been recorded during late winter 2005 (mid March to mid April, Fig. 8) down to a depth of 350 m.
Interannual changes of the salinity structure can be detected in both the subsurface
15
and intermediate layers (Fig. 8b). The low salinity subsurface signal of the Atlantic Wa-ter (AW) is much weaker in 2004–2005 compared to the 2000–2001 period (although the 40 m timeseries is missing in the second period); the salinity minimum in 2004 is 38.75–38.80 compared to 38.6 in 2000–2001. The CIW salinity maximum is observed in 2000 at a depth of 250 m while during the other 3 years it appears to be at 150 m
20
and with slightly increased values (39.05–39.1). Finally, the system was able to collect long time series of PAR data (Fig. 8c) offering a valuable quantification of the diurnal, synoptic and seasonal variability of light availability in the Cretan Sea euphotic zone. 4.2 E-M3A operation
The E2-M3A buoy was put in operation in early 2004. During January 2004 the buoy
25
was transferred from Trieste to Bari harbour and on 16/2/2004 the buoy was deployed at the site selected for the TOP period (Southern Adriatic Sea, offshore Brindisi, 1050 m depth) and mission started. In this configuration the scientific payload included the
OSD
3, 1399–1440, 2006 The M3A multi-sensor buoy network of the Mediterranean Sea K. Nittis et al. Title Page Abstract Introduction Conclusions References Tables Figures J I J I Back Close Full Screen / EscPrinter-friendly Version Interactive Discussion meteorological station and the hull-mounted CT. The buoy operated with full reliability
until August 2004, when the mission was stopped to allow the recovery of the buoy and its transport to the port of Bari for the system upgrade towards the complete M3A configuration. During the mission, all scientific data were downloaded from the buoy via daily interrogation from Tecnomare (system manufacturer) and then disseminated
5
by OGS on a weekly basis through the sitehttp://doga.ogs.trieste.it/boma mfstep/. Contemporary, tests were performed in laboratory to verify the operation of the new hardware and software implemented on the buoy so as to manage the additional func-tionalities imposed by the E2-M3A configuration: management of CTD chain and the Nutrient analyser, second telemetry allowing automatic daily transmission of data to
10
OGS ftp server and additional status monitoring sensors.
Being the buoy physically not available (as under operation at sea), these tests were carried out connecting the new subsystems to a second data acquisition and control unit, specifically developed by Tecnomare for this purpose. In this way the buoy oper-ation could be simulated and the new functionalities verified. These tests were carried
15
out in Tecnomare workshop, during the period January–August 2004, in parallel with the basic functional tests.
One important part of the test was focused on the new scientific payload to be added on the buoy basic configuration, and in particular on the Nutrient analyser requiring a dedicated activity to define its correct set-up, validate its operation and ensure optimal
20
interface with the water sampling system implemented on E2-M3A. This activity started on April 2004, with some delay with respect to the project schedule, due to the neces-sity to send the instrument to the manufacturer for some upgrade and servicing work. Test on the CTD probes were quite simpler, being the sensors “off-the-shelf” and not requiring any specific set-up.
25
The system was re-deployed at the original site at the beginning of September and a new mission started. The first week the system worked perfectly showing promising data (Fig. 9). During the last week of September, following a strong storm, major fail-ures to some sensors were observed (CT sensor chain failure on 24 September 2004,
OSD
3, 1399–1440, 2006 The M3A multi-sensor buoy network of the Mediterranean Sea K. Nittis et al. Title Page Abstract Introduction Conclusions References Tables Figures J I J I Back Close Full Screen / EscPrinter-friendly Version Interactive Discussion 10:00:00 LT for inductive cable breakage; meteorological station failure on 24
Septem-ber 2004, 23:00:00 LT, reason still unknown). Connection to the buoy was however maintained, allowing continuous monitoring of buoy position and status parameters. In the subsequent hours, the buoy changed position and the reason is still unknown. On 25 September 2004 the mission was stopped and the buoy put in “idle mode” waiting
5
maintenance intervention. Tecnomare tried to reset the connections with the buoy sen-sors but with no success. On 17 October 2004 it was discovered that the buoy was drifting away from the mooring position. On 19 October 2004 the buoy was found and towed into Bari harbour.
The results of inspections of the joint OGS and Insurance company team were the
10
following: the meteorological station was lost while the entire underwater sensor line (CTD’s and pumping tubes) was safe except for the CT installed at the buoy. The mooring cable was cut at the depth of 300 m, which is difficult to explain.
The short operation of the E2-M3A during the above described period and the anal-ysis of the data allowed:
15
1. To verify that most of the sensors were correctly operating, i.e.:
– The automatic daily data transmission from the buoy to the OGS ftp server; – The automatic transmission of status messages via e-mail;
– The status parameters (battery voltage, current consumption etc.) inside the
ex-pected ranges;
20
– The operation of the CTD chain.
2. To identify some problems:
– The conductivity sensor of the CTD mounted at 100 m gave false readings; – The CT mounted at buoy hull did not respond;
OSD
3, 1399–1440, 2006 The M3A multi-sensor buoy network of the Mediterranean Sea K. Nittis et al. Title Page Abstract Introduction Conclusions References Tables Figures J I J I Back Close Full Screen / EscPrinter-friendly Version Interactive Discussion
– All meteorological data, apart of the calculated sustained and gust values, were
saved in a wrong format in the hourly message (due to a bug in the data acquisi-tion software, identified and corrected).
3. To verify the success of the operation of the nutrient analyser integrated to the automatic water sampling system:
5
– The measurements at 5 depths every 12 h (due to the refresh and cycles shorter
interval of measurements is not possible);
– The reagents stored in a fridge unit to increase autonomy;
– Apart of the first profile, there was a substantial stationarity of the nitrate levels.
4.3 W1-M3A operation
10
The main upgrade of the onboard system from the ODAS Italia-1 configuration to the M3A one occurred during a cruise in September 2004. Since then, the system oper-ated continuously during and after the MFSTEP TOP phase and many maintenance missions were carried out with small and fast boats (November 2004, January 2005). After the MFSTEP TOP phase, another cruise was performed on April 2005 and other
15
daily maintenance visits aiming to fix system malfunctions (affecting both the onboard controller and the sensors) and/or to perform standard operations were carried out in June, July, and August 2005.
After each mission a report is usually created detailing the operation carried out onboard and summarizing the problems faced and the solutions/decisions applied.
20
The overall performance of the W1-M3A system in terms of acquired and available data records up to the end of December 2005 is schematically summarized in Fig. 10 that shows the percentage of available data records per month.
During the MFSTEP TOP period and up to mid April 2005 the performance of the system was heavily affected by a power supply failure combined with a controller
prob-25
lem that provoked the switch off of the acquisition system without making it able to 1419
OSD
3, 1399–1440, 2006 The M3A multi-sensor buoy network of the Mediterranean Sea K. Nittis et al. Title Page Abstract Introduction Conclusions References Tables Figures J I J I Back Close Full Screen / EscPrinter-friendly Version Interactive Discussion properly reboot to start again the normal procedures. After the solution was found by
using a more stable and powerful power converter the on board acquisition didn’t suf-fer any more from that problem and the percentage of acquired data raised up again almost to the maximum as expected and desired. Few missing records during the suc-cessive months are due to the maintenance activities on board the buoy for which the
5
interruption of the acquisition service was necessary.
As an example of the data acquired by the W1-M3A system, Fig. 11 shows the temperature profiles measured during 2005. From end of June up to the end of July only the surface sensor was in place since the others instrument were removed for calibration purposes.
10
It is worth of evaluating the performance of the W1-M3A system also for what con-cern the communication system performance. Especially for operational systems, like MFSTEP and MERSEA are, the time delay between the acquisition of the data and its availability for the assimilation into the models is particularly important. In the same way, the time delay between the creation of the data record in the remote system and
15
its availability in the station ashore for further processing, QC, and dissemination is a meaningful indicator for the performance of the overall observing system.
In the W1-M3A system, a data record including all the acquired information of the previous hour is created at about minute 29 of each hour. As an example, the data file 03061500.dat refers to June 3 at 15:00 UTC and contains measurements collected
20
from 14:30:00 up to 15:29:00 UTC. A transmission window is usually defined from minutes 35 up to 45 of each hour (or every two hours depending on the configuration) and during this period of time the transmission system sends the available data records to the receiving station ashore.
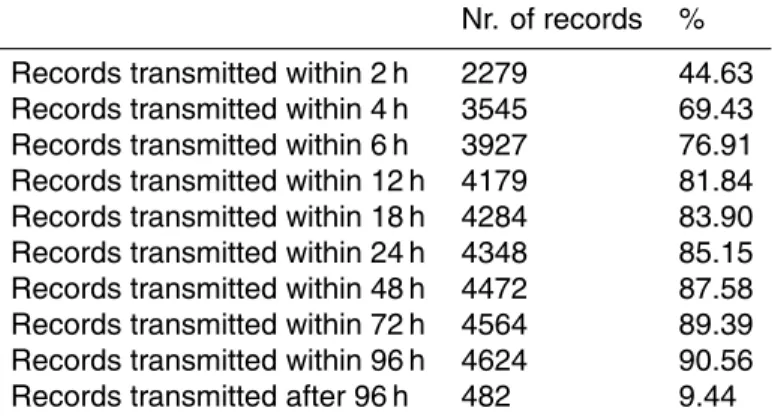
Table 2 shows the percentage of the data records available for further processing
25
phases at the station ashore at fixed intervals: slightly less than 45% of records are available within 2 h, whereas more than 80% are available within 12 h. It has to note that these statistics take also into account those files whose reception was greatly delayed not due to problem or malfunctions in the remote system at sea but for problems in the
OSD
3, 1399–1440, 2006 The M3A multi-sensor buoy network of the Mediterranean Sea K. Nittis et al. Title Page Abstract Introduction Conclusions References Tables Figures J I J I Back Close Full Screen / EscPrinter-friendly Version Interactive Discussion station ashore often due to the accidental switch off of the computer during weekends
or vacations.
The overall yearly success rate in collecting and transferring data from the onboard acquisition system was about 58.5% in 2004 and 74.6% in 2005. These poor per-centages have mainly to be ascribed to the difficulty in recovering from an onboard
5
system failure when it occurs during bad weather sea condition periods making for us impossible to reach the buoy from the mainland by means of small boat.
Also the duration of each data transfer and the available baud rate are important parameters to assess the performance of the W1-M3A observing system, especially since it directly affects the cost to be sustained to efficiently operate the system. Of
10
course they depend on the quality itself of the satellite transmission channel and on the size of the information to be transferred that usually weights from about 13 up to 17 KB in the actual configuration. The nominal baud rate of the Globalstar system is 9.6 kps but a more conservative rate of about 7 Kbps is suggested to be accounted for. Our estimates are substantially in agreement with these specifications reaching
15
an average value close to 6 Kbps. The remote system placed 10 648 phone calls but only for 5564 events (52.25%) there was a real connection between the remote and the ashore systems: these numbers obviously take into account the situations in which the station ashore was not ready to received the data (i.e., modem or PC switched off) as well as the cases in which the connections were not established due to a poor
20
quality of the transmission channel or the two modems failed to positively negotiate the communication. In case of connection between the two systems, there was a successful data transmission in 4361 cases (78.38%). In the remaining cases the communication was lost during the connection. The average duration of a connection is about 51.30 s with an average cost per connection of 0.86+ VAT.
25
OSD
3, 1399–1440, 2006 The M3A multi-sensor buoy network of the Mediterranean Sea K. Nittis et al. Title Page Abstract Introduction Conclusions References Tables Figures J I J I Back Close Full Screen / EscPrinter-friendly Version Interactive Discussion
5 Conclusions and future plans
The MFSTEP project developed the basis for long-term, coordinated operation of multi-sensor timeseries stations in the Mediterranean Sea. Building on the experience of the prototype M3A system’s operation in the Eastern Mediterranean during 2000–2001 and investing on ongoing national efforts for operational monitoring, the system has
5
been expanded with two more stations in the Central and Western Mediterranean Sea. The strategy to upgrade existing monitoring platforms reduces the overall development cost and supports the sustainability of the network in the long term.
The three systems have several differences, especially in terms of design and tech-nological characteristics, but share the same sampling strategy, quality control and data
10
management procedures. Two of the systems focus on biochemical processes in the euphotic zone, in support of regional pre-operational ecosystem models’ development (Triantafyllou et al., 2003) while the third one is focusing on air-sea interaction pro-cesses. The subsurface and/or upper thermocline physical data (temperature, salinity) of the three stations are of the same quality, allowing future inter-comparison studies on
15
basin scale processes, such as interannual variability of ocean dynamics in response to large scale atmospheric forcing.
Overall, and despite the E2-M3A accident and malfunctions of individual compo-nents, the M3A network has managed to provide high quality and long time series for most of the targeted parameters. The antifouling methods and quality assurance
20
procedures tested by the E1-M3A system have significantly improved the quality of op-tical measurements, especially for chlorophyll-a and light attenuation measurements that had the most important problems during the pilot operation (2000–2001). It has been, however, proved that the antifouling methods based on bromine have a limited duration (∼3 months) and additional methods should be considered if a longer
main-25
tenance time interval is desired. The innovative pumping system and the analytical apparatus used by the E2-M3A station had a good performance, allowing the auto-matic collection, for the first time to our knowledge, of nitrate vertical profiles from an
OSD
3, 1399–1440, 2006 The M3A multi-sensor buoy network of the Mediterranean Sea K. Nittis et al. Title Page Abstract Introduction Conclusions References Tables Figures J I J I Back Close Full Screen / EscPrinter-friendly Version Interactive Discussion open sea buoy. Even though this station functioned less than a month in the complete
E2-M3A configuration, it showed to be reliable in providing valid data. The meteorolog-ical and surface temperature/salinity long time series collected during the first part of 2004 (test phase) made possible comparison between in-situ data models results, and allowed detection of synoptic variability mostly missed during the low resolution
mon-5
itoring. The W1-M3A system showed to be able to collect reliable data for long time periods with reasonable costs and sustainable maintenance activities. All the different modules constituting the observing system have been tested and also the processing chain have been validated allowing the W1-M3A system to be the first Mediterranean open-sea oceanographic buoy to regularly report its data into the GTS.
10
The future plans include consolidation of the network operation, upgrades to improve its performance and coordination with other European and Global networks. For the E1-M3A system the main problems are related to the operation of the surface buoy that has already exceeded it expected life time (>13 years). Thus, its replacement is the main priority in order to sustain a long term operation with NRT delivery of data.
15
A major upgrade is planned for 2006/2007 including: a) replacement of the surface buoy by a SeaWatch or Wavescan type buoy compatible with the POSEIDON network of the Aegean Sea (Nittis et al., 2005), b) use of a simplified single mooring config-uration c) use of inductive data transfer for all instruments/sensors d) use additional antifouling methods for optical sensors, mainly based on mechanical shutters.
Up-20
grade (a) is mandatory for the above described reasons and will guarantee integration of E1-M3A under the POSEIDON system’s operational scheme, thus decreasing the costs (especially on ship time and personnel) and increasing the efficiency. Upgrades (b) and (c) are expected to reduce the system failures, especially related to internal data transmission (between E1-M3A sub-systems). These upgrades are now possible
25
since the technology for inductive data transfer has been recently available for almost all instruments/sensors (this was not the case in 1998 when the original system design was decided). Upgrade (d) is also now possible due to technological developments on antifouling methods for optical sensors that were recently made available to the market.
OSD
3, 1399–1440, 2006 The M3A multi-sensor buoy network of the Mediterranean Sea K. Nittis et al. Title Page Abstract Introduction Conclusions References Tables Figures J I J I Back Close Full Screen / EscPrinter-friendly Version Interactive Discussion The E2-M3A system has only recently recovered from the 2004 accident and entered
into a pre-operational phase. Up to now, the location of the system as well as the dimension of the surface buoy proved to be very expensive considering the financial resources available. Because of this, a new surface buoy and system configuration will be introduced with the aim of reducing the cost of maintenance.
5
The ODAS Italia-1 buoy benefited from the upgrade to the M3A configuration, hence becoming the W1-M3A system, in terms of data acquisition efficiency and measure-ments overall quality. The operation of such an offshore observing system for a long and continuous period of time is itself a challenge not only for the costs (that are gen-erally affordable) but above all for the commitment related to its maintenance since it
10
implies the execution of regular missions that, unfortunately, can be carried out only when meteorological and sea conditions allow for them.
The M3A network is already part of the MERSEA ocean observing and forecasting system which is currently the main marine component of GMES (Global Monitoring for Environment and Security, http://www.gmes.info). Through this project the M3A
net-15
work is coordinated with the ANIMATE network of the Atlantic (Send et al., 2003) form-ing an important component of the European contribution to the Global “OceanSites” network of timeseries stations (http://www.oceansites.org).
OSD
3, 1399–1440, 2006 The M3A multi-sensor buoy network of the Mediterranean Sea K. Nittis et al. Title Page Abstract Introduction Conclusions References Tables Figures J I J I Back Close Full Screen / EscPrinter-friendly Version Interactive Discussion
Acknowledgements. The work was carried out in the framework of the projects: Mediterranean
Forecasting System – Towards Environmental Predictions (MFSTEP, EVK3-CT-2002-00075) and Marine EnviRonment and Security for the European Area (MERSEA-IP, AIP3-CT-2003-502885). We acknowledge the support of the European Commission DG Research that fi-nanced the projects and the General Secretary of Research and Technology of the Hellenic
5
Ministry of Development for co-financing.
References
Astraldi M., Gasparini, G. P., Manzella, G. M. R., and Hopkins, T.: Temporal variability of cur-rents in the eastern Ligurian Sea, J. Geophys. Res., 92(C2), 1515–1522, 1990.
Astraldi, M. and Gasparini, G. P.: The seasonal characteristics of the circulation in the north
10
Mediterranean basin and their relationship with the atmospheric conditions, J. Geophys. Res., 97(C6), 9531–9540, 1992.
Bozzano, R., Siccardi, A., Schiano, M. E., Borghini, M., and Castellari, S.: Comparison of ECMWF surface meteorology and buoy observations in the Ligurian Sea, Ann. Geophys., 22, 317–330, 2004.
15
Berteaux, H. O.: Buoy Engineering, John Wiley & Sons, 319, 1976.
Cardin, V., Gacic, M., Nittis, K., Kovacevic, V., and Perini, L.: Sub-inertial variability in the Cretan Sea from M3A buoy, Ann. Geophys., 21, 89–102, 2003.
Cardin, V. and Perini, L.: Data quality control procedures applied to the M3A buoys, OGS Technical Report # 27 dd. 24/03/2005 oga18, 45, 2005.
20
Cavaleri, L.: The CNR meteo-oceanographic spar buoy, Deep-Sea Research, 31, 427–437, 1984.
Chiswell, S. M. and Lukas, R. : The Hawaii Ocean Time-series (HOT), EOS, Transactions of the American Geophysical Union, 71, 1397, 1990.
Desaubies, Y. and the MERSEA Consortium: The MERSEA project: Development of a
Euro-25
pean system for operational monitoring and forecasting of the ocean physics, biogeochem-istry and ecosystems, on Global and Regional scales, Abstracts Book of 4th EuroGOOS Conference, 6–9 June 2005, Brest (available from IFREMER), pp 194, 2005.
Dickey, T., Frye, D., Jannasch, H., Boyle, E., Manov, D., Sigurdson, D., McNeil, J., Stramska,
OSD
3, 1399–1440, 2006 The M3A multi-sensor buoy network of the Mediterranean Sea K. Nittis et al. Title Page Abstract Introduction Conclusions References Tables Figures J I J I Back Close Full Screen / EscPrinter-friendly Version Interactive Discussion
M., Michaels, A., Nelson, N., Siegel, D., Chang, G., Wu, J., and Knap, A.: Initial results from the Bermuda Testbed Mooring program, Deep-Sea Res. I, 45, 771–794, 1998.
Gaˇci´c, M., Civitarese, G., Miserocchi, S., Cardin, V., Crise, A., and Mauri, E.: The open-ocean convection in the southern Adriatic: A controlling mechanism of the spring phytoplankton bloom, Cont. Shelf Res., 22, 1897–1908, 2002.
5
Glenn, S. M., Dickey, T., Parker, B., and Boicourt, W.: Long-term real-time coastal ocean ob-servation networks, Oceanography, 13(1), 24–34, 2000.
McPhaden, M. J., Busalacchi, A. J., Cheney, R., Donguy, J. R., Gage, K. S., Halpern, D., Ji, M., Julian, P., Meyers, G., Mitchum, G. T., Niiler, P. P., Picaut, J., Reynolds, R. W., Smith, N., and Takeuchi, K.: The Tropical Ocean-Global Atmosphere (TOGA) observing system: A decade
10
of progress, J. Geophys. Res., 103, 14 169–14 240, 1998.
Nittis, K., Tziavos, C., Thanos, I., Drakopoulos, P., Cardin, V., Gacic, M., Petihakis, G., and Basana, R.: The Mediterranean Moored Multi-sensor Array (M3A): System Development and Initial Results, Ann. Geophys., 21, 75–88, 2003.
Nittis, K., Perivoliotis, L., Ballas, D., Soukissian, T., Papadopoulos, A., Georgopoulos, D.,
15
Mallios, A., Korres, G., Triantafyllou, G., Pollani, A., Zervakis, V., Papathanassiou, V., and Chronis, G.: POSEIDON II: A second generation monitoring and forecasting system for the Eastern Mediterranean, Abstracts Book of 4th EuroGOOS Conference, Brest, June 2005, pp 207, 2005.
Nittis, K., Perivoliotis, L., Korres, G., Tziavos, C., and Thanos, I.: Operational monitoring and
20
forecasting for marine environmental applications in the Aegean Sea, Environmental Mod-elling and Software, (21), 243–257, 2006.
Petihakis, G., Drakopoulos, P., Nittis, K., Zervakis, V., Christodoulou, C., and Tziavos, C.: M3A system (2000–2005) – operation and maintenance, Ocean Sci., accepted, 2006.
Pinardi, N. and Flemming, N. C.: The Mediterranean Forecasting System Science Plan,
Eu-25
roGOOS Publications No. 11, Southampton Oceanography Centre, Southampton, ISBN 0-904175-35-9, 48, 1998.
Pinardi, N., Allen, I., Demirov, E., De Mey, P., Korres, G., Le Traon, P.-Y., Maillard, C., Manzella, G., and Tziavos, C.: The Mediterranean ocean forecasting system: first phase of implemen-tation (1998–2001), Ann. Geophys., 21, 1–18, 2003.
30
Pinardi, N. and MFSTEP partners: Mediterranean Forecasting System Toward Environmental Prediction (MFSTEP): Status of Implementation, Abstracts Book of 4th EuroGOOS Confer-ence, 6–9 June 2005, Brest (available from IFREMER), 112, 2005.
OSD
3, 1399–1440, 2006 The M3A multi-sensor buoy network of the Mediterranean Sea K. Nittis et al. Title Page Abstract Introduction Conclusions References Tables Figures J I J I Back Close Full Screen / EscPrinter-friendly Version Interactive Discussion
Send, U., Edwards, M., Hydes, D., Karstensen, J., Lampitt, R., Llinas, O., Muller, T., Olafsson, J., Ratmeyer, V., and Valdimarsson, H.: The Animate Team: Real-time interdisciplinary time-series observations in the Northeast Atlantic, EGS–AGU–EUG Joint Assembly, Abstracts from the meeting held in Nice, France, abstract#14747S, 6–11 April 2003.
Sparnocchia, S., Schiano, M. E., Picco, P., Bozzano, R., and Cappelletti, A.: The anomalous
5
warming of summer 2003 in the surface layer of the Central Ligurian Sea (Western Mediter-ranean), Ann. Geophys., 24, 443–453, 2006.
Tecnomare: Progetto 3.3.1.5 – Realizzazione di un sistema fisso di monitoraggio di grandi dimensioni – Rapporto finale, Project BOMA, Technical report (internal) A0954-REL-A900-009.0 Tecnomare, 20, 2004.
10
Theocharis, A., Nittis, K., Kontoyiannis, H., Papageorgiou, E., and Balopoulos, E.: Climatic changes in the Aegean Sea influence the Eastern Mediterranean thermohaline circulation, Geophys. Res. Lett., 26, 1617–1620, 1999.
Triantafyllou, G., Petihakis, G., and Allen, J. I.: Assessing the performance of the Cretan Sea ecosystem model with the use of high frequency M3A buoy data set, Ann. Geophys., 21,
15
365–375, 2003.
OSD
3, 1399–1440, 2006 The M3A multi-sensor buoy network of the Mediterranean Sea K. Nittis et al. Title Page Abstract Introduction Conclusions References Tables Figures J I J I Back Close Full Screen / EscPrinter-friendly Version Interactive Discussion
Table 1. E2-M3A Instrumentation.
Parameter Manufacturer Model
Meteorological Measurements at 10 m height
Wind speed and direction RM Young 05106-MA
Pressure sensor RM Young 61202V
Air temperature Rotronic MP-102A-T4-W4W
Humidity Rotronic MP-102A-T4-W4W
Hydrological Measurements at 1 m depth (hull mounted)
Conductivity/Temperature SeaBird SBE-37SI
Hydrological Measurements at 25 m depth
Chlorophyll-a Idromar IM-51 (*)
Turbidity Idromar IM-51 (*)
Nitrate WS EnviroTech NAS-2E (*)
Hydrological Measurements at 50 m depth
Conductivity/Temperature+ pressure SeaBird SBE-16plus+ SBE-5T
Fluorometer SeaBird SCUFA II
Chlorophyll-a Idromar IM-51 (*)
Turbidity Idromar IM-51 (*)
Nitrate WS EnviroTech NAS-2E (*)
Hydrological Measurements at 75 m depth
Conductivity/Temperature SeaBird SBE-16plus+ SBE-5T
Fluorometer SeaBird SCUFA II
Nitrate WS EnviroTech NAS-2E (*)
Chlorophyll-a Idromar IM-51 (*)
Turbidity Idromar IM-51 (*)
Hydrological Measurements at 100 m depth
Conductivity/Temperature SeaBird SBE-16plus+ SBE-5T
PAR Biospherical QSP-2200
Nitrate WS EnviroTech NAS-2E (*)
Chlorophyll-a Idromar IM-51 (*)
Turbidity Idromar IM-51 (*)
Hydrological Measurements at 200 m depth
Conductivity/Temperature+ pressure SeaBird SBE-16plus+ SBE-5T
Dissolved oxygen SeaBird SBE-43
Nitrate WS EnviroTech NAS-2E (*)
Chlorophyll-a Idromar IM-51 (*)
Turbidity Idromar IM-51 (*)
Other type of measurements
Status and Power monitoring (current, battery voltage) Tecnomare Proprietary board
GPS Trimble ACE III
Buoy heading RM Young MP-32000
Buoy attitude (pitch/roll, heading) FSI Ostar Compass
(*) Note: mounted inside the buoy hull and connected to the automatic water pumping system.
OSD
3, 1399–1440, 2006 The M3A multi-sensor buoy network of the Mediterranean Sea K. Nittis et al. Title Page Abstract Introduction Conclusions References Tables Figures J I J I Back Close Full Screen / EscPrinter-friendly Version Interactive Discussion
Table 2. Efficiency of the W1-M3A transmission system expressed in percentage of available
data records within fixed time limits.
Nr. of records %
Records transmitted within 2 h 2279 44.63
Records transmitted within 4 h 3545 69.43
Records transmitted within 6 h 3927 76.91
Records transmitted within 12 h 4179 81.84
Records transmitted within 18 h 4284 83.90
Records transmitted within 24 h 4348 85.15
Records transmitted within 48 h 4472 87.58
Records transmitted within 72 h 4564 89.39
Records transmitted within 96 h 4624 90.56
Records transmitted after 96 h 482 9.44
OSD
3, 1399–1440, 2006 The M3A multi-sensor buoy network of the Mediterranean Sea K. Nittis et al. Title Page Abstract Introduction Conclusions References Tables Figures J I J I Back Close Full Screen / EscPrinter-friendly Version Interactive Discussion
Fig. 1. Location of the M3A moorings in the Mediterranean Sea.
OSD
3, 1399–1440, 2006 The M3A multi-sensor buoy network of the Mediterranean Sea K. Nittis et al. Title Page Abstract Introduction Conclusions References Tables Figures J I J I Back Close Full Screen / EscPrinter-friendly Version Interactive Discussion
Fig. 2. Outline of the E1-M3A system.
OSD
3, 1399–1440, 2006 The M3A multi-sensor buoy network of the Mediterranean Sea K. Nittis et al. Title Page Abstract Introduction Conclusions References Tables Figures J I J I Back Close Full Screen / EscPrinter-friendly Version Interactive Discussion
Fig. 3. Outline of the E2-M3A system.