HAL Id: hal-00298761
https://hal.archives-ouvertes.fr/hal-00298761
Submitted on 30 Aug 2006HAL is a multi-disciplinary open access
archive for the deposit and dissemination of sci-entific research documents, whether they are pub-lished or not. The documents may come from teaching and research institutions in France or abroad, or from public or private research centers.
L’archive ouverte pluridisciplinaire HAL, est destinée au dépôt et à la diffusion de documents scientifiques de niveau recherche, publiés ou non, émanant des établissements d’enseignement et de recherche français ou étrangers, des laboratoires publics ou privés.
Experimental study of fingered flow through initially dry
sand
F. Rezanezhad, H.-J. Vogel, K. Roth
To cite this version:
F. Rezanezhad, H.-J. Vogel, K. Roth. Experimental study of fingered flow through initially dry sand. Hydrology and Earth System Sciences Discussions, European Geosciences Union, 2006, 3 (4), pp.2595-2620. �hal-00298761�
HESSD
3, 2595–2620, 2006 Fingered flow F. Rezanezhad et al. Title Page Abstract Introduction Conclusions References Tables Figures J I J I Back Close Full Screen / EscPrinter-friendly Version Interactive Discussion
EGU
Hydrol. Earth Syst. Sci. Discuss., 3, 2595–2620, 2006 www.hydrol-earth-syst-sci-discuss.net/3/2595/2006/ © Author(s) 2006. This work is licensed
under a Creative Commons License.
Hydrology and Earth System Sciences Discussions
Papers published in Hydrology and Earth System Sciences Discussions are under open-access review for the journal Hydrology and Earth System Sciences
Experimental study of fingered flow
through initially dry sand
F. Rezanezhad1, H.-J. Vogel1,2, and K. Roth1 1
Institute of Environmental Physics, University of Heidelberg, Germany
2
Center of Environmental Research, Leipzig-Halle, Germany
Received: 8 August 2006 – Accepted: 17 August 2006 – Published: 30 August 2006 Correspondence to: F. Rezanezhad ([email protected])
HESSD
3, 2595–2620, 2006 Fingered flow F. Rezanezhad et al. Title Page Abstract Introduction Conclusions References Tables Figures J I J I Back Close Full Screen / EscPrinter-friendly Version Interactive Discussion
EGU Abstract
Water infiltration into coarse textured dry porous media becomes instable depending on flow conditions characterized through dimensionless quantities, i.e. the Bond number and the Capillary number. Instable infiltration fronts break into flow fingers which we investigate experimentally using Hele-Shaw cells. We further developed a light
trans-5
mission method to measure the dynamics of water within flow fingers in great detail with high spatial and temporal resolution. The method was calibrated using x-ray absorp-tion and the measured light transmission was corrected for scattering effects through deconvolution with a point spread function. Additionally we applied a dye tracer to vi-sualize the velocity field within flow fingers. We analyzed the dynamics of water within
10
the finger tips, along the finger core behind the tip, and within the fringe of the fingers during radial growth. Our results confirm previous findings of saturation overshoot in the finger tips and revealed a saturation minimum behind the tip as a new feature. The finger development was characterized by a gradual increase in water content within the core of the finger behind this minimum and a gradual widening of the fingers to a
15
quasi-stable state which evolves on time scales that are orders of magnitudes longer than those of fingers’ evolution. In this state, a sharp separation into a core with fast convective flow and a fringe with exceedingly slow flow was detected. All observed phenomena could by consistently explained based on the hysteretic behavior of the soil- water characteristic and on the positive pressure induced at the finger tip by the
20
high flow velocity.
1 Introduction
Fingered flow refers to an instability of the interface between two immiscible fluids when one invades the other. Early examples were air invading water and water invading oil where the instability results from a difference in the viscosity. More recently, fingered
25
HESSD
3, 2595–2620, 2006 Fingered flow F. Rezanezhad et al. Title Page Abstract Introduction Conclusions References Tables Figures J I J I Back Close Full Screen / EscPrinter-friendly Version Interactive Discussion
EGU
of oil recovery and in the environmental sciences as an instance of preferential flow of water through soil. The latter is of obvious interest for the general understanding of various hydrological aspects including the quantity and quality of groundwater recharge or the efficiency of irrigation. Fingered flow is also of fundamental interest, however, since it challenges our understanding of multiphase flow in porous media.
5
Unstable flow of water during infiltration was first observed by Hill (1952) and has been studied extensively for many years, both experimentally and theoretically. In two-dimensional experiments, measurements of unstable wetting fronts in porous media have been made by making direct visual observation of the flow field through transpar-ent panels (Hill and Parlange,1972;Glass et al.,1989b). Diment and Watson(1985)
10
indicated that a small, uniformly distributed, initial water content damps out the insta-bility observed for dry sand. Glass et al.(1989a) andLiu et al.(1993) found that if the moisture content was spatially variable as a result of an earlier infiltration with fingered flow, the previous finger paths were preserved during subsequent infiltration cycles because of hysteresis in the soil moisture characteristic curve.
15
The current understanding is that fingers develop in coarse-textured media if the driving force, typically gravity, dominates the capillary force. The relative weight of these two forces is given by the Bond number Bo=ρwgd2/σ, where ρw and g are the density of water and the acceleration of gravity respectively, and σ is the surface tension of water. The characteristic length scale d which is related to the size of the
20
pores, indicates that fingers occur only in coarse textured porous media having pores above a critical size. In experiments the fingering phenomena is actually found in granular media with a mean grain size above 0.5–1.0 mm in diameter (Diment and
Watson, 1985; Glass et al., 1989a). It was shown by Flekkoy et al. (2002) that the width of fingers increases with decreasing Bo.
25
DiCarlo(2004) summarized the newer developments which focus on the nature of the saturation overshoot in the finger tip. He worked with light transmission in a nar-row column that corresponds to a one-dimensional system and showed that saturation overshoot is strongest for intermediate fluxes.
HESSD
3, 2595–2620, 2006 Fingered flow F. Rezanezhad et al. Title Page Abstract Introduction Conclusions References Tables Figures J I J I Back Close Full Screen / EscPrinter-friendly Version Interactive Discussion
EGU
Theoretically, mathematical models have been developed to attempt to model the saturation overshoot and it has been shown that this phenomena simply cannot be described by the Richards equation (Eliassi and Glass, 2001; Egorov et al., 2003) and simulation and conceptual models have been used for the mechanisms of finger formation, propagation and persistence in unsaturated porous media and calculating
5
the size and speed of fingered preferential flow (Wang et al.,1998;Jury et al.,2003). Most newer techniques available for transient visualization have been made in Hele-Shaw cells with smooth walls and using the light transmission imaging technique.
Tid-well and Glass (1994) have performed full-field measurements using light transmission image and x-ray film to visualize the transient flow phenomena.
10
Fingered flow occurs in homogeneous coarse grained materials when the infiltration rate is below the saturated hydraulic conductivity (Ks) and gravitational influences on the imbibing solution dominate the forces of capillary. We established such conditions in a Hele-Shaw cell where a layer of fine sand was placed on top of a coarse sand and studied experimentally the flow paths and instabilities of gravity driven fingers through
15
an initially dry porous medium using the light transmission system.
The crucial phenomena for understanding fingering flow are (i) the observed satura-tion overshoot which initializes a finger and (ii) the hysteretic of the soil-water charac-teristic which stabilizes it by dramatically reducing lateral flow.
2 Experimental materials and methods
20
2.1 Laboratory setup and materials
An attractive approach to get a high spatial and temporal resolution of phase saturation is a Hele-Shaw cell. Infiltration experiments were conducted in a 2-D Hele-Shaw cell (160×60×0.3 cm) which is made of two parallel glass plates (8 mm thick attached to an aluminum frame) with a small distance apart and the porous material is placed
25
HESSD
3, 2595–2620, 2006 Fingered flow F. Rezanezhad et al. Title Page Abstract Introduction Conclusions References Tables Figures J I J I Back Close Full Screen / EscPrinter-friendly Version Interactive Discussion
EGU
enough to transmit visible light while the lengths of the other two dimensions are only limited by mechanical stability.
The cell was filled in 4 different layers of dry sand: 5 cm fine sand with grain-size diameter 0.063–0.25 mm as a distribution layer on top, 50 cm structured sand with a grain-size distribution in the range from 0.25 to 1.25 mm in the middle at depth interval
5
between 0.56 and 1.05 m and the same material but previously sieved such that the grains are larger than 0.63 mm to build the two uniform layers adjacent to the middle layer. As a result of the wider grain-size distribution, the middle layer is more heteroge-nous with thin-grained filaments separating coarse-grained regions. It was filled such that grains of different size were allowed to separate during the filling procedure to
10
produce a heterogenous structure of different textures.
The cell was placed between the x-ray source and detector which both moved ver-tically to simultaneous measurements of water saturation inside the cell during the experiment.
At the top, water was applied through 6 drippers at fixed positions and the flux was
15
adjusted by a pump with a constant rate of 1.2 mm min−1. The lower end of the cell was closed. A single outlet, the black dot at the lower left corner (Fig. 1), allows the water and air to leave the cell. The vertical boundaries were closed for water flow. The cell was placed in front of an illumination, from a stable and low temperature light source with four fluorescent lamps that were installed in a wooden box. A homogenous
20
illumination of the entire surface of the Hele-Shaw cell was achieved using a diffusion foil between the lamps and the cell.
The images were recorded immediately after water application using a digital cam-era (Canon, 6.2 MPixel), placed 1.5 m in front of the cell, with spatial resolution of 691×1929 pixel covering the entire cell which gives 0.6 mm2 per pixel resolution. The
25
temporal resolution was 15 s when the fingers were quickly traveling downward includ-ing an exposure time 2 s (aperture F8) and storage of images. Figure1shows a side and front view sketch of the used experimental setup.
After reaching stationary water flow to visualize the velocity field inside the cell, ad-2599
HESSD
3, 2595–2620, 2006 Fingered flow F. Rezanezhad et al. Title Page Abstract Introduction Conclusions References Tables Figures J I J I Back Close Full Screen / EscPrinter-friendly Version Interactive Discussion
EGU
ditional infiltration experiments were performed by using a dye tracer (0.5 g l−1Brilliant blue) which was applied to the almost stationary flow field behind the water infiltration front.
In a separate experiment, the saturated hydraulic conductivity (Ks) of these three types of sands were measured by the falling head method (Klute and Dirksen,1986)
5
using light transmission system. The sand was filled into a small Hele-Shaw cell (30×30×0.3 cm) and was ponded with water. Brilliant blue solution was used as a tracer with very low concentration to better visualization of the water level. At bottom of the cell, water was allowed to drain freely due to gravity. During free drainage the water level in the cell was monitored by taking sequences images with a good time
resolu-10
tion. The height of the water level decreases exponentially with time until it reaches the surface of the sample. Using the falling head equation for calculation of saturated hy-draulic conductivity, we obtained Ksfor fine, homogeneous coarse, and heterogeneous structured sand 12±0.7, 873±24, and 265±8 cm h−1, respectively.
2.2 Light Transmission Method (LTM)
15
To measure the vertical redistribution and the dynamics of water content in the Hele-Shaw cell, we used the Light Transmission Method (LTM) according to Glass et al.
(1989b);Tidwell and Glass(1994). This technique is based on the fact that the intensity of transmitted light increases with water saturation. Previous experiments have shown that in air-water system, intensity is related to water saturation (Hoa,1981;Glass et al.,
20
1989b). By this technique, dynamics of water saturation can be measured with high temporal and spatial resolution.
The images were taken in RGB-format. As demonstrated byGonzales and Woods
(2001), we used the intensity I=13(R+G+B) as a proxy for water saturation. Where R, G and B are the Red, Green and Blue, respectively.
HESSD
3, 2595–2620, 2006 Fingered flow F. Rezanezhad et al. Title Page Abstract Introduction Conclusions References Tables Figures J I J I Back Close Full Screen / EscPrinter-friendly Version Interactive Discussion
EGU
2.3 X-Ray absorption
Simultaneous measurements of water saturation inside the cell were done during the experiment by x-ray absorption using a polychromatic medical x-ray tube operated at 141 KV and 5 mA together with a 12 bit CCD line detector with 1280 pixel of 0.4 mm side length. Tube and detector were mounted at a distance of 2 m and could be moved
5
synchronously in vertical direction from the bottom to the top of the cell. Measured x-ray intensities of each pixel were corrected for the dark current of the respective detector pixel. The absorption coefficient µ can be calculated as the product of the effective absorption coefficient µ∗and the length of path of the photons through the material d by the following relation:
10
µ= µ∗d = ln( I0
I(d )) (1)
where I0is the emitted intensity and I(d ) is the corrected x-ray intensity of the respec-tive pixel.
In Eq. (1), the absorption coefficient µ∗(x) at sample height x is the sum of the length-fraction weighted absorption coefficients of the different components, hence:
15
µ(x)= µ∗(x) d = (1 − φ) d µsand+ dglassµglass
+ θ(x) d µH2O+ [φ − θ(x)] d µair (2)
where µsand, µglassµH
2Oand µairare the absorption coefficient of sand, the glass plates
of the cell, water and air, respectively, d and dglassare thickness of the cell and its glass, respectively, φ is the porosity and θ(x) is the volumetric water content. Neglecting
20
absorption of air whose absorption coefficient is three orders of magnitude lower than that of the other present materials the last term in Eq. (2) disappears and the water saturation is:
S(x)=µ(z) − µdry
µsat− µdry (3)
HESSD
3, 2595–2620, 2006 Fingered flow F. Rezanezhad et al. Title Page Abstract Introduction Conclusions References Tables Figures J I J I Back Close Full Screen / EscPrinter-friendly Version Interactive Discussion
EGU
where µdry is the calculated value using Eq. (1) of the dry and µsat of the completely saturated sample (Bayer et al.,2004).
2.4 Water content calibration
The calibration of LTM to get the water saturation was done by simultaneous mea-surements of x-ray absorption and light transmission. For this purpose we filled the
5
homogenous sand into a smaller calibration cell with dimensions 30×30×0.3 cm. The water table within this small cell could be adjusted. Simultaneous x-ray and light trans-mission images were taken for three different situations: completely dry, saturated and at hydrostatic equilibrium stage with the water table at the lower boundary. The mea-sured x-ray absorptions and light intensities were related by fitting a third order
polyno-10
mial to the data with a correlation coefficient of 0.999. We obtained: S = 1.7 − 9ILTM+ 15.3ILTM2 − 7.1I3
LTM (4)
where S is the distribution of water saturation calculated from the relative x-ray absorp-tion coefficient using Eq. (3) and ILTMis the normalized intensity which can be expressed as:
15
ILTM=
I− Idry
Isat− Idry (5)
where I, Idry and Isatare the light intensity of transmitted light for partial saturated, dry and saturated sample, respectively. Equation (4) is valid only when the normalized intensity is between 0.4 and 1. The resulting calibration curve is shown in Fig.2.
Note that this calibration is only valid for the specific material. For sand, the intensity
20
of transmitted light increases with grain size. 2.5 Image and deconvolution processing
The measured light intensities of each pixel (I) were corrected for color balance and flatfield illumination using the emitted intensities (I0) which were measured without the
HESSD
3, 2595–2620, 2006 Fingered flow F. Rezanezhad et al. Title Page Abstract Introduction Conclusions References Tables Figures J I J I Back Close Full Screen / EscPrinter-friendly Version Interactive Discussion
EGU
cell and the dark intensities of the camera which were determined in an independent measurement by image processing applications on the original captured images. Addi-tionally, all images were adjusted to represent exactly the same location of the cell. This was done using marked points on the aluminum frame of the cell as reference. It was required because of slight movements of the imaging devices during the experiment.
5
To reduce noise we applied a 5×5 median filter prior to further image analysis.
Within the three phase system of sand, air and water, light is absorbed, scattered, reflected and refracted at the interfaces between the different phases. This leads to a specific spreading of a light emitted from a point source and passing through the porous medium. Consequently, the observed image of transmitted light is convoluted
10
by a Point Spread Function (PSF) which is expected to be constant for homogeneous porous media and a fixed thickness of the transmitted layer.
In previous applications of LTM only the transmitted light intensity is considered with-out any correction for light scattering (Tidwell and Glass,1994). However, scattering reduces the contrast between zones of different water contents and hence it affects
15
one of the most important aspects which we intend to measure in our experiments. Therefore a correction of the images is advisable.
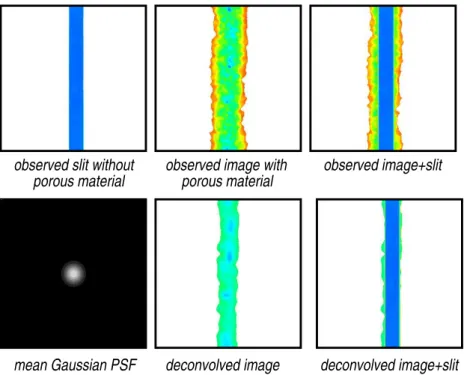
Deconvolution is an increasingly utilized technique to increase contrast and to correct for distortion of digital images (Press et al.,1992). In our application the specific PSF has to be determined. To measure the PSF, we reduced the light source to 8 narrow
20
slits (1×13 cm) in horizontal and vertical direction at different locations of the cell. The measured decreasing light intensities outside the slits were used to fit a 2-D Gaussian, w(x, y), which we used as PSF for deconvolution (Fig.3).
The observed image F (x, y) can be represented by a convolution of the ideal image h(x, y) with the point spread function w(x, y):
25 F (x, y)= Z+∞ −∞ Z+∞ −∞ w(x, y)h(x, y)dxd y (6) 2603
HESSD
3, 2595–2620, 2006 Fingered flow F. Rezanezhad et al. Title Page Abstract Introduction Conclusions References Tables Figures J I J I Back Close Full Screen / EscPrinter-friendly Version Interactive Discussion
EGU
Using Fourier transform (x, y→u, v ) this can be written in the frequency domain as: ˜
F (u, v )= ˜w(u, v) × ˜h(u, v) (7)
and herewith ˜
h(u, v )= ˜F(u, v) × 1 ˜
w(u, v ) (8)
We used a low pass filter for regularization in the frequency domain to reduce noise.
5
After an inverse Fourier transform we get the deconvolved image h(x, y) (J ¨ahne,2002;
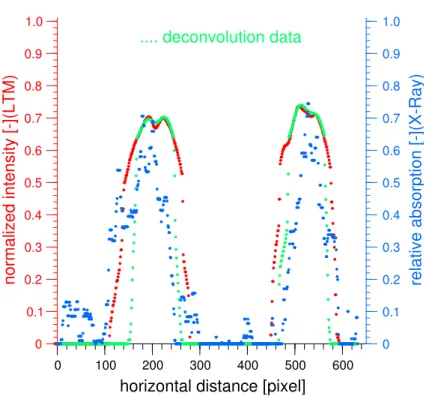
Press et al., 1992). All images were deconvoluted using the same PSF. In Fig. 4, we compare the water contents along a cross-section through two fingers as mea-sured with x-ray, LTM with deconvolution and LTM without deconvolution. Clearly, the observed width of the fingers is reduced through deconvolution which better reflects
10
reality. This is supported by the x-ray results. A perfect match between x-ray mea-surements and the deconvolved LTM image cannot be expected because for technical reasons, there was a time lag of 20 min between x-ray imaging and light intensity mea-surements.
3 Results and discussion
15
3.1 Observation
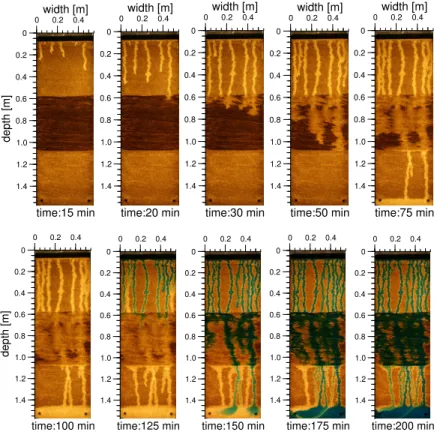
As shown in Fig.5 we observe a stable wetting front in the upper fine-textured layer which uniformly supplies water to the underlying coarse-textured layer. There, the front breaks up into flow fingers which are disturbed within the underlying heterogenous layer but reappear in the homogeneous layer below. Obviously, the increased capillary
20
forces within the fine textured areas of the heterogeneous middle-layer are sufficient to disturb the flow fingers. However, as soon as the fine textured heterogeneities disap-pear the flow pattern is reorganized immediately to form flow fingers again.
HESSD
3, 2595–2620, 2006 Fingered flow F. Rezanezhad et al. Title Page Abstract Introduction Conclusions References Tables Figures J I J I Back Close Full Screen / EscPrinter-friendly Version Interactive Discussion
EGU
The infiltration of dye tracer demonstrates the high velocity in the center of the fingers and stagnant water at their periphery (Fig.6). This suggests the separation of a mobile and an immobile component of water within flow fingers which has implications for solute transport. Within the core of the fingers the fast convective flow is driven by gravity while at the boundaries, which we will refere to as fringe of the finger, flow is
5
slow and diffusive.
3.2 Dynamics of water saturation in fingers
The detailed dynamics of water saturation during the passage of fingers was analyzed at different locations. As the finger moves downward, there is a narrow zone at the finger tip where the water saturation increases rapidly. The water saturation in the tip
10
of the finger is close to saturation and drops in a short distance behind the tip. Fig-ure7shows examples of water saturation along flow fingers with saturation overshoot in the tip. This typical dynamics of water saturation is a well known phenomenon for fingered flow as reported by (Glass et al.,1989b;Selker et al.,1992;Liu et al.,1994;
Geiger and Durnford,2000;DiCarlo and Blunt,2000;DiCarlo,2004). They have shown
15
that saturation overshoot is associated with an overshoot in water potential which de-creases from the tip to tail of the fingers. This phenomena is considered to be a general characteristic of fingered flow.
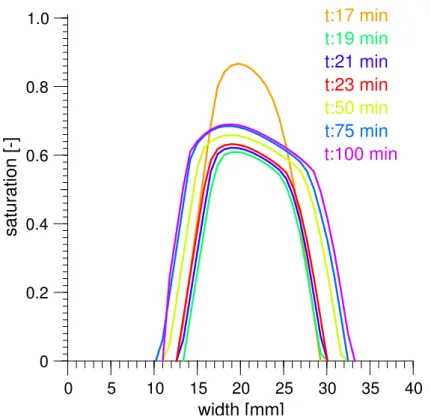
Analysis of horizontal transects through flow fingers showed higher water content in the core of the fingers also after the saturation overshoot in the tip. An example is given
20
in Fig.8which shows the transect through one finger at a fixed location (indicated by a black line in Fig.9) but at different times corresponding to different distances to the tip. Obviously, the water content drops immediately behind the tip but increases again within the core while at the same time the finger widens. After about 75 min the profile converges to a quasi-stable situation.
25
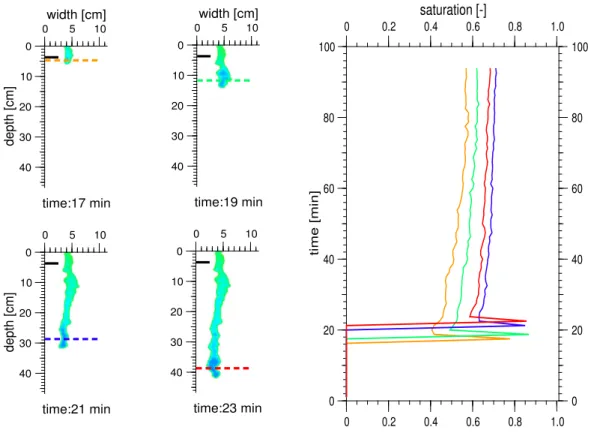
To illustrate this phenomena for the water content within the core of a finger Fig.9
shows the temporal dynamics of water saturation for a small area inside the finger core at four fixed locations during the passage of finger tip at a temporal resolution of 2 min.
HESSD
3, 2595–2620, 2006 Fingered flow F. Rezanezhad et al. Title Page Abstract Introduction Conclusions References Tables Figures J I J I Back Close Full Screen / EscPrinter-friendly Version Interactive Discussion
EGU
The fingers have a tip with water saturation of ∼0.8, and behind of the tip the water saturation dropped to ∼0.5.
We observed a minimum of water saturation within the finger core immediately be-hind the tip. With increasing distance to the tip the water content increases slightly to arrive at a steady state at larger distance. This clear experimental finding was not
5
reported in previous works, however, it can be explained using standard theory. Behind the tip there is an additional lateral gradient which induces horizontal flow. This could be measured by monitoring a horizontal transect of water saturation at a fixed location during the passage of a finger (Fig.8). With increasing distance to the tip this lateral flux vanishes as discussed further below. For the example in Fig.8 the width of the
10
finger is stabilized after some 75 min. This corresponds to the time to arrive at approx-imately constant water contents within the finger core as shown in Fig.9. Since the water flux into the finger is constant the additional lateral flux component behind the tip reduces the vertical flow component and leads to a reduced water content according to the law of Buckingham-Darcy.
15
3.3 Dynamics and stabilization of fingers
The hydraulic state (θ, ψm) during the passage of the finger tip is governed by the hysteretic soil-water characteristic as sketched in Fig.10. We consider three locations: x0on the centerline of the core, x1at the outer limit of the core, and x2at the outer limit of the fringe. Initially, the soil is dry hence ψm is strongly negative and θ very small.
20
With the tip approaching x0, both θ and ψm increase and move along the wetting branch of the soil water characteristic. They reach the maximal values θtip and ψmtip, respectively, with the center of the tip passing over x0. These maximum values are required to advance the water front into the dry porous medium.
At the given velocity of water, capillary suction is too weak and the hydraulic
con-25
ductivity in dry coarse textured sand is too low to remove the invading water. It piles up in the tip, thereby increasing the pressure gradient, until the sum of capillary and pressure gradient forces balance the invading force (Weitz et al.,1987). At the
invad-HESSD
3, 2595–2620, 2006 Fingered flow F. Rezanezhad et al. Title Page Abstract Introduction Conclusions References Tables Figures J I J I Back Close Full Screen / EscPrinter-friendly Version Interactive Discussion
EGU
ing front the mean curvature of the air-water interface may even become positive and hence, also ψm becomes positive. Despite the high velocity of water (≈1 mm/s) the capillary number of the air-water system Ca=µv/σ is very low (Ca≈10−5) meaning that capillary forces still dominate viscous forces. Therefore, the curvature of the inter-face can actually be interpreted in terms of the Young-Laplace relation. The increased
5
pressure leads to a higher water saturation, and consequently to the observed satu-ration overshoot in the finger tip. Note, that during this highly dynamic process ψm in the finger tip does not reflect the pore-size or the contact angle and the values of θtip and ψmtipare not located on the static soil water characteristic (as implied by Fig.10for simplification). This is also the reason why the observed overshoot cannot be
repro-10
duced by Richards equation which relies on a static θ(ψ ) relation. The observation of
DiCarlo(2004) that saturation overshoot is strongest for intermediate fluxes can also be readily understood: at low flow rates the advancing front is slower and therefore the pressure overshoot is smaller. Conversely, for very high fluxes the porous medium has to be close to saturation also behind the tip, so that the overshoot is less pronounced.
15
After passage of the finger tip, the material is wet and no additional force for pushing the phase boundary through the porous medium is required anymore. At this point, water infiltrates radially, driven by the large hydraulic gradient. Hence, water content decreases at x0which brings the hydraulic state on the desorption branch of the water characteristic. During the same time, the state at x1 evolves monotonically along the
20
wetting branch towards (θfringe, ψmcore). With the matric potential at x0and x1 approach-ing the same value,ψmcore, the radial gradient decreases and with it the corresponding flux, and hence, the finger becomes stabilized.
On a time-scale that is much longer than that of the finger’s creation, it continues to expand. This is caused by the large radial gradient in the fringe of the finger, between
25
x1and x2. However, with the water content already low at x1and further decreasing in the fringe, hydraulic conductivity decreases very rapidly and with it the radial flux.
HESSD
3, 2595–2620, 2006 Fingered flow F. Rezanezhad et al. Title Page Abstract Introduction Conclusions References Tables Figures J I J I Back Close Full Screen / EscPrinter-friendly Version Interactive Discussion
EGU
4 Conclusions
We further developed and improved the light transmission method (LTM) to measure the dynamics of water in Hele-Shaw cells. This was achieved by adding a decon-volution procedure to correct the measurements for light scattering. This technique was used to monitor instable infiltration fronts into coarse textured sand. Thereby, the
5
changing water content within flow fingers could be measured in great detail. Addition-ally the velocity field within the flow fingers was visualized using a dye tracer.
The following phenomena could be demonstarted:
– Flow fingers in coarse textured sand are destroyed by finer textured
inhomo-geneities, but the reappear as the flow enters a uniform region.
10
– Our experiments confirm the frequently observed overshoot in water saturation
within the tip of flow fingers.
– As a new observation, the water saturation in the core of the finger has a minimum
immediately behind the tip and increases again towards a constant value at larger distance behind the tip.
15
– The width of flow fingers increases initially and reaches a quasi-stable state at the
same time when the water saturation within the core becomes quasi-stable.
– The water within the finger is sharply separated into a core and a fringe with fast
convective flow in the core and slow diffusive flow in the fringe.
All observed phenomena could by consistently explained based on the hysteretic
be-20
havior of the soil-water characteristic. This research is an effort of laboratory exper-iment to investigate of fingering in unsaturated porous media and to identify the pro-cesses and mechanism of fingered flow.
Acknowledgements. A. Bayer did the x-ray measurements, J. Buchner and D. Globig helped
with the experiments, and F. Heimann wrote the deconvolution algorithm. This project was
25
HESSD
3, 2595–2620, 2006 Fingered flow F. Rezanezhad et al. Title Page Abstract Introduction Conclusions References Tables Figures J I J I Back Close Full Screen / EscPrinter-friendly Version Interactive Discussion
EGU References
Bayer, A., Vogel, H.-J., and Roth, K.: Direct measurement of the soil water retention curve using X-ray absorption, Hydrol. Earth Syst. Sci., 8, 2–7, 2004. 2602
DiCarlo, D. A.: Experimental Measurements of saturation overshoot on infiltration, Water Re-sour. Res., 40, W04 215, doi:10.1029/2003WR002670, 2004. 2597,2605,2607
5
DiCarlo, D. A. and Blunt, M. J.: Determination of finger shape using the dynamic capillary pressure, Water Resour. Res., 36, 2781–2785, 2000. 2605
Diment, G. A. and Watson, K. K.: Stability analysis of water movement in unsaturated porous materials. 3. Experimental studies, Water Resour. Res., 21, 979–984, 1985. 2597
Egorov, A. G., Datov, R., Nieber, J. L., and Sheshukov, A. Y.: Stability analysis of gravity-driven
10
infiltration flow, Water Resour. Res., 39, W1266, doi:10.1029/2002WR001886, 2003. 2598
Eliassi, M. and Glass, R. J.: On the continuum-scale modeling of gravity-driven fingers in un-saturated porous media: The inadequacy of the Richards equation with standard monotonic constitutive relations and hysteretic equations of state, Water Resour. Res., 37, 2019–2035,
2001. 2598
15
Flekkoy, E. G., Schmittbuhl, J., Lovholt, F., Oxaal, U., Maloy, K. J., and Aagaard, P.: Flow paths in wetting unsaturated flow: Experiments and simulations, Phys. Rev. E., 65, 036 312, 2002.
2597
Geiger, S. L. and Durnford, D. S.: Infiltration in homogeneous sands and a mechanistic model of unstable flow, Soil Sci. Soc. Am. J., 64, 460–469, 2000. 2605
20
Glass, R. J., Steenhuis, T. S., and Parlange, J.-Y.: Wetting front instability 2. Experimental determination of relationships between system parameters and two-dimensional unstable flow field behavior in initially dry porous media, Water Resour. Res., 25, 1195–1207, 1989a.
2597
Glass, R. J., Steenhuis, T. S., and Parlange, J.-Y.: Mechanism for finger persistence in
homo-25
geneous unsaturated porous media: Theory and verification, Soil Sci., 148, 60–70, 1989b.
2597,2600,2605
Gonzales, R. C. and Woods, R. E.: Digital Image Processing, Prentice Hall, New Jeresy, 2 edn., 2001. 2600
Hill, D. E. and Parlange, J.-Y.: Wetting front instability in layered soils, Soil Sci. Soc. Am. Proc.,
30
36, 697–702, 1972. 2597
Hill, S.: Channeling in packed columns, Chem. Eng. Sci., 1, 247–253, 1952. 2597 2609
HESSD
3, 2595–2620, 2006 Fingered flow F. Rezanezhad et al. Title Page Abstract Introduction Conclusions References Tables Figures J I J I Back Close Full Screen / EscPrinter-friendly Version Interactive Discussion
EGU
Hoa, N. T.: A new method allowing the measurement of rapid variations of the water content in sandy porous media, Water Resour. Res., 17, 41–48, 1981. 2600
J ¨ahne, B.: Digital Image Processing, Springer, Berlin, Germany, 5th edn., 2002. 2604
Jury, W. A., Wang, Z., and Tuli, A.: A Conceptual model of unstable flow in unsaturated soil during redistribution, Vadose Zone J., 17, 61–67, 2003. 2598
5
Klute, A. and Dirksen, C.: Methods of soil analysis, chap. Hydraulic conductivity and diffusivity: Laboratory methods, pp. 687–734, Part 1. Physical and Mineralogical Methods, American Society of Agronomy, Madison, Wisconsin, 2 edn., 1986. 2600
Liu, Y., Bierck, R., Selker, J. S., Steenhuis, T. S., and Parlange, J.-Y.: High intensity X-ray and tensiometry measurements in rapidly changing preferential flow fields, Soil Sci. Soc. Am. J.,
10
57, 1188–1192, 1993. 2597
Liu, Y., Steenhuis, T. S., and Parlange, J.-Y.: Formation and persistence of fingered flow fields in coarse grained soils under different moisture contents, J. Hydrol., 159, 187–195, 1994.
2605
Press, W. H., Teukolsky, S. A., Vetterling, W. T., and Flannery, B. P.: Numerical Recipes in C,
15
Cambridge University Press, 1992. 2603,2604
Selker, J. S., Parlange, J.-Y., and Steenhuis, T. S.: Fingered flow in two dimensions 2. Predicting finger moisture profile, Water Resour. Res., 28, 2523–2528, 1992. 2605
Tidwell, V. C. and Glass, R. J.: X-ray and visible light transmission for laboratory measurement of two-dimensional saturation fields in thin-slab system, Water Resour. Res., 30, 2873–2882,
20
1994. 2598,2600,2603
Wang, Z., Feyen, J., and Elrick, D. E.: Prediction of fingering in porous media, Water Resour. Res., 34, 2183–2190, 1998. 2598
Weitz, D. A., Stokes, J. P., Ball, R. C., and Kushnick, A. P.: Dynamic capillary pressure in porous media: Origin of the viscous-fingering length scale, Phys. Rev. Lett., 59, 2967–2970, 1987.
25
HESSD
3, 2595–2620, 2006 Fingered flow F. Rezanezhad et al. Title Page Abstract Introduction Conclusions References Tables Figures J I J I Back Close Full Screen / EscPrinter-friendly Version Interactive Discussion EGU front view side view H el e-S ha w c el l di ffu si on li gh t s ou rc e digital camera X-ray source X -r ay d et ec to r ho m og en eo us he te ro ge no us fine layer drippers 0 0.2 0.4 0 0.2 0.4 0.6 0.8 1.0 1.2 1.4 ho m og en eo us he ig ht [m ] width [m]
Fig. 1. Sketch of the experimental setup (side and front view). A transparent Hele-Shaw cell
with four layers of sand is placed between the x-ray source and the line detector which both can be moved vertically. Transmitted light is recorded by a digital camera placed on the x-ray source.
HESSD
3, 2595–2620, 2006 Fingered flow F. Rezanezhad et al. Title Page Abstract Introduction Conclusions References Tables Figures J I J I Back Close Full Screen / EscPrinter-friendly Version Interactive Discussion EGU 0.4 0.6 0.8 1.0 0 0.1 0.2 0.3 0.4 0.5 0.6 0.7 0.8 0.9 1.0
relative absorption [-](X-Ray)
normalized intensity [-](LTM)
RGB
Intensity (LTM) Saturation (X-ray)
0 50 100 150 200 250 300 350 400 450 0 50 100 150 200 250 300 350 400 450 0.4 0.6 0.8 1.0 0.4 0.6 0.8 1.0 height [pixel] normalized intensity [-] 0 50 100 150 200 250 300 350 400 450 0 50 100 150 200 250 300 350 400 450 0 0.2 0.4 0.6 0.8 1.0 0 0.2 0.4 0.6 0.8 1.0 relative absorption [-]
Fig. 2. Correlation between measured water saturation by relative x-ray absorption and the
nor-malized intensities by LTM while the relation between transmission and saturation is nonlinear, the transmitted light is still a good proxy for water saturation.
HESSD
3, 2595–2620, 2006 Fingered flow F. Rezanezhad et al. Title Page Abstract Introduction Conclusions References Tables Figures J I J I Back Close Full Screen / EscPrinter-friendly Version Interactive Discussion
EGU
observed image+slit observed slit without
porous material observed image withporous material
deconvolved image deconvolved image+slit mean Gaussian PSF
Fig. 3. Multiple light scattering in observed image was corrected by deconvolution using the
Gaussian point spread function obtained from averaging eight horizontal and vertical slits dis-tributed over the cell.
HESSD
3, 2595–2620, 2006 Fingered flow F. Rezanezhad et al. Title Page Abstract Introduction Conclusions References Tables Figures J I J I Back Close Full Screen / EscPrinter-friendly Version Interactive Discussion EGU 0 100 200 300 400 500 600 0 0.1 0.2 0.3 0.4 0.5 0.6 0.7 0.8 0.9 1.0 0 0.1 0.2 0.3 0.4 0.5 0.6 0.7 0.8 0.9 1.0
normalized intensity [-](LTM) relative absorption [-](X-Ray)
.... deconvolution data
horizontal distance [pixel]
Fig. 4. Comparison of x-ray saturation (blue dots) and light intensity without deconvolution (red
dots) and with deconvolution (green dots) for a horizontal cross-section through two fingers. (There was a time lag of 20 min between x-ray imaging and light intensity measurements so the two distributions do not completely coincide.)
HESSD
3, 2595–2620, 2006 Fingered flow F. Rezanezhad et al. Title Page Abstract Introduction Conclusions References Tables Figures J I J I Back Close Full Screen / EscPrinter-friendly Version Interactive Discussion EGU 0 0.2 0.4 0 0.2 0.4 0.6 0.8 1.0 1.2 1.4 depth [m] width [m] time:15 min 0 0.2 0.4 0 0.2 0.4 0.6 0.8 1.0 1.2 1.4 width [m] time:20 min 0 0.2 0.4 0 0.2 0.4 0.6 0.8 1.0 1.2 1.4 width [m] time:30 min 0 0.2 0.4 0 0.2 0.4 0.6 0.8 1.0 1.2 1.4 width [m] time:50 min 0 0.2 0.4 0 0.2 0.4 0.6 0.8 1.0 1.2 1.4 width [m] time:75 min 0 0.2 0.4 0 0.2 0.4 0.6 0.8 1.0 1.2 1.4 depth [m] time:100 min 0 0.2 0.4 0 0.2 0.4 0.6 0.8 1.0 1.2 1.4 time:125 min 0 0.2 0.4 0 0.2 0.4 0.6 0.8 1.0 1.2 1.4 time:150 min 0 0.2 0.4 0 0.2 0.4 0.6 0.8 1.0 1.2 1.4 time:175 min 0 0.2 0.4 0 0.2 0.4 0.6 0.8 1.0 1.2 1.4 time:200 min
Fig. 5. Fingering patterns observed by light transmission (LTM) during water infiltration into
the layered medium. Flow instability is induced at the transition from the fine-textured sand (dark top layer) to the coarse-textured sand. The fingers are disturbed within the heteroge-nous middle-layer and reappear in the uniform layer below. After stabilization of the fingered flow pattern, a Brilliant blue tracer was added to visualize local flow velocities (see experi-mental video clip in the supplement:http://www.hydrol-earth-syst-sci-discuss.net/3/2595/2006/
hessd-3-2595-2006-supplement.zip).
HESSD
3, 2595–2620, 2006 Fingered flow F. Rezanezhad et al. Title Page Abstract Introduction Conclusions References Tables Figures J I J I Back Close Full Screen / EscPrinter-friendly Version Interactive Discussion EGU 0 0.2 0.4 0 0.1 0.2 0.3 0.4 0.5
depth [m]
width [m]
0 0.2 0.4 0 0.1 0.2 0.3 0.4 0.5depth [m]
width [m]
mobile core immobile fringeFig. 6. Infiltration of dye tracer into stabilized water fingers shows the separation of the water
HESSD
3, 2595–2620, 2006 Fingered flow F. Rezanezhad et al. Title Page Abstract Introduction Conclusions References Tables Figures J I J I Back Close Full Screen / EscPrinter-friendly Version Interactive Discussion EGU 0 0.2 0.4 0 0.1 0.2 0.3 0.4 0.5 depth [m] width [m] 0 0.2 0.4 0 0.1 0.2 0.3 0.4 0.5 depth [m] width [m] 0 0.2 0.4 0 0.1 0.2 0.3 0.4 0.5 0 0.12 0.25 0.38 0.50 0.62 0.75 0.88 1.00 depth [m] width [m]
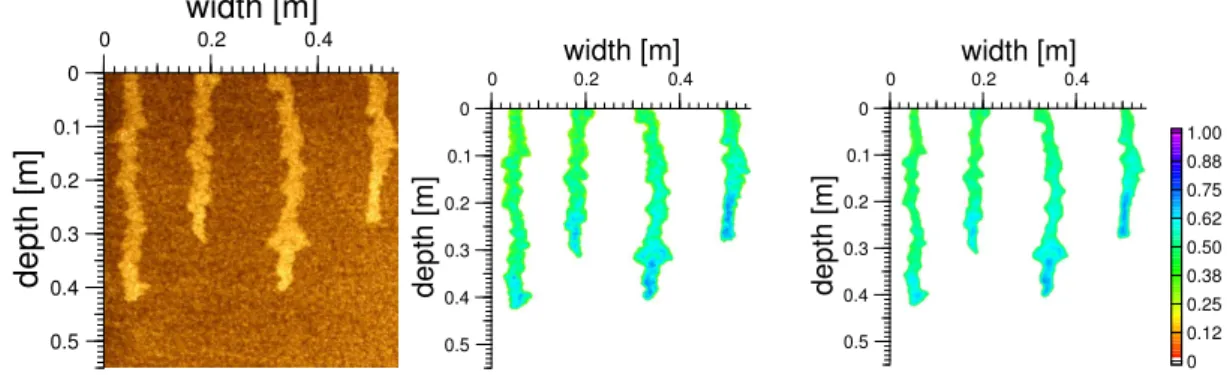
Fig. 7. Fingered flow in a homogenous layer as observed with transmitted light (left). The same
image but referenced to the dry image to visualize the water saturation in false colors (middle) and after deconvolution using the PSF (right). Note the saturation overshoot in the tips.
HESSD
3, 2595–2620, 2006 Fingered flow F. Rezanezhad et al. Title Page Abstract Introduction Conclusions References Tables Figures J I J I Back Close Full Screen / EscPrinter-friendly Version Interactive Discussion EGU 0 5 10 15 20 25 30 35 40 0 0.2 0.4 0.6 0.8 1.0 saturation [-] width [mm] t:17 min t:19 min t:21 min t:23 min t:50 min t:75 min t:100 min
Fig. 8. A horizontal transverse saturation profile at a fixed location for different times during
the passage of a finger showing the dynamics of water saturation within a finger from the initial finger tip to a quasi-stable state.
HESSD
3, 2595–2620, 2006 Fingered flow F. Rezanezhad et al. Title Page Abstract Introduction Conclusions References Tables Figures J I J I Back Close Full Screen / EscPrinter-friendly Version Interactive Discussion EGU 0 20 40 60 80 100 0 20 40 60 80 100 0 0.2 0.4 0.6 0.8 1.0 0 0.2 0.4 0.6 0.8 1.0 time [min] saturation [-] 0 5 10 0 10 20 30 40 depth [cm] width [cm] time:17 min 0 5 10 0 10 20 30 40 width [cm] time:19 min 0 5 10 0 10 20 30 40 depth [cm] time:21 min 0 5 10 0 10 20 30 40 time:23 min
Fig. 9. The temporal dynamics of water saturation inside the finger core during the passage of
a finger at different depths. Note the minimum of water saturation behind the tip and the slow increase of water saturation until a quasi-stable state is reached.
HESSD
3, 2595–2620, 2006 Fingered flow F. Rezanezhad et al. Title Page Abstract Introduction Conclusions References Tables Figures J I J I Back Close Full Screen / EscPrinter-friendly Version Interactive Discussion
EGU Fig. 10. Sketch of the evolution of hydraulic states during the passage of a finger: at location
x0, where the center of the tip passes through, (θ, ψm) moves from the initial very dry state to the maximum (θtip, ψmtip) along the wetting branch of the water characteristic and then, behind the tip, towards (θcore, ψmcore) along the drying branch. During the same time, the state at x1 evolves monotonically towards (θfringe, ψmcore) which marks a quasi-stable state and radial water flux ceases. The gradient between x1and x2causes only minor water flux because of the low hydraulic conductivity.