Contents lists available atScienceDirect
Colloid and Interface Science Communications
journal homepage:www.elsevier.com/locate/colcomRapid Communication
Taylor Dispersion of Inorganic Nanoparticles and Comparison to Dynamic
Light Scattering and Transmission Electron Microscopy
Dominic A. Urban
a, Ana M. Milosevic
a, David Bossert
a, Federica Crippa
a, Thomas L. Moore
a,
Christoph Geers
a, Sandor Balog
a, Barbara Rothen-Rutishauser
a, Alke Petri-Fink
a,b,⁎aAdolphe Merkle Institute, University of Fribourg, Chemin des Verdiers 4, 1700 Fribourg, Switzerland bChemistry Department, University of Fribourg, Chemin du Musée 9, 1700 Fribourg, Switzerland
A R T I C L E I N F O
Keywords:
Taylor dispersion analysis Nanoparticles
Size characterization Hydrodynamic diameter
A B S T R A C T
Taylor dispersion analysis (TDA) is an analytical method that has so far mainly been utilized to determine the diffusion coefficient of small molecules, and proteins. Due to increasing interest in nanoscience, some research has been done on the applicability of TDA towards characterizing nanoparticles. This work aims to expand this knowledge and give insight into the range for which TDA can be used for nanoparticle characterization, focusing on various materials and sizes. The TDA setup shown in this work was successful in characterizing all engineered metallic, non-metallic nanoparticles, and proteins tested in this work. Results were compared to dynamic light scattering and electron microscopy, and were in good agreement with both methods. Taking into consideration the wide range of nanoparticle sizes that can be characterized, the minimal sample preparation, and sample volume, required and the simplicity of the method, TDA can be considered as a valuable technique for nano-particle characterization.
When looking at the huge array of properties that nanoparticles (NPs) possess, it is not surprising that they have found their way into a multitude of scientific research areas, and industrial applications[1]. Interesting NP phenomena are mostly governed by their size, and for many applications it is imperative that the NPs not only have a very specific size but also display a narrow particle size distribution[2]. For example, the heating properties of superparamagnetic iron oxide na-noparticles (SPIONs), which are being investigated as mediators of hyperthermia in cancer treatment, are dependent on their size and size distribution. Therefore, the characterization of nanoparticle size is crucial to ensure their functionality[3]. For this purpose, several ana-lytical methods such as dynamic light scattering (DLS), NP tracking analysis (NTA), UV–Vis spectroscopy, field-flow fractionation, analy-tical ultracentrifugation, and transmission electron microscopy (TEM) have been utilized to characterize NP sizes and size distributions[4–8]. Each method has its advantages and disadvantages, and a combination of techniques is typically recommended to adequately characterize NPs
[4]. For example, TEM provides information about NP core sizes, but cannot evaluate NP hydrodynamic diameters. Conversely, DLS and NTA can evaluate particle hydrodynamic diameter and colloidal stability, but are limited by the quality of light scattering and require a deeper knowledge of the theory and model-fitting to properly analyze the raw data. With scattering-based techniques, the limit of detection for NPs
depends on the sensitivity of the detection of scattered light, and factors such as the material refractive index, particle size, shape and the wa-velength used for detection. Furthermore, standard DLS measurements struggle with analyzing NPs in complex environments (e.g. protein-crowded suspensions, high particle concentration etc.) or samples where only limited sample preparation is possible[9–11]. There are possibilities to overcome some of these problems, for example by the use of depolarized dynamic light scattering, as described by Balog et al.
[12]. These methods, however, require either an advanced level of data analysis or expensive instruments.
We show here that Taylor dispersion analysis (TDA) is very pro-mising as a NP characterization technique and, interestingly enough, has not been more routinely used for this purpose. Our work includes a systematic variation of NP size and core material to determine the confines in which TDA can be used for NP analysis. We focused pri-marily on metal NPs (gold), metal oxide (superparamagnetic iron oxide, SPIONs) NPs, and silica NPs, and have also included the protein, bovine serum albumin (BSA), which is a standard for protein characterization. We measured all particles using the setup shown inFig. 1. For com-parison, we used standard TEM and DLS and show the cases where these methods reach its limitations to point out the advantages for the use of TDA.
TDA, originally described by Taylor in 1953 and further developed
https://doi.org/10.1016/j.colcom.2017.12.001
Received 24 August 2017; Received in revised form 29 November 2017; Accepted 15 December 2017
⁎Corresponding author at: Adolphe Merkle Institute, University of Fribourg, Chemin des Verdiers 4, 1700 Fribourg, Switzerland.
E-mail address:alke.fi[email protected](A. Petri-Fink).
Available online 26 December 2017
2215-0382/ © 2017 Elsevier B.V. This is an open access article under the CC BY-NC-ND license (http://creativecommons.org/licenses/BY-NC-ND/4.0/).
by Aris, is an analytical technique which enables the determination of diffusion coefficients and hence hydrodynamic radii of molecules. This can be extended to virtually any solute, including nanoparticles, pro-vided that the experimental setup is adequate [13]. Here we could determine NP diffusion constants by the band broadening of a solute peak travelling through a capillary. The hydrodynamic diameter can then be calculated from the diffusion coefficient via the Stokes-Einstein equation (Fig. 1). Taylor-Aris dispersion occurs, when an initially homogenous NP concentration band is dispersed due to the convection caused by a pressure-driven laminarfluid flow. Laminar flow results in the well-known parabolic function of the velocity of theflow-profile across the cross section of the tube. This in turn creates a radial con-centration gradient at both the front and back of the analyte band, which induces a net (mass) transport of the NPs via diffusion (Fig. 1A). The consequence is that NPs at the front of the band migrate towards the capillary walls, and particles in the rear migrate towards the ca-pillary center. In most Taylor-Aris dispersion experiments, the combi-nation of diffusion and convection results in a band profile that is well described by a Gaussian function, where the width of the Gaussian function contains the information about particle size. The relevant equations and the boundary conditions are found in section SI8
(Supporting information). Depending on the diffusion coefficient of the NPs, the distribution compensation at the concentration front, caused by convection, will vary. In other words, larger NPs will be dispersed more strongly by convection than smaller ones, and by detecting the band broadening of these concentration fronts, and obtaining so-called Taylorgrams of the NPs, one can determine hydrodynamic sizes by fitting the Taylorgram against a Gaussian function[13–15].
In the past, TDA has mainly been used to observe chemical reactions
[16,17], or to determine the diffusion coefficient of small molecules, proteins, and polymers[10,11,18–20]. With the increasing interest in nanomaterials, some work has been done in the past
[9,13,15,18,21–24]to investigate whether TDA can be used for NP characterization. Previous studies have shown several advantages of this method, e.g. short measurement times [9,11,17], small sample volumes (i.e. nanoliters)[11,25]. Furthermore, the method is not only limited to spherical NPs but can be applied to other shapes, such as rods
[18]. However, research focused on NP characterization with TDA has been focused on polymeric samples with a limited number of samples and few different sizes[9–11,18,25]. Due to the scope of this manu-script we opted to compile a list of additional literature concerning Taylor Dispersion and nanoparticle analysis and add it to the supple-mentary information rather than continue here. (see S19).
The instrumental setup of our TDA experiments is graphically de-picted inFig. 1B. The essential part is the capillary with two detection windows burned at specific areas to insure that the conditions for TDA are met, as described by Taylor[13]. Due to the advantageous setup of having two detection windows instead of one, as shown by Ye et al.
[26],fluctuations in flow rate and injection parameters, such as pres-sure ramp, during repetition meapres-surements, do not affect the analysis as strongly. Thus, the evolution of the dispersion between the two detec-tion windows can be quantified and the NP size can be determined. At this point we would like to point out that the boundary conditions mentioned by d'Orlyé et al.[13], concerning the necessary capillary length etc. required for TDA analysis, was guaranteed for all particle systems, with the exception being the largest silica particles (SiO2-L), which did not reach theτ limit of 1.4 at the first detection window. The reason for this is explained at a later point in this manuscript.
The sample is pumped through the capillary by applying pressure with a syringe pump to the sample vials. A Xenon lamp generates light (UV–Vis-NIR), which passes through exchangeable emission filters prior to passing through the capillary and reaching the ActiPix UV–Vis area imaging detector, which detects light in such a way as to prevent scattering and false signals due to light scattering at the capillary walls. (see S7 for details). It should be noted here that depending on the NPs measured, different emission filters were used (Fig. 1B).
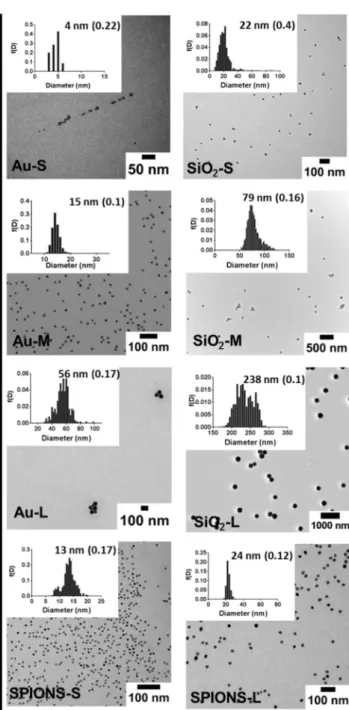
Thefirst step of the work was the synthesis of 3 types of NPs. The details of the synthesis are reported in sections S1-S3 (Supporting in-formation). Small (S-), medium (M-) and large (L-), respectively silica (SiO2) and gold (Au) NPs were synthesized in addition to two sizes (small, S, and large, L) of superparamagnetic iron oxide (SPIONs).Fig. 2
summarizes representative TEM micrographs, size histograms, and the average mean of NPs used in this study. The synthesized NPs generally show moderate polydispersity, except for the SiO2-S sample. This is attributed to the different synthesis route, where the concentration ofL -arginine as catalyst has a strong influence on the polydispersity[27]. We have used BSA throughout our study, since it has previously been used as proof-of-concept for TDA[9–11]. As can be expected, no ade-quate TEM micrograph could be obtained for BSA due to insufficient contrast.
The following section is divided into segments with increasing particle or measurement complexity, starting with the easily measured BSA. We opted not to convert results obtained by DLS, TDA, and TEM into any weighted distribution system, as suggested by a recent report from the European Commission[28], since this can induce bias. The results of the necessary mathematical equations strongly depend on assumptions concerning BSA particle size distributions. This does not
Fig. 1. A) Schematic depicting the principle of TDA and the difference in dispersion profile when comparing particles of different sizes. Due to the laminar flow (convection), the initially very narrow band of NPs undergo increased radial migration, causing a continuous band-broadening effect. The diffusion coefficient can be determined by comparing the band broadening at the time points t1and t2,by implementing calculations
explained in the supplementary information (S8). Small particles with higher diffusion coefficients counteract convection better than large particles with lower diffusion coef-ficients, resulting in comparably narrower band. B) Setup of the TDA instrument used in this work showing the important components. The zoom-in shows the wavelength-se-lective detection, due to exchangeable wavelengthfilters, and the pixel-based detection system.
mean that the obtained results from TEM, TDA and DLS cannot be compared, on the contrary, yet the reader should keep in mind that the values are obtained by different techniques based on different models and assumptions. With this in mind, we show both results obtained via cumulant and CONTIN analysis for DLS measurements[29]. The most commonly used analysis Is the cumulant analysis, where a polynomial is used to analyze the autocorrelation function, and the CONTIN ana-lysis, which uses an inverse Laplace transformation to analyze the au-tocorrelation function, and is more reliable to analyze polydisperse samples. In the case of the CONTIN analysis, whenever there were multiple populations determined, we list the two most significant sizes. The particle concentrations used in the DLS and TDA studies can be found in section SI6 (Supporting information).
The diameters obtained for BSA by DLS were 10 ± 1 nm, for the
cumulant analysis (5 ± 1 nm and 97 ± 15 nm for CONTIN analysis), and 6 ± 0.4 nm, for TDA respectively. BSA only shows very weak protein scattering and the DLS measurements of BSA displayed strong variation in scattering intensity [9]. We decided that none of the samples should be pre-treated (i.e. subject tofiltration etc.) to avoid any alteration of the sample. In this way we simulate situations, in which purification of samples is not an option, for example if filtration would retain a part of the particle population, or the particles are to be characterized in a complex environment, cell culture media for in-stance, where sample purification would severely alter the sample composition.
Hawe et al.[9]and Hulse et al.[10]have reported similar DLS data on BSA and have shown that the formation of protein aggregates can be observed in the sample, which influence measurement. In contrast, the values from TDA were obtained without any difficulty, even in the presence of large dust particles, which agrees with previously reported literature values from Jachimska et al. and confirms that the in-strumentation used in this study is comparable to previously performed studies[9,10,30]. DLS is usually performed using a given laser wave-length, while the TDA measurements rely on selective wavelength de-tection. Here, we measured the sample at 214 nm, where light is strongly absorbed by the proteins, resulting in a strong detection signal. This enabled us to obtain signals easily via TDA, when compared to DLS measurements, where we had to rely on the light scattering from BSA. Another aspect is the analyzed sample volume. The volume probed by DLS is defined primarily by the diameter of the laser beam and the angle of scattering[31], while in the case of TDA, by the area of de-tection and capillary diameter. By assuming that the detector observes the full width of the capillary along the detection window, we estimate an approximately 10 times higher observed volume in favor of TDA. Therefore, TDA is less sensitive to numberfluctuations in the sample volume (e.g. aggregates) than DLS.
Following this initial study, we chose to continue with arguably two of the most commonly used engineered model NPs, i.e. Au and SiO2 NPs. Au NPs were measured at a wavelength of 520 nm, whereas the SiO2NPs were measured at a wavelength of 214 nm. The detection of Au NPs at this wavelength occurs predominantly via absorption, due to their localized surface plasmon resonance (LSPR) rather than via scat-tering as for SiO2NPs at 214 nm. This advantageous LSPR effect be-comes very obvious for the Au-S NPs. With the given gold concentration (0.87 mM) and laser power (168.8 mW), the intensity of the light scattered from these particles is low, and therefore, the possible pre-sence of a few aggregates can significantly corrupt the analysis. It has been shown elsewhere that weak scattering and the presence of larger species in the solution can result in inconclusive results[9,28]. The optical absorption, however, provides a means to determine the size via TDA.
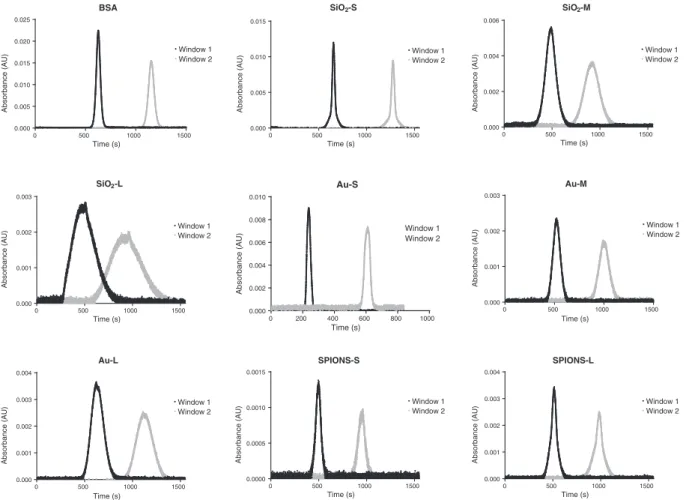
Fig. 3 shows exemplary Taylorgrams displaying the absorbance measured at two detection windows. Absorbance here should be re-garded as the total optical extinction, generally including both the absorption and scattering of the sample material, and we show the recorded values in absorbance units (AU). The boundary conditions mentioned by Flynn et al.[1]were meet, with the exceptions of the SiO2-L particles at detection window 1. Overall, the measured signals resemble a Gaussian curve, allowing for a simple analysis. Several ef-fects, such as the polydispersity of the sample itself, wall interactions, or instrumental errors, may cause slight differences in the signal sym-metry, however seem not to have a significant influence in the data analysis in our case. Additional literature on the analysis of nano-particles with TDA can be found from Cipeletti et al.[16,17], Belongia and Baygents[18], and Balog et al.[32]
Results for the sizes obtained by the three instruments are shown in
Table 1. The numbers from the TEM correspond to the mean size of the counted particles followed by the standard deviation. This would cor-respond to the number-averaged mean diameter. Concerning the values obtained via TDA and DLS—as shown in the table caption–these values
Fig. 2. TEM micrographs of the NPs with respective size histograms. All NPs were syn-thesized in-house. The values represent the average particle diameter, with the PDI (standard deviation/mean) in brackets. For the size determination, a minimum of 200 particles were counted, with the exception being the Au-S particles, where approximately 171 particles were counted.
are the mean values gathered from the instruments, with the corre-sponding standard deviations representing the instrumental reprodu-cibility. Concerning the averages gathered by DLS, these are intensity-weighted values. For TDA, this depends on whether the particle dom-inantly absorbs or scatters light at the given wavelength[32].Table 1
shows that the data obtained by the various methods are overall com-parable. The larger values obtained by TDA compared to the TEM diameters, with the exception of the two smaller Au NPs (i.e. Au-S and
Au-M), can most likely be accounted for by the fact that TDA de-termines hydrodynamic diameters. It is to be expected that these values are higher than that of the core material in a dried state. For those Au NPs where the TDA diameter is either smaller or equally large com-pared to TEM, it is possible that minute measurement errors in both TDA and TEM account for these differences. The observed divergence between DLS and TDA for the SiO2-M, SiO2-L, Au-M, and Au-L NPs might be caused by a few larger NPs present in the system, which completely shield the presence of smaller particles, see sections S11–18 (Supporting information). For example, one can clearly see a few fairly large particles in the histogram of Au-L, or the fairly broad distribution of the SiO2-L particles. This is not surprising, considering that it has already been shown [9,10] that larger particles affect the intensity
weighted results gained by DLS, which would also explain the overall higher values determined via DLS[25]. It should be mentioned here, that the Taylorgram for the SiO2-L particles shows an asymmetric signal at thefirst detection window. This is due to the boundary conditions not being met fully[13], which—as we show—in itself does not negate
the validity of these measurements, and thus we chose to keep the overall system equal. Additionally when comparing the analytical re-sults from our two-window method to a single-window analysis at the second detection window, analog to d'Orlyé et al.[13], we only cal-culate minor differences (238 nm for the two window detection method, and 242 nm for the single window method).
It should be noted here, that the spectra of the SiO2-S particles measured with TDA show a bimodal distribution. One reason for this might be residual arginine from the particle synthesis[27]. The TDA spectra shows two overlapping Taylograms, where the narrower one corresponds to a small molecule, most likely L-arginine. We used a simple bimodal model to determine the sizes of both components, and determined a size, for the second component (narrow signal), of around
BSA Time (s) Absorbance (AU) 0 500 1000 1500 0.000 0.005 0.010 0.015 0.020 0.025 Window 1 Window 2 SiO2-S Time (s) Absorbance (AU) 0 500 1000 1500 0.000 0.005 0.010 0.015 Window 1 Window 2 SiO2-M Time (s) Absorbance (AU) 0 500 1000 1500 0.000 0.002 0.004 0.006 Window 1 Window 2 SiO2-L Time (s) Absorbance (AU) 0 500 1000 1500 0.000 0.001 0.002 0.003 Window 1 Window 2 Au-S Time (s) Absorbance (AU) 0 200 400 600 800 1000 0.000 0.002 0.004 0.006 0.008 0.010 Window 1 Window 2 Au-M Time (s) Absorbance (AU) 0 500 1000 1500 0.000 0.001 0.002 0.003 Window 1 Window 2 Au-L Time (s) Absorbance (AU) 0 500 1000 1500 0.000 0.001 0.002 0.003 0.004 Window 1 Window 2 SPIONS-S Time (s) Absorbance (AU) 0 500 1000 1500 0.0000 0.0005 0.0010 0.0015 Window 1 Window 2 SPIONS-L Time (s) Absorbance (AU) 0 500 1000 1500 0.000 0.001 0.002 0.003 0.004 Window 1 Window 2
Fig. 3. Taylorgrams of the NPs used in this study, showing the signal at both detection windows.
Table 1
Diameters of different SiO2, Au NPs, and SPIONs obtained by TDA, DLS, and TEM; a
hyphen indicates that no value could be obtained. The detection wavelengths for TDA were 214 nm for the SiO2particles, 520 nm for the Au NPs, and 280 nm for the SPIONs.
Depending on the particle size, a varying reproducibility could be achieved for the TDA analysis, as can be seen by the standard deviations of the determined average particle size, represented by the second number in the TDA column. A minimum of triplicates were measured for each sample system. Standard deviations of the determined particle size are also shown in the table. The mean value determined via TEM are accompanied with the standard deviation in average size for the particles counted. In the case of TEM, a minimum of 200 particles were counted for each image, with the exception of the Au-S sample, were 171 particles were counted.
Nanoparticle TDA dH(nm) DLS cumulant dH(nm) DLS CONTIN dH(nm) TEM d (nm) SiO2-S 24 ± 1 29 ± 0.1 25 ± 2/257 ± 8 22 ± 9 SiO2-M 69 ± 1 93 ± 1 121 ± 7 79 ± 13 SiO2-L 239 ± 7 253 ± 2 254 ± 1 238 ± 24 Au-S 3.3 ± 0.2 – – 4.6 ± 1.2 Au-M 23 ± 1 27 ± 4 16 ± 2/250 ± 39 15 ± 2 Au-L 67 ± 4 45 ± 0.1 75 ± 4 56 ± 10 SPIONs-S 15 ± 1 54 ± 1 17 ± 1/235 ± 1 13 ± 2 SPIONs-L 33 ± 2 27 ± 0.3 37 ± 2 24 ± 3
0.8 nm, indicating indeed a molecular component. Additional arginine attached to the surface of the NPs would influence the particles' prop-erties and might influence their hydrodynamic size or create interac-tions with the capillary wall. This could in turn influence their dis-tribution within the capillary, which we could not observe in our case. The results show the advantages that TDA has over alternative sizing techniques. First, we can see that TDA analysis is easily feasible even for ‘small’ NPs, as could be seen for both the BSA and the Au-S particles, something that has proven to be more challenging with DLS. This precise determination of sizes via TDA has previously been con-firmed by e.g. Hulse et al.[11]who have shown that even molecular diffusion constants of caffeine and BSA can be obtained via TDA. Second, the results obtained by TDA are less influenced by a small population of larger particles, which was in fact the case for the SiO2-S samples, as can be seen in sections S19–21 (Supporting information).
The TDA results obtained for SPIONs are in good agreement with the TEM results, as summarized inTable 1. The DLS data for SPIONs-S shows values that are significantly higher, which is again likely due to the presence of larger particles and aggregates in the system. This is especially clear when comparing the CONTIN data. The results obtained for the SPIONs-L sample confirm this assumption, because here the polydispersity is lower and the TDA, DLS and TEM values are in good agreement.
In conclusion, by using NPs of various core materials, both organic and inorganic, metallic and nonmetallic, we explored the feasibility of using TDA for a variety of engineered NPs. Additionally, we system-atically varied the size of these particles (from 2 nm to 250 nm in diameter) to study the impact size has on the method. TDA was highly suitable to measure the NP samples used in this study, when comparing the results to the comparison methods DLS and TEM. Even the smallest Au NPs, which proved problematic to be measured with DLS, could be measured as well. In summary, we conclude that TDA's main advantage over dynamic light scattering, in this study, was the possibility to easily measure particles, which are either very small, in the case of Au-S particles, or do not have sufficient scattering properties, in the case of BSA. Thus, when considering that the scope of this study was to have a minimal sample preparation, we conclude that TDA measurements are easier performed and analyzed than DLS. The next steps, to improve TDA as sizing instrumentation, are to move towards more polydisperse and anisotropic NPs [32]and to more complex NP dispersions, like biologicalfluids containing salts, small molecules or proteins. Acknowledgement
The authors are grateful for thefinancial support of the Adolphe Merkle Foundation and the Chemistry Department of the University of Fribourg. This work benefitted from support from the Swiss National Science Foundation through the National Center of Competence in Research Bio-Inspired Materials and from the Swiss National Science Foundation, NRP 66 (406640_136976).
Appendix A. Supplementary Data
Supplementary data to this article can be found online athttps:// doi.org/10.1016/j.colcom.2017.12.001.
References
[1]H. Flynn, D. Hwang, M. Holman, Nanotechnology Update: Corporations up their Spending as Revenues for Nano-Enabled Products Increase, Lux Research December 2013, (2013).
[2]R.A. Revia, M. Zhang, Magnetite nanoparticles for cancer diagnosis, treatment, and treatment monitoring: recent advances, Mater Today (Kidlington) 19 (3) (2016) 157–168. [3]M. Mahmoudi, S. Sant, B. Wang, S. Laurent, T. Sen, Superparamagnetic iron oxide
na-noparticles (SPIONs): development, surface modification and applications in che-motherapy, Adv. Drug Deliv. Rev. 63 (1–2) (2011) 24–46.
[4]T.L. Moore, L. Rodriguez-Lorenzo, V. Hirsch, S. Balog, D. Urban, C. Jud, B.
Rothen-Rutishauser, M. Lattuada, A. Petri-Fink, Nanoparticle colloidal stability in cell culture media and impact on cellular interactions, Chem. Soc. Rev. 44 (17) (2015) 6287–6305. [5] A. Lopez-Serrano, R. Muñoz Olivas, J. Sanz Landaluze, C. Cámara, Nanoparticles: a global
vision. Characterization, separation, and quantification methods. Potential environ-mental and health impact, Anal. Methods (6) (2014) 38–56.
[6] D.H. Tsai, F.W. DelRio, A.M. Keene, K.M. Tyner, R.I. MacCuspie, T.J. Cho,
M.R. Zachariah, V.A. Hackley, Adsorption and conformation of serum albumin protein on gold nanoparticles investigated using dimensional measurements and in situ spectro-scopic methods, Langmuir 27 (6) (2011) 2464–2477.
[7] H. Hagendorfer, R. Kaegi, M. Parlinska, B. Sinnet, C. Ludwig, A. Ulrich, Characterization of silver nanoparticle products using asymmetricflow field flow fractionation with a multidetector approach—a comparison to transmission electron microscopy and batch dynamic light scattering, Anal. Chem. 84 (6) (2012) 2678–2685.
[8] H. Hinterwirth, S.K. Wiedmer, M. Moilanen, A. Lehner, G. Allmaier, T. Waitz, W. Lindner, M. Lammerhofer, Comparative method evaluation for size and size-distribution analysis of gold nanoparticles, J. Sep. Sci. 36 (17) (2013) 2952–2961.
[9] A. Hawe, W.L. Hulse, W. Jiskoot, R.T. Forbes, Taylor dispersion analysis compared to dynamic light scattering for the size analysis of therapeutic peptides and proteins and their aggregates, Pharm. Res. 28 (9) (2011) 2302–2310.
[10] W. Hulse, R. Forbes, A. Taylor, Dispersion analysis method for the sizing of therapeutic proteins and their aggregates using nanolitre sample quantities, Int. J. Pharm. 416 (1) (2011) 394–397.
[11] W.L. Hulse, R.T. Forbes, A nanolitre method to determine the hydrodynamic radius of proteins and small molecules by Taylor dispersion analysis, Int. J. Pharm. 411 (1–2) (2011) 64–68.
[12] S. Balog, L. Rodriguez-Lorenzo, C.A. Monnier, M. Obiols-Rabasa, B. Rothen-Rutishauser, P. Schurtenberger, A. Petri-Fink, Characterizing nanoparticles in complex biological media and physiologicalfluids with depolarized dynamic light scattering, Nano 7 (14) (2015) 5991–5997.
[13] F. d'Orlye, A. Varenne, P. Gareil, Determination of nanoparticle diffusion coefficients by Taylor dispersion analysis using a capillary electrophoresis instrument, J. Chromatogr. A 1204 (2) (2008) 226–232.
[14] J. Chamieh, F. Oukacine, H. Cottet, Taylor dispersion analysis with two detection points on a commercial capillary electrophoresis apparatus, J. Chromatogr. A 1235 (2012) 174–177.
[15] W.P. Wuelfing, A.C. Templeton, J.F. Hicks, R.W. Murray, Taylor dispersion measurements of monolayer protected clusters: a physicochemical determination of nanoparticle size, Anal. Chem. 18 (71) (1999) 4069–4074.
[16] J. Chamieh, J.P. Biron, L. Cipelletti, H. Cottet, Monitoring biopolymer degradation by Taylor dispersion analysis, Biomacromolecules 16 (12) (2015) 3945–3951. [17] H. Cottet, J. Biron, L. Cipelletti, R. Matmour, M. Martin, Determination of individual
diffusion coefficients in evolving binary mixtures by Taylor dispersion analysis: appli-cation to the monitoring of polymer reaction, Anal. Chem. 82 (5) (2010) 1793–1802. [18] B.M. Belongia, J.C. Baygents, Measurements on the diffusion coefficient of colloidal
particles by Taylor Aris dispersion, J. Colloid Interface Sci. 195 (1) (1997) 19–31. [19] L. Cipelletti, J.P. Biron, M. Martin, H. Cotett, Polydispersity analysis of Taylor dispersion
data: the cumulant method, Anal. Chem. 86 (13) (2014) 6471–6478.
[20] L. Cipelletti, J.P. Biron, M. Martin, H. Cottet, Measuring arbitrary diffusion coefficient distributions of nano-objects by taylor dispersion analysis, Anal. Chem. 87 (16) (2015) 8489–8496.
[21] F. Oukacine, A. Morel, I. Desvignes, H. Cottet, Size-based characterization of nanoparticle mixtures by the inline coupling of capillary electrophoresis to Taylor dispersion analysis, J. Chromatogr. A 1426 (2015) 220–225.
[22] A. Ibrahim, H. Ohshima, S.A. Allison, H. Cottet, Determination of effective charge of small ions, polyelectrolytes and nanoparticles by capillary electrophoresis, J. Chromatogr. A 1247 (2012) 154–164.
[23] T. Yonezawa, T. Tominaga, N. Toshima, Novel characterization of the structure of sur-factants on Nanoscopic metal clusters by a physicochemical method, Langmuir 11 (12) (1995) 4601–4604.
[24] M. Höldrich, S. Liu, M. Epe, M. Lammerhofer, Taylor dispersion analysis, resonant mass measurement and bioactivity of pepsin-coated gold nanoparticles, Talanta 167 (2017) 67–74.
[25] U. Pyell, A.H. Jalil, D.A. Urban, C. Pfeiffer, B. Pelaz, W.J. Parak, Characterization of hydrophilic coated gold nanoparticles via capillary electrophoresis and Taylor dispersion analysis. Part II: determination of the hydrodynamic radius distribution - comparison with asymmetricflow field-flow fractionation, J. Colloid Interface Sci. 457 (2015) 131–140.
[26] F. Ye, H. Jensen, S.W. Larsen, A. Yaghmur, C. Larsen, J. Østergaard, Measurement of drug diffusivities in pharmaceutical solvents using Taylor dispersion analysis, J. Pharm. Biomed. Anal. 61 (2012) 176–183.
[27] K.D. Hartlen, P.T. Athanasopoulos, V. Kitaev, Facile preparation of highly monodisperse small silica spheres (15 to > 200 nm) suitable for colloidal templating and formation of ordered arrays, Langmuir 5 (24) (2008) 1714–1720.
[28] J.B. Vicent Pena, K. Kund, U. Hempelmann, W. Wohlleben, T. Koch, A. Burke, G. McNulty, A. Hartl-Gunselmann, S. Knobl, M. Reisinger, D. Gilliland, N. Gibson, B. Sokull-Klüttgen, H. Stamm, H. Liewald, Basic comparison of particle size distribution measurements of pigments andfillers using commonly available industrial methods, EUR - Sci.Tech. Res. Rep. (2014) 1–88.
[29] A. Scotti, W. Liu, J.S. Hyatt, E.S. Herman, H.S. Choi, J.W. Kim, L.A. Lyon, U. Gasser, A. Fernandez-Nieves, The CONTIN algorithm and its application to determine the size distribution of microgel suspensions, J. Chem. Phys. 142 (23) (2015) 234905–234913. [30] B. Jachimska, M. Wasilewska, Z. Adamczyk, Characterization of globular protein solu-tions by dynamic light scattering, electrophoretic mobility, and viscosity measurements, Langmuir 24 (13) (2008) 6866–6872.
[31] J. Ricka, Dynamic light scattering with single-mode and multimode receivers, Appl. Opt. 32 (15) (1993) 2860–2875.
[32] S. Balog, D.A. Urban, A.M. Milosevic, F. Crippa, B. Rothen-Rutishauser, A. Petri-Fink, Taylor dispersion of polydisperse nanoparticles, J. Nanopart. Res. 19 (8) (2017) 287 Manuscript submitted for publication.