researchers and makes it freely available over the web where possible
Any correspondence concerning this service should be sent
to the repository administrator:
[email protected]
This is an author’s version published in:
http://oatao.univ-toulouse.fr/26627
To cite this version: Sanviemvongsak, Tom and Monceau, Daniel
and Desgranges, Clara and Macquaire, Bruno Intergranular
oxidation of Ni-base alloy 718 with a focus on additive
manufacturing. (2020) Corrosion Science, 170. 108684. ISSN
0010938X
Intergranular oxidation of Ni-base alloy 718 with a focus on additive
manufacturing
Tom Sanviemvongsak
a,b,*, Daniel Monceau
a, Clara Desgranges
b, Bruno Macquaire
baCIRIMAT, Université De Toulouse, CNRS, INPT, ENSIACET, 4 Allée Emile Monso, BP 44362, 31030, Toulouse Cedex 4, France bSafran Paris-Saclay, Safran Tech, Rue Des Jeunes Bois, Châteaufort, CS 80112, 78772, Magny-Les-Hameaux, France
A R T I C L E I N F O
Keywords: Superalloys Laser beam melting Electron beam melting Grain boundaries oxidation Thermocalc
Diffusion
A B S T R A C T
The intergranular oxidation in air at 850 °C of alloy 718 produced by laser beam melting and electron beam melting was compared to that of the wrought alloy. Quantitative analyses revealed that the amount of grain boundary oxidation was similar for these alloys. However, the additively manufactured ones presented deeper and thicker oxides at grain boundaries, due to grain size heterogeneity and to a smaller number of special boundaries. Results show that intergranular oxidation kinetics follows Wagner’s theory on internal oxidation considering not only O diffusion at the intergranular oxide/metal interfaces but also Al and Ti diffusion in the bulk.
1. Introduction
1.1. Review of intergranular oxidation of alloy Ni-base alloys
Alloy 718 (UNS N07718) is extensively used in aeronautical and nuclear applications because of its good mechanical properties at high temperature and its high-temperature oxidation resistance. Up to 650 °C, the oxidation of the polycrystalline alloy 718 may not be a problem in terms of metal consumption but this alloy is susceptible to intergranular oxidation which can cause premature mechanical failure after a long term exposure. This is the case even at lower temperatures in nuclear applications. The increase in efficiency of aircraft turbines is partly due to an increase in operating temperatures. Higher tempera-tures lead to an increase in oxidation kinetics, and intergranular oxi-dation becomes noticeable, as seen previously at 850 °C [1–3]. This form of oxidation is known to induce intergranular embrittlement and provoke intergranular fatigue crack propagation [4–8]. Al, Ti and Nb are used as alloying elements to harden the material by precipitation of γ’, γ” and δ phases. These elements have a high affinity with oxygen which can lead to grain boundary oxidation (GBO) at very low oxygen content below the chromia oxide scale. Acconrdingly aluminium oxide α-Al2O3 [1,9] and titanium oxide rutile-TiO2 [3] were found in the
grain boundaries (GB) of alloy 718.
It is well established that alloy’s GBs are preferential pathways for the diffusion of alloying elements as well as oxygen. The O diffusion coefficient in the bulk of pure nickel has been determined elsewhere
[10]. Two other studies investigated the penetration depth of O through grain boundaries. The O was found to react with carbon in the metal to form gas bubbles. The estimated activation energy for this reaction is close to 280 kJ/mol [11,12]. A recent study carried out on Fe-0.5 % Si, showed that the O diffusion coefficient along GBs, determined using Wagner’s theory, could be 60–70 times higher than through the bulk [13]. In this latter study, the intergranular oxidation kinetics was supposed to be controlled only by the diffusion of O through the GBs. But when intergranular oxidation occurs, O may diffuse through metal/ intergranular oxide interfaces. When dealing with internal oxidation kinetics in Ni-Al alloys, Stott et al. determined that O diffusion at Ni/ Al2O3incoherent interfaces was several orders of magnitude faster than
in the bulk at 1050–1100 °C [14].
Preferential intergranular oxidation has already been studied in model alloys such as Ni-Cr [15,16] or Ni-Al [17,18]. Four types of in-tergranular oxidation were described by Shida et al. in Ni-Al alloys [17]. These authors showed that several types of morphologies could be observed depending on Al concentration and oxidation temperature. It was shown that the depth of intergranular oxides decreased by in-creasing Cr concentration in Ni-Cr alloys with small Cr content (Ni-1 to 5 wt. % Cr), in agreement with Wagner’s theory on internal oxidation [16]. For Ni-Cr-Al model alloys, three different oxidation mechanisms were identified [19]. The first one concerns Ni-Cr-Al alloys containing a small amount of Cr (5 wt. % Cr) and Al (inferior to 3 wt. % Al), for which the external NiO scale is supplemented by internally oxidised Cr and Al. The second case concerns alloys with a large amount of Cr
⁎Corresponding author at: CIRIMAT, Université de Toulouse, CNRS, Toulouse INP, ENSIACET, 4 allée Emile Monso, BP 44362, 31 030, Toulouse Cedex 4, France.
E-mail address:[email protected](T. Sanviemvongsak).
(20–30 wt. % Cr) and a relatively low Al content (2 wt. % Al). These alloys, present a Cr2O3-external scale and an Al2O3oxide in the
sub-scale, particularly concentrated at grain boundaries. This latter me-chanism is typically the one found in alloy 718. Lastly, the third case concerns alloys with high Al content (4–9 wt. % Al) forming a thin and dense Al2O3-external scale with no internal or intergranular oxidation
[19]. Moreover, in certain cases, voids were found near the oxides formed at grain boundaries and within the bulk inside the Cr-depleted zone, for long-duration oxidation of Ni-15.1Cr-1.1Al and Ni-28.8Cr-1.0Al at 1000 °C and 1200 °C [20]. The formation of these voids was attributed to a Kirkendall effect, as seen in other studies on Ni-Cr alloys [15,21,22].
In order to increase the durability of aircraft turbines and pres-surised reactor components, increasing the resistance of grain bound-aries to oxidation, thereby reducing mechanical stress and fatigue in oxidising environments, should be assessed [23,24]. A study on the impact of grain size on high temperature oxidation was carried out on Cr steels [25]. This study revealed that increasing the grain size on low-Cr steels (2.25 wt. % low-Cr) improved oxidation resistance in terms of mass change and limited the growth of the inner oxide, especially during the transient stage. Indeed, by increasing the grain size, the volume fraction of short-circuits for the diffusion of O along GB is reduced. Conversely, for high-Cr steels (18 wt. % Cr), the combination of a high Cr content with a high fraction of diffusion short-circuits such as grain boundaries, favours the fast diffusion of Cr and the formation of a dense and pro-tective chromia scale. This result was also found in alumina-forming alloys [26].
1.2. Specific features for alloy 718 fabricated by additive manufacturing While studying alloy 718 fabricated by additive manufacturing, the specific microstructure should be considered as well as its consequences on intergranular oxidation. It has been shown that porous materials fabricated with unoptimised parameters suffered from large internal oxidation attacks leading to a large mass gain during oxidation tests [2]. But even dense alloys show microstructural specificities that can influence intergranular oxidation kinetics [3]. Indeed, the building di-rection of AM samples (the vertical didi-rection Z, perpendicular to the powder bed) was found to impact grain boundary density and conse-quently the oxidation resistance of alloy 718 produced by EBM [27]. Indeed, numerous studies showed that special grain boundaries and particularly Σ3-boundaries, presented a higher resistance to inter-granular oxidation [28–30]. Trindade et al. [8,9] showed that repeated thermomechanical processing increased the fraction of special grain boundaries, especially of Σ3-boundaries, up to 35 %. They showed that samples with a high fraction of special boundaries had better oxidation resistance in terms of mass gain but also in terms of intergranular oxidation depth.
1.3. Intergranular oxidation of additively manufactured alloy 718 None of the previously cited articles studied the intergranular oxi-dation resistance of additively manufactured samples and compared it to the intergranular attack of wrought material. Our first study focused on the difference in oxidation kinetics between an LBM-718 alloy, an EBM-718 alloy and a conventionally-wrought heat-treated alloy 718 [3]. Results showed similarities regarding oxidation resistance and oxide scale nature, but dissimilarities regarding GBO.
Therefore, the present paper focuses on the differences in inter-granular oxidation resistance of the cited alloys oxidised at 850 °C for up to 3000 h. First, a quantification of intergranular oxidation kinetics will be presented and compared to literature data regarding wrought or additively manufactured alloys. Then, a characterisation of the micro-structure, focused on grain size, misorientation and nature of GBs will be performed. The impact of grain size and grain boundary nature on GBO will be discussed. Finally, through a WDS analysis and a literature
review on diffusion coefficients, the mechanism of intergranular oxi-dation will be discussed.
2. Materials and experimental procedures 2.1. Additive manufacturing of alloy 718
The alloys 718 studied in the present paper were produced using two different powder bed fusion processes : laser beam melting (LBM) and electron beam melting (EBM). They were produced with the ma-chine manufacturer’s standard settings, respectively EOS™ and ARCAM™, and were studied in their as-built form, without heat-treat-ment. They were compared to the heat-treated wrought (WRG) alloy 718 (AMS 5662). A more detailed description of these alloys can be found in a previous paper [3], which contains the characterization of their chemical composition, their microstructure and the description of the AM parameters used to build these samples.
2.2. High temperature oxidation experiments
Samples were prepared for 48-h, 1000-h and 3000-h isothermal oxidation tests. Their dimensions approached 15 × 10 × 2 mm3and all
sample surfaces were ground using P600-SiC paper. The grinding depth needed to remove the initial roughness was lower than 100 μm for the raw LBM sample and lower than 500 μm deep for the EBM raw sample. Samples were ultrasonically cleaned in acetone and ethanol, then dried before oxidation testing.
The three different alloys, LBM, EBM and wrought, were tested at 850 °C in a SETARAM™ TAG 24 S thermobalance with ± 0.1 μg sensi-tivity, for the 48-h oxidation test under flowing synthetic air (5 mL min−1) in a reaction tube of diameter 14 mm.
The 1000-h and 3000-h oxidation tests were carried out in a box furnace in still laboratory air and weighed with a Sartorius ME215 P balance with ± 20 μg sensitivity.
2.3. Characterisation of oxidized samples
External oxide scale characterisation was carried out by means of X-ray diffraction conducted with a 10°-incidence mode, with a Bruker™ D8 (kα = 1.5418 Å), and scanning electron microscopy (SEM
LEO435VP) equipped with an energy dispersive X-ray spectroscopy detector (EDS PGT IMIX-Ge). The cross-sections of oxidised samples were analysed using SEM.
The quantification of external oxide scale thickness and of inter-granular oxidation was carried out using Image J software. External scale thickness was calculated as follows: the surface area of the ex-ternal oxide scale was measured with image analysis, and the result was divided by the length of the oxide scale on the cross section (about 500–800 μm). Intergranular oxide areas were quantified on 30–50 grain boundaries for each sample. Five micrographs, with a dimension of 50 × 35 μm² for the 48-h and 1000-h test samples, and a dimension of 100 × 70 μm² for the 3000-h test samples, were taken on each sample and analysed. The grain orientation and the chemical nature of oxides at grain boundaries were identified using a scanning electron micro-scope (JEOL JSM-7100TTLS LV) equipped with an EDS detector (X-Max, Oxford Instruments) and an EBSD camera (NordlysNano, Oxford Instruments). The chemical composition and the elements' concentra-tion profiles were measured using an electron probe microanalyser (EPMA SX Five FE CAMECA) calibrated on standards at 7 kV and 20 nA. The chemical composition of the three alloys 718 is reported in Table 1. It can be noticed that the three alloys have almost the same chemical composition. For this paper, it is important to focus on the content of Al, which can react with O in the grain boundaries, and the content of Nb, which can be present in the grain boundaries as δ-phase precipitates.
3. Results and discussions
3.1. Isothermal air oxidation kinetics and external/internal scale characterisation
3.1.1. Oxidation kinetics
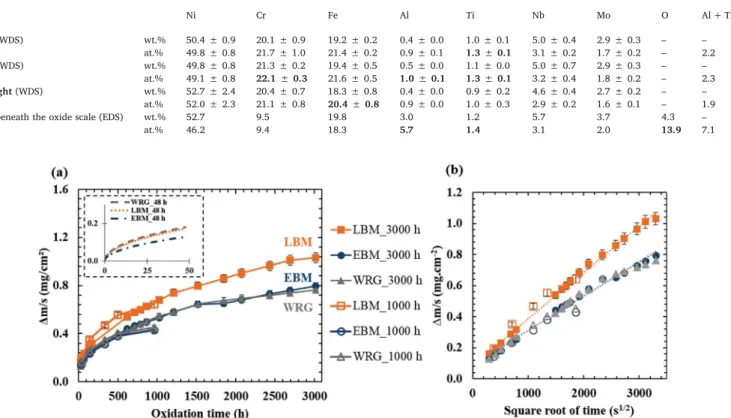
Fig. 1(a) shows the mass variations per unit area Δm/S (mg cm−2) as
a function of time of the three alloys 718. The overall relative error on the mass gain per surface area is lower than 4 %. Results show that the mass gain of LBM samples (1 mg cm−2) is 25 % higher than that of EBM
and wrought samples (0.7 mg cm−2). The oxidation rate shift occurs
during the transient stage, whereas during the stationary stage, when the protective chromia scale was well established, the three samples had similar oxidation rates. All samples presented a relatively low mass gain, less than 1.2 mg cm−2after 3000 h of air oxidation, which
cor-responds to an oxide scale thickness of approximately 7 μm if we as-sume that most of the mass gain is due to the formation of an external scale made of chromia. In Fig. 1(b), regardless of the manufacturing process, all oxidation curves follow parabolic kinetics. Only a very slight decrease in the slopes can be observed on the parabolic plots after 2500² s (i.e. 1700 h) for wrought and EBM alloys. Parabolic rate con-stants,kp, were determined by plotting mass gains versus square root of
time [31] over 3000 h, using the following Eq.(1)
= + m s k t C ∆ . p (1)
Where C is a constant depending on the transient stage of oxidation. kpvalues determined from 48-h to 3000-h oxidation tests are shown
inTable 2. These values were quite similar, ranging from 0.4 × 10⁻⁷to
1.8 × 10⁻⁷mg² cm−4s−1and were similar to those previously found
[3]. The maximum overall error made on the determination of kp
reached 8 %. After long oxidation tests (1000 h and 3000 h), LBM samples showed an estimated kpvalue 20–30 % higher than those found
for EBM and wrought samples. This result is consistent with the mass gain differences. In a word, the three alloy 718 samples presented a good oxidation resistance and EBM and wrought samples presented slightly slower oxidation rates compared to LBM samples.
3.1.2. Oxide scale and cross-section analyses
The nature of the oxide scale was determined by combining XRD and EDS analyses.Fig. 2shows the diffraction diagrams of a 718 LBM sample oxidised at 850 °C in air for 3000 h. The diffraction diagrams were taken with a X-ray source setting with a low and constant in-cidence angle of 10° in order to better reveal the oxide scale nature. Results show that the oxide layer of the three alloys is mainly composed of Cr2O3(a,b =4.96 Å, c =13.60 Å, R-3cH), with small amounts of
rutile-TiO2 (a,b =4.59 Å, c = 2.96 Å, P42/mnm), α-Al2O3 (a,b
=4.76 Å, c =13.0 Å, R-3cH) and spinel (a,b,c =8.44 Å, Fd-3 mS). In addition, some X-ray peaks of the δ phase (a =5.11 Å, b =4.25 Å, c =4.54 Å, PmmnS) are also identified, especially in EBM and wrought samples. As seen in a previous paper [3], XRD peaks for Al2O3and TiO2
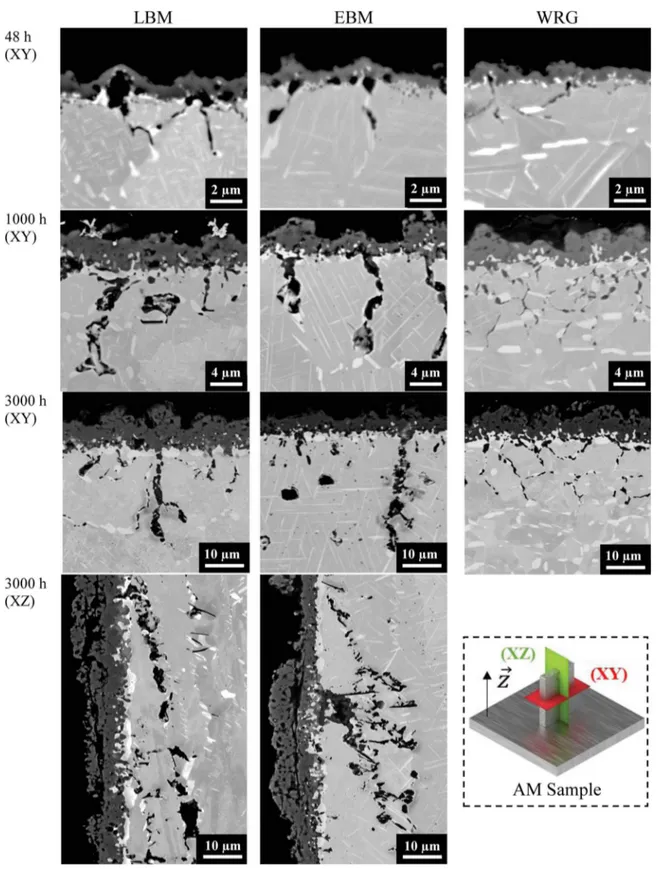
are certainly due to grain boundary oxidation (GBO). Enrichment in Nb was observed below the metal/oxide interface. But no δ-phase peaks were observed in the X-ray diffraction diagram of the LBM sample. Then, the cross-section of the three samples were analysed by SEM-EDS, WDS and EBSD.Fig. 3shows SEM-BSE micrographs of the cross-section of oxidised LBM, EBM and wrought samples. All samples showed a thick and dense external oxide scale identified as a Cr2O3scale. Beneath the
oxide scale, at the metal/oxide interface, EBSD analysis revealed a thin layer of δ phase on all three materials.
3.1.3. Grain boundary oxidation
GBO was observed as seen previously in [3], and oxides in the GB were identified as TiO2and Al2O3using EBSD. The most stable oxide for
a metal activity of 1 is Al2O3, and it was found deeper in the grain
boundaries, beneath the TiO2. Some of the GBO penetrations appeared
Table 1
Quantitative WDS and EDS analyses of the chemical composition of tested alloy 718 samples.
Ni Cr Fe Al Ti Nb Mo O Al + Ti LBM (WDS) wt.% 50.4 ± 0.9 20.1 ± 0.9 19.2 ± 0.2 0.4 ± 0.0 1.0 ± 0.1 5.0 ± 0.4 2.9 ± 0.3 – – at.% 49.8 ± 0.8 21.7 ± 1.0 21.4 ± 0.2 0.9 ± 0.1 1.3 ± 0.1 3.1 ± 0.2 1.7 ± 0.2 – 2.2 EBM (WDS) wt.% 49.8 ± 0.8 21.3 ± 0.2 19.4 ± 0.5 0.5 ± 0.0 1.1 ± 0.0 5.0 ± 0.7 2.9 ± 0.3 – – at.% 49.1 ± 0.8 22.1 ± 0.3 21.6 ± 0.5 1.0 ± 0.1 1.3 ± 0.1 3.2 ± 0.4 1.8 ± 0.2 – 2.3 Wrought (WDS) wt.% 52.7 ± 2.4 20.4 ± 0.7 18.3 ± 0.8 0.4 ± 0.0 0.9 ± 0.2 4.6 ± 0.4 2.7 ± 0.2 – – at.% 52.0 ± 2.3 21.1 ± 0.8 20.4 ± 0.8 0.9 ± 0.0 1.0 ± 0.3 2.9 ± 0.2 1.6 ± 0.1 – 1.9
LBM beneath the oxide scale (EDS) wt.% 52.7 9.5 19.8 3.0 1.2 5.7 3.7 4.3 –
at.% 46.2 9.4 18.3 5.7 1.4 3.1 2.0 13.9 7.1
Fig. 1. (a) Isothermal oxidation kinetics and (b) apparent parabolic oxidation rate fitting of three alloys 718 (LBM, EBM, wrought) P600-ground and oxidised at 850 °C for 48 h, 1000 h and 3000 h (48 h experiments were conducted in TGA under synthetic air flow, the others in static lab air).
deeper in AM samples than in the wrought sample. Thicker oxide at the GB was also found in AM samples.
3.1.4. Nb-rich oxide in the external oxide scale
The EPMA-WDS analysis presented inFig. 4confirmed the presence of Al and Ti-rich oxides at the GB, but also showed the presence of a (Ti,Nb)-rich oxide in the scale close to the metal oxide interface. This oxide was identified as TiNbO4by combining WDS and EBSD analyses.
TiNbO4has a rutile-type structure (a,b = 4.74 Å, c = 3.0 Å, P42/mnm).
The oxidation of the metal produces a thin Nb-rich layer at the metal/ oxide interface. This layer can be observed in 48-h tests and thickens as oxidation time increases. It can still be observed in 1000-h tests, and for such durations Nb remains unoxidised. In samples oxidised for 3000 h however, the Nb is oxidised locally; TiNbO4was indeed detected. In
previous studies, a small amount of FeNbO4was found in alloy 718
after 1 h at 1000 °C [33]. NbO was also found after 100-h oxidation tests at the same temperature [27]. However, this last result was not con-firmed by XRD analyses, and by referring to their EDS element maps, it does not seem that the Nb was oxidised. Nb2O5oxides were found on
alloy 718 oxidised at 650 °C for 1000 h [34]. In addition, another work on alloy 625 [35] showed that above 1100 °C, the δ phase present be-neath the oxide scale oxidised and formed NbCrO4, another oxide with
a rutile-type structure.
3.1.5. Thermodynamic calculations on the relative stability of the different oxides
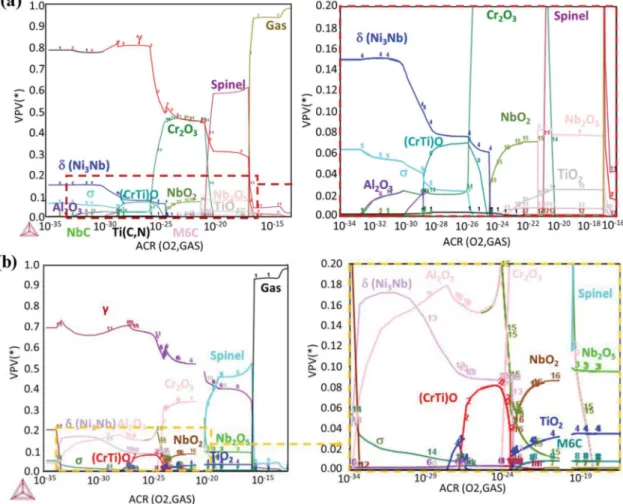
As several oxides were observed in the oxide scale and in the grain boundaries underneath, a thermodynamic analysis was performed in order to evaluate whether obtained results were in agreement with local equilibrium. These calculations were performed with Thermocalc™ software using the TCNi9 Ni-database. First, a calculation of the volume fraction of phases at equilibrium at 850 °C was done as a function of O content (i.e. as a function of oxygen chemical potential or of oxygen partial pressure). This kind of calculation does not represent the actual oxygen gradient across the real system, because it is per-formed with the composition of the alloy and does not take into account the diffusion of the alloying elements. It is only carried out to check the relative stability of the oxides, i.e. to improve upon the information that would provide a simple Ellingham diagram in which the activity of the metallic elements and the oxide phases is assumed to be 1. For this first calculation, we used the composition of the LBM-718 alloy given in Table 1. The simulation was also conducted using the chemical com-position of the wrought sample. However, this had little influence on the phases determined at the equilibrium, when compared to the AM material, therefore this last result is not shown. The result of this first calculation is given inFig. 5. This graph gives the most stable phases that can be formed in an alloy having the composition of alloy 718, as a function of O content. It is useful to find out which are the most stable oxides in contact with the metal by taking into account the chemical activity of the metallic elements in the alloy. Indeed, since the Table 2
Parabolic rate constant kp, kp’, kpGBOand kpGBOmaxof air oxidation tests carried out at 850 °C for 48 h, 1000 h and 3000 h, all samples were ground using P600-SiC
paper.
Test conditions at 850 °C
Process Mass gain (mg cm−²) kp(mg² cm−4s−1) Equation (1) (×10−7) Oxide scale thickness (μm) kp’ (μm² s−1) kp ‘= e² t−1 (×10−6) GBO Average depth (μm) kpGBO (μm² h−1) Equation (2) (×10−2) GBO Maximum depth (μm) kpGBO max (μm² h−1) Equation (2) (×10−2) TGA or Furnace Time (h) TGA 48 LBM 0.16 ± 0.01 1.7 ± 0.27 1.0 ± 0.2 5.7 ± 0.97 3.0 ± 1.4 19 ± 3.2 4.4 40 TGA 48 EBM 0.12 ± 0.01 1.0 ± 0.16 0.7 ± 0.2 4.0 ± 0.68 2.4 ± 1.4 12 ± 2.0 2.8 27 TGA 48 WRG 0.17 ± 0.01 1.8 ± 0.29 0.6 ± 0.1 3.4 ± 0.58 2.3 ± 1.2 11 ± 1.9 3.9 32 Furnace 1000 LBM 0.61 ± 0.02 1.0 ± 0.16 3.7 ± 0.1 1.0 ± 0.17 8.7 ± 6.2 7.6 ± 1.3 14.2 20 Furnace 1000 EBM 0.44 ± 0.02 0.4 ± 0.02 2.6 ± 0.2 0.72 ± 0.12 7.9 ± 5.2 6.2 ± 1.1 12.3 15 Furnace 1000 WRG 0.45 ± 0.02 0.4 ± 0.02 3.4 ± 0.6 0.94 ± 0.16 8.6 ± 2.8 7.3 ± 1.2 11.2 13 Furnace 3000 LBM 1.03 ± 0.04 1.1 ± 0.18 7.7 ± 0.2 0.71 ± 0.12 17.7 ± 10.2 10 ± 1.7 33.9 29 Furnace 3000 EBM 0.79 ± 0.03 0.7 ± 0.11 6.9 ± 0.6 0.63 ± 0.11 18.2 ± 12.2 11 ± 1.9 35.4 34 Furnace 3000 WRG 0.76 ± 0.03 0.7 ± 0.11 7.0 ± 0.7 0.65 ± 0.11 18.6 ± 4.0 11 ± 1.9 19.4 16
concentrations of Ti and Al are very low in the alloy, a calculation is necessary to know if Al2O3and TiO2are more stable than Cr2O3 on
alloy 718. For very low O partial pressures (below 10−33atm),Fig. 5(a)
shows the equilibrium phases in alloy 718 at 850 °C, with 6 % of sigma phase, 15 % of delta phase and two other phases under 1 vol. %, namely phase 3, which corresponds to (Nb,Ti)C, and phase 2, to TiCN. ForPO2
superior to 10−33atm, the first stable oxide is corundum Al 2O3. This
agrees with the fact that Al2O3 was observed deeper in the grain
boundaries, where O activity is the lowest. The second stable oxide is TiO with some Cr in solid solution. Here again, this is in agreement with the observation of a Ti-rich oxide in the grain boundaries less deep than the alumina, despite the fact that thermodynamics predicted TiO whereas diffraction (EBSD) revealed TiO2. The third oxide is corundum
Cr2O3in agreement with the formation of a chromia oxide scale on the
Fig. 3. SEM-BSE micrographs of the cross-section of oxidised LBM, EBM and wrought samples all ground with P600 SiC paper, oxidised for 48 h in synthetic air or for 1000 h and 3000 h in static lab air.
alloy. It can also be noticed that, at PO2 superior to 10-25atm, the
niobium oxide NbO2 is stable, along with the chromia and a small
quantity of TiO2. This is consistent with the Nb oxide observed in the
chromia scale even though the TiNbO4 phase is not predicted by
Thermocalc™ (TiNbO4is not in the TCNi9 database). TiNbO4,which
was identified by diffraction as a rutile-type structure, results from a mixture of NbO2 and TiO2, both having a rutile-type structure. At
higherPO2, Cr2O3is still the most stable oxide, along with TiO2and
Fig. 4. EPMA-WDS analyses of the cross-section of an LBM sample in the (XY) plane oxidised at 850 °C for 3000 h in static lab air.
Fig. 5. Volume fraction of stable phases present in alloy 718 at 850 °C as a function of oxygen partial pressure, Thermocalc calculation (TCNi9) a) for the nominal composition of alloy 718, b) for the composition of the Cr-depleted area below the oxide scale experimentally measured.
Nb2O5. The metallic γ phase (pure Ni at this stage) is still present up to
10-13atm. Therefore, all these results can be considered as pertinent for
the alloy below and close to the metal/oxide interface. ForPO2superior
to 10−13atm, all the metal is oxidised. If a sample of alloy 718 is fully
oxidised in a high oxygen pressure atmosphere, it should result in a spinel oxide ((Ni,Fe)(Cr,Fe)2O4) with a small quantity of halite NiO,
Nb2O5and TiO2.
When oxidising alloy 718, an enrichment in Nb was observed in the metal underneath the oxide scale. As stated in [32], this is due to thermokinetic reasons. The region underneath the oxide scale is also depleted in Cr due to the formation of a protective chromia scale. Therefore, the same thermodynamic calculation was done, but this time not with the composition of the LBM-718 alloy but with the composi-tion of the alloy below the oxide scale formed after 3000 h at 850 °C. This composition, given in the lower part ofTable 1, was measured by quantitative SEM-EDX on the LBM sample and by averaging the com-position in three rectangle areas of 125 × 6 μm² directly under the external scale. Underneath the oxide scale, the concentration of Cr dropped since Cr was used to form the external-Cr2O3scale. Conversely,
Al and Ti concentrations increased because they were drained from deeper in the alloy to form Al2O3or TiO2at the grain boundaries under
the oxide scale.
Fig. 5(b) shows the result of the second thermodynamic evaluation, using the composition of alloy 718 depleted in Cr but enriched in Al and Ti. It can be seen that the sequence of oxide phases remains the same but their quantities have changed. Indeed, the smallest PO2 values
(PO2< 10−25atm) lead to higher quantities of Al2O3and δ phase, as
compared to the results of the first calculation. ForPO2 higher than
10−25atm, the quantity of Cr
2O3and spinel decreases slightly, whereas
the quantities of rutile oxides, TiO2and NbO2,increase slightly.
To summarize, the thermodynamic evaluations were done using the composition of alloy 718, either using the bulk composition or the composition of the Cr-depleted area under the oxide scale. Even if the calculations do not represent directly the gradient of microstructure in an oxidized sample, because they do not take into account the diffusion of the alloying elements such as the upward diffusion of Cr, they reveal that the different oxides where found from the bulk to the surface in the order corresponding to the increasing oxygen activity. Al2O3 forms
deeper in the alloy, TiO forms at slightly higherPO2where chromia is
not stable. AtPO2higher than 10−25atm, Cr2O3oxide is stable and it is
shown that NbO2and TiO2(and then probably NbTiO4) are
thermo-dynamically stable in contact with Cr2O3. At high PO2(above 10
−13
atm), all the metal is oxidised, the spinel phase ((Ni,Fe)(Cr,Fe)2O4) is
formed in equilibrium with Cr2O3and TiO2. This means that the spinel
phase will form in the outer part of the chromia scale if enough Fe and Ni cations can diffuse outward through the chromia layer. Similarly, TiO2will form on the chromia scale if the outward diffusion of Ti is
sufficient. Variations in alloy composition due to Cr depletion, or small composition changes due to different powder compositions or loss of some elements during AM, are unlikely to change the microstructure of the oxide scale.
3.2. External oxide scale and intergranular oxidation quantification and kinetics
3.2.1. Quantification of the oxide scale thickness and GBO by SEM image analysis
SEM image analysis was conducted to quantify external oxide scale thickness, GB oxide penetration depth and intergranular oxide thick-ness, as explained in §2. To do so, images similar toFig. 3were used. Results are presented in Fig. 6. After 3000 h at 850 °C, as shown in Fig. 6(a), the oxide scale on the LBM sample was found to be a little thicker (8 μm) than those found on EBM and wrought samples (6−7 μm). This could explain the slightly larger mass gain found in the LBM sample inFig. 1. Moreover, as seen inFig. 6(b), the penetration depth of GBO increased with oxidation time. The morphology of GBO
appeared more heterogeneous in the AM samples than in the wrought alloy. For instance, AM samples showed the deepest penetration of oxides at grain boundaries despite the fact that all samples presented a similar GBO depth average. InFig. 6(c), it can be noticed that the two AM samples present the thickest oxide at the grain boundaries. This quantification confirms what can be seen inFig. 3.
However, as presentedFig. 6(d), the three samples showed similar average of “GBO-to-scale equivalent thickness”. This parameter was defined from the cross-section as the measured area of oxides formed at GB over the length of the sample surface. This corresponds to the quantity (in terms of area) of oxide in the grain boundaries for a given sample surface area. With this parameter, it is possible to compare the mass gain resulting from the formation of the external scalewith the mass gain resulting from internal and intergranular oxidation. For the samples oxidised for 3000 h, the quantification of the intergranular oxidation was conducted in the two main plans: (XY) perpendicular to the building direction and (XZ) parallel to the building direction. It was observed that the depths of intergranular oxidation were similar whichever the building plan, Fig. 6(b). However, in the (XZ) plan, which is parallel to the building direction, one can see the elongated grains that grew along the building direction. From that, the inter-granular oxidation followed the GB of these grains and the GBO ap-peared on a longer distance as compared to what was found in the (XY) plan, but GBO did not go deeper in the alloy. This is an indication that GB oxidation kinetics is not controlled by the depth of the GBO pene-tration, i.e. not controlled by diffusion along the oxides formed at the alloys’ grain boundaries.
The three materials exhibited almost the same quantity of oxide at the alloy GB, but the oxide was thicker and the maximum depth was greater in AM samples than in the wrought sample. The occurrence of deeper GBO in samples fabricated by additive manufacturing could be detrimental to mechanical properties such as tension and fatigue.
3.2.2. Formation of voids
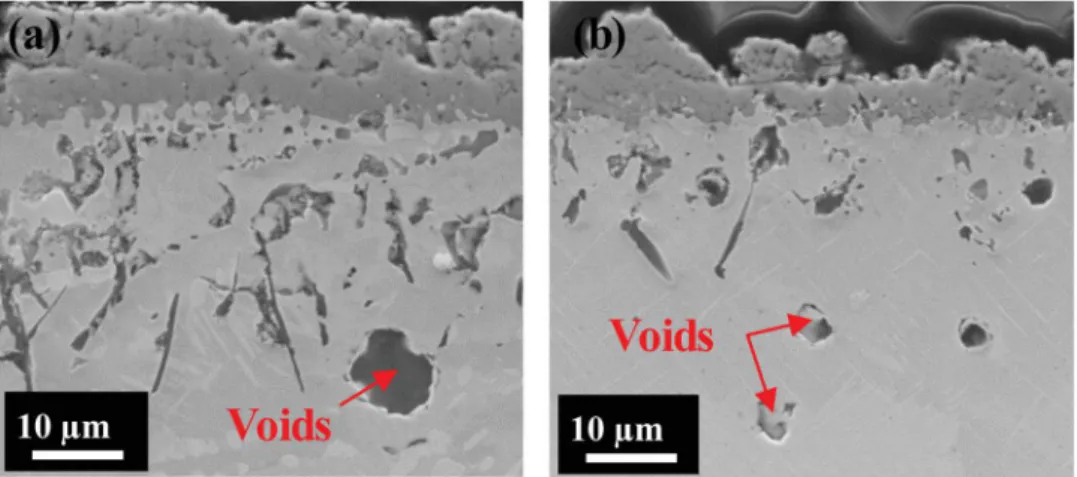
After 3000 h of oxidation at 850 °C, AM samples displayed voids (Ø2–Ø15 μm) in the Cr and δ-phase depletion zone in the grains or at the grain boundaries, especially in the EBM samples, as seenFig. 7. Some of these voids might have been present in the as-built samples with a small size (< Ø5 μm) due to trapped gas bubbles and could have grown during the oxidation test. The growth of voids may result from vacancies injection due to oxidation and/or from a Kirkendall effect due to the Cr-depleted zone under the oxide scale in Ni-Cr alloys [22]. Both phenomena can act simultaneously, vacancies can be injected in the alloy due to Cr consumption to form the oxide scale, and the resulting vacancies in the metal can be “pushed” towards the bulk of the sample because the Cr flux towards the oxide scale is faster than the Ni flux in the opposite direction. The vacancies coalesce to form voids where their oversaturation is maximum and where pre-existing defects favour void nucleation. Nevertheless, these voids were not present in the wrought alloy. This can be explained by the fact that during the hot forming process, the grains were distorted thereby inducing recrystallization and crystal defects such as dislocations [36]. Pieraggi et al. [37] showed that the annihilation of vacancies can be done by a climbing and gliding mechanism of interfacial dislocations next to the metal/oxide interface or by removing dislocation loops without formation of voids. Whereas, in materials containing a low density of dislocations and pre-existing small voids, the annihilation of vacancies is easier by growing pre-ex-isting voids. Since both intergranular oxidation and voids formation can act as crack-initiation sites and consequently affect the mechanical behaviour of materials, it is therefore important to quantify and model this intergranular oxidation in order to better predict mechanical be-haviour.
3.2.3. GBO kinetics
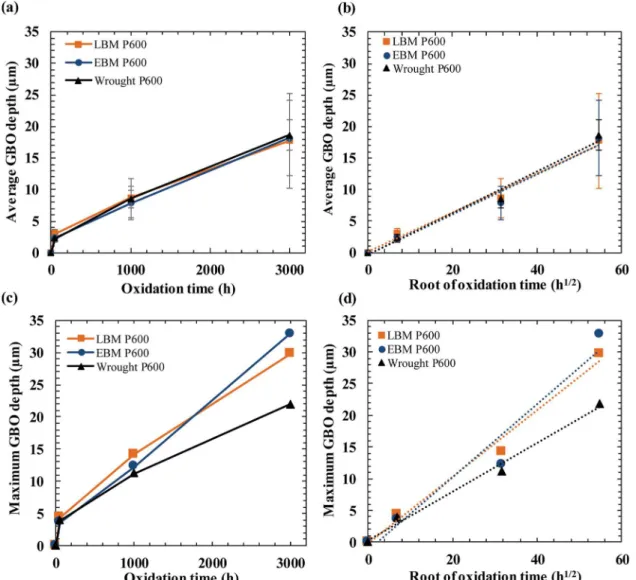
Fig. 8shows the kinetics of the intergranular oxidation in terms of average GBO penetration depth as a function of time. It can be seen that
GBO kinetics can be interpreted either as following linear kinetics after a transient regime of fast oxidation, or as parabolic kinetics with a lower fitting accuracy but with no transient regime. Linear kinetics would mean that GBO growth is controlled by the reaction rate at the tip of the penetration. Whereas parabolic kinetics would imply a pro-cess controlled by diffusion, which could either be the diffusion of O towards the tip of the penetration, or the diffusion of Al and Ti from the bulk towards the extremity of oxides formed at the GB, or both. At this stage, there is not enough data to clarify this point. Nevertheless, it is possible to suppose that the process is controlled by diffusion, as it is often the case in internal oxidation [38].
To verify this mechanism, oxidation kinetics must be consistent with independent evaluations, such as the determination of diffusion coef-ficients. With the assumption of parabolic kinetics, parabolic rate constantskpGBO (μm² h−1) were determined from Eq.(2), they
corre-spond to the slope of the linear fit of the parabolic plots inFig. 8(b).
=
dGBO kpGBO.t (2)
The values ofkpGBOare presented inTable 2.
GBO is known to induce intergranular embrittlement leading to intergranular fatigue crack propagation. Therefore its maximum depth value is a key parameter to consider and thekpGBOmaxcorresponding to
the maximum GBO depth were calculated and presented inTable 2. Results show that in terms of average GB oxide penetration, the three alloys have similar GBO kinetics, as indicated by the kp(mass variation)
and kp’ (oxide thickness). After 3000 h at 850 °C, all alloys presented a
kpGBOof about 1.0 × 10⁻¹μm² h−1for an average GBO depth close to
18 μm. As for maximum GBO depth however, the AM samples' (34-μm deep) was twice as deep after 3000 h of oxidation as the wrought sample's (19-μm deep).
The values ofkpGBO were compared to those estimated based on
literature results [1–3,7–9,16,19,20,29,30,32,39–46] and plotted in an Arrhenius plot shown inFig. 9. Values ofkpGBOfrom the literature were
Fig. 6. Quantification of intergranular oxidation by micrograph analyses of the cross-section of oxidised LBM, EBM and wrought samples in the (XY) plane oxidised 48 h, 1000 h and 3000 h in air.
calculated by measuring ourselves GBO depths from micrographs pre-sented in the published papers. Compared to alloy 718 samples pro-duced by LBM by Jia and Gu, and studied at the same temperature of 850 °C under still laboratory air [2], the as-built LBM and as-built EBM samples studied here presented a much better resistance to inter-granular oxidation. This difference can be explained by important dif-ferences in material density. Moreover, regarding thekpGBOdetermined
from the average of oxide penetration depth, the intergranular oxida-tion resistance of our samples was similar to that of alloy 718 produced by EBM and studied by Juillet et al. [44], and to that of alloy 718 produced by LBM and studied by Calandri et al. [45]. In addition, fur-ther works on alloy 718 at higher temperatures [1,40,46] led to the determination of the activation energy of GBO for alloy 718 between 800 °C and 1050 °C. This value was estimated at 268 kJ mol−1.
At lower temperatures – such as those used in the nuclear field –
kpGBOvalues are orders of magnitude higher than what could be
ex-pected from the extrapolation based on high temperatures. Therefore, the mechanisms controlling GBO kinetics is certainly different at high (> 800 °C) and low (< 400 °C) temperatures.
3.3. Influence of microstructure on GBO
Quantitative WDS and EBSD analyses were conducted to evaluate the impact of microstructure on intergranular oxidation. The first
objective was to understand the difference in GBO between the AM samples and the wrought sample (GBO thickness and maximum depth). Four topics were discussed, namely crystallographic texture, grain size, grain misorientations and nature of grain boundaries.
3.3.1. Effect of alloy texture
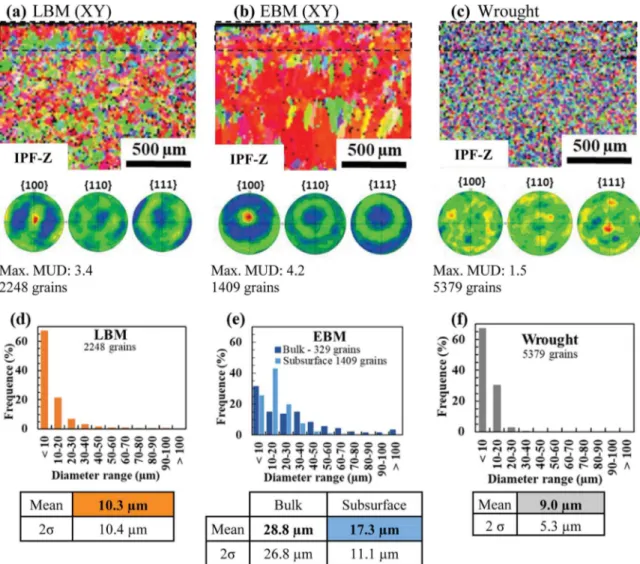
Fig. 10 presents the EBSD analysis of the subsurface beneath the oxide scale. Results show that AM samples present a strong crystal-lographic texture with the < 100 > direction along the growth direc-tion, which was already found in other studies [47,48]. This is due to the temperature gradient during the layer-by-layer melting process. A difference in texture can be observed between LBM and EBM samples. They both have a preferential orientation < 100 > in the growth di-rection, but the LBM sample also has a preferential orientation < 100 > perpendicular to its oxidised surface, this is not the case for the EBM sample.
On the other hand, the heat-treated wrought sample shows only a slight preferential < 111 > orientation, perpendicular to the cross section. The influence of the crystallographic texture of a Haynes 230 superalloy on oxidation was investigated by Xu et al. [49]. They showed that surfaces parallel to {111} planes have a better oxidation resistance than those parallel to {110} or {100} planes. Nevertheless, this result was only noticed during the early stage of the oxidation, after 5 min at 900 °C, and did not affect GBO. In addition, the comparison of the Fig. 8. Isothermal intergranular oxidation kinetics of the three alloys 718 (LBM, EBM, wrought) at 850 °C for 48 h, 1000 h and 3000 h (the 48 h experiments were conducted in TGA under synthetic air flow, the others in static lab air). Graphs a) and b) relate to average GBO depth. Graphs c) and d) relate to the maximum value of GBO depth.
intergranular oxidation in the two planes (XY) and (XZ), inFigs. 3 and 6, shows similar intergranular oxidation depths and similar inter-granular oxidation equivalent thicknesses. For these reasons, the gen-eral crystallographic texture should not have a significant impact on GBO.
3.3.2. Effect of grain size
InFig. 10(d)–(f), it can be noticed that LBM and wrought samples presented similar average grain size, close to 10 μm. The EBM sample presented the largest grains, 17 μm in average in the subsurface zone beneath the oxide scale, but the LBM sample also presented some grains with diameters larger than 30 μm, as seen inFig. 10(d). FromFigs. 3 and 6it was shown that both LBM and EBM samples presented thicker intergranular oxidation compared to the wrought sample. The EBM sample presented the deepest and thickest intergranular oxides as well as the largest grain sizes.
The influence of grain size on the thickness of the oxides formed at the grain boundaries was then investigated. Analyses were conducted on 100 grain boundaries with oxide penetration in each AM sample, and on 50 grain boundaries with oxide penetration found in the wrought sample. InFig. 11(a), results show that there is a very light correlation between grain size and GB oxide thickness. The bigger the grains on each side of the GBO, the thicker the oxide at the grain boundaries. This result can be easily explained by the fact that the quantity of elements needed for the growth of the intergranular oxide, i.e. Al or Ti, is higher in the biggest grains and can induce a larger lateral growth of the intergranular oxide. In addition, as seen inTable 1 the quantity of Ti and Al in the AM samples (2.2 at. %) is slightly higher than in the wrought alloy (1.9 at. %). This could also explain the thicker GBO of AM samples. The quantitative WDS analysis inFig. 12shows that all the Al and Ti contained in the grain next to the GBO was consumed to form the oxide at the grain boundaries. Aluminum thus Fig. 9. Arrhenius diagram of the parabolic constant kpGBO found in this study, compared to values calculated from images published in the litterature
diffuses laterally in the grain to contribute to the lateral growth of the GBO. In addition, the depletion of Al in the grain can reach 70-μm deep, which is deeper than the average depth found for intergranular oxi-dation. Deeper in the alloy, Al and Ti diffuse towards the closest GB and then diffuse quickly outward in the GB towards the tip of the pene-tration, where they react with O diffusing inward from the external oxide scale, along the intergranular oxides.
3.3.3. Effect of GB misorientation and special grain boundaries
The impact of grain misorientation on the quantity of oxide in the grain boundary was evaluated. Here again, as for the grain size, the correlation is very low, as seen inFig. 11(b). There is a very slight increase in the amount of oxide in these grain boundaries with the misorientation between grains in the AM samples. Although this result seems to be consistent in AM samples, it is not true for wrought samples and cannot be used to justify the difference between AM and wrought Fig. 10. EBSD-SEM micrographs and pole-figures of a cross-section of the subsurface zone of samples oxidised 3000 h in static lab air of (a) LBM, (b) EBM and (c) wrought samples in the (XY) plane. Grain diameter distribution of the analysed subsurface of (d) LBM, (e) EBM and (f) wrought samples.
Fig. 11. Correlation graphs used to identify (a) the impact of the misorientation angle between the two grains on each side of the GBO on the intergranular oxide area, and (b) the impact of GBO grain size on intergranular oxide thickness. Analyses conducted on samples oxidised in air at 850 °C for 3000 h.
samples.
Another crystallographic factor could explain the wrought alloy's better resistance to intergranular oxidation. It can be seen in Fig. 13 that the wrought sample presented a high proportion of special grain boundaries. Special grain boundaries are defined as boundaries with a high number of coincident sites in the coincident sites lattice (CSL) characterized by a low Σ factor [50]. In the wrought sample, around 30 % of the grain boundaries detected are special boundaries, against 3 % and 9 % found in LBM and EBM samples respectively. Among the special boundaries detected in the wrought alloy, 25 % were Σ3-twin boundaries. Krupp et al. [9] showed that special grain boundaries found on a wrought alloy 718 containing a high fraction of special grain boundaries such as Σ3-twin boundaries, had a better oxidation re-sistance as compared to random grain boundaries. This result was also found later by Kobayashi et al. on the corrosion behaviour of SUS316 L austenitic steel [51]. It was proposed in the literature that these results could be explained by the fact that O diffusivity is much slower in special grain boundaries [52].
3.3.4. Effect of alloy GB chemistry
The chemical composition of grain boundaries affects alloy prop-erties, it is therefore important to understand how it can result in alloy improvement. Sun et al. [53] found that phosphorus, introduced in the range of 0.0008–0.013 wt. %, enhanced intergranular oxidation re-sistance. P segregates in the alloy grain boundaries and could limit not only O diffusion [53] but also Al and Ti diffusion. As a consequence, GBO appeared thinner and less deep when increasing P concentration. Other GB segregants, such as S, B, C or N, could also have an effect. This could be an explanation as to the difference in intergranular oxidation between AM samples and the wrought alloy, but further high-resolu-tion, atomic-scale characterisations would be necessary to measure the composition at GBs, and presently nothing particular was noticed in the bulk composition of the 3 alloys regarding these impurities.
3.4. Discussion on the intergranular oxidation mechanism
3.4.1. Proposal of a general mechanism of GBO for alloy 718
The schematic diagram inFig. 14shows the intergranular oxidation mechanism discussed throughout this paper and supported by qualita-tive observations. After 48-h oxidation tests at 850 °C, alloy 718, whether additively manufactured or wrought, presented an external scale of chromia and intergranular oxides TiO2and Al2O3,as shown in
Fig. 3. Chromium diffused from the bulk towards the alloy surface, through the grains and the GBs of the alloy, and reacted with O to form an external chromia scale. The grain boundaries are known to act as diffusion short-circuits, this is why the external scale looks like a blister directly above the alloy grain boundaries, indicating that Cr diffusion limits, at least partially, the growth kinetics of the oxide scale.
In the material, at this temperature and with this O partial pressure, Al and Ti contents are sufficient to trigger the reaction with O and were oxidised preferentially, as seen inFig. 5. On the other hand, the con-centrations and diffusion coefficients of Al and Ti are not high enough, in other words the fluxes of these elements towards the surface are not sufficient to form a continuous external scale. Therefore, Al and Ti oxides form internally.
The diffusion of O is not fast enough in the bulk of the grains to form internal oxides disconnected from the external oxide deep in the alloy. But the diffusion of O along GBO/metal interfaces and the diffusion of Al and Ti in metal GBs are fast enough for the intergranular oxide to Fig. 12. EPMA-WDS profile analysis of a cross-section of the EBM sample in the (XY) plane oxidised 3000 h in static lab air (profiles for LBM and wrought samples are similar).
Fig. 13. Proportion of special grain boundaries in the subsurface zone de-termined by EBSD analysis of LBM, EBM and wrought samples oxidised 3000 h in static lab air.
grow. Because diffusion in GB is involved, no GBO was observed in the special grain boundaries (CSL), as found in the following references [8,9,43,52].
The Nb present in the bulk and at GBs as γ’’ and δ precipitates, diffuses outward, similarly to Cr. This is due to the gradient of chemical potential caused by Cr depletion, which acts as a driving force for Nb diffusion [32]. Then, the increasing Nb concentration below the oxide scale induced a re-precipitation of the δ phase below the oxide scale. After 1000 h of oxidation, the oxide scale and the Nb-rich layer grew, the intergranular oxidation became thicker and deeper, as well as Cr and Nb depletions. After 3000 h of oxidation and from EPMA-WDS analyses (Figs. 4 and 12), and consistently with thermodynamic cal-culations inFig. 5, it can be concluded that the Nb began to oxidise. Rutile-type TiNbO4was identified by EBSD.
Regarding the intergranular oxidation mechanism, the EPMA-WDS profile (1) inFig. 12shows that Al and Ti concentrations dropped to zero inside the grain. This means that these elements diffused laterally toward the GB to contribute to the lateral growth of intergranular TiO2
and Al2O3.
In Fig. 12 profile (2), the Cr-depleted zone reached a depth of 65 ± 5 μm and the Al-depleted zone reached 38 ± 5 μm, which is much deeper than the average depth of intergranular oxidation (18 ± 10 μm deep). This result shows that, deep in the alloy bulk, Al atoms diffuse toward the closest GB and then diffuse upward in the GB to react with O at the tip of the deepest grain boundary oxides. As a consequence, the diffusion of Ti, Al and Nb, induced the dissolution of hardening precipitates such as γ’, γ” and δ phases. The Al-depleted zone reached a depth of 40 μm which could have an impact on the me-chanical properties of the alloy.
3.4.2. Confrontation of the GBO model with quantitative data
This overall mechanism can be confronted with the available dif-fusion data. Table 3presents the activation energies found in the lit-erature and the estimated value of the diffusion coefficients and diffu-sion depths of several elements in the volume or in the GBs. This table was used to identify the mechanism that could control intergranular oxidation kinetics.
InFig. 9, the activation energy of the intergranular oxidation of alloy 718 was evaluated at about 268 kJ mol−1. This value is close to
the activation energy of O diffusion through nickel alloy GBs [11,12], but also close to the activation energy of the diffusion of Ti in
FCC-NiTiAl (polycrystal) [54] or of Al in FCC-Ni (polycrystal) [55]. More-over, by comparing calculated diffusion depths (given by2 Dt), it is clear that the diffusion of O in a Ni-base fcc polycrystal lattice and the diffusion of Ti or Al in GBs, are much faster than the diffusion of Ti or Al in the volume.
In order for the intergranular oxide to grow, it is necessary that both O and Al (or Ti) reach the tip of the penetration at the grain boundaries. When O reaches the extremity of the oxide formed at the GB, it reacts with the Al to form a continuous intergranular oxide. If Al was not present in sufficient quantity at the tip of the oxide formed at the GB, then this oxide would not be continuous. This result means that the Al flux towards the extremity of the GBO penetration is at least as large as the inward O flux. The Al flux towards the tip of the GBO penetration depends on its diffusion in the GB free of oxide, below the intergranular oxide, but also on its diffusion in the bulk of the alloy to reach the grain boundaries.
By applying Wagner’s theory of internal oxidation [38], the oxida-tion kinetics of a binary alloy (AB) is controlled by both inward O diffusion and outward diffusion of B, in our case Al. The internal oxi-dation kinetics can be described by Eq.(3)below:
⎜ ⎟ = ⎛ ⎝ ⎞ ⎠ k π D D N νN 2 pIO B O Os BO ( ) ( ) ( ) 2 (3) = × k z t 1 pIO ( ) 2 (4) Withkp(IO)the internal oxidation parabolic rate constant (cm² s−1), DB
and DO(cm² s−1), respectively the diffusion coefficient of Al and O in
the alloy that were found in the literature and reported inTable 3. In our case, NBcorresponds to the concentration of Al in alloy 718 (NAl=
1 at. %). NOcorresponds to the solubility limit of O in the alloy without
B. z (cm) corresponds to the depth of the zone affected by internal oxidation. The stoichiometric coefficient ν is determined with the fol-lowing reaction:
+ =
B νO BOν (5)
The solubility limit of O within the alloy was determined using the Thermocalc software with the TCNi9 Ni-database. Thermodynamic calculations were conducted with the chemical composition of alloy 718 measured by EDX below the external oxide scale (52.7Ni, 19.8Fe, 9.5Cr, 5.7Nb, 3.7Mo, 0.1Co, 0.05 Mn, in wt. %) without Al and Ti which were oxidised. The O partial pressure found at the chromia oxide scale/ metal interface at 850 °C wasPO2= 7.4 × 10⁻²⁶ atm and the
corre-sponding O concentration in the alloy in equilibrium with the oxide scale was calculated:NO= 6.2 × 10⁻⁵at.ppm.
The penetration depth z of the internal oxidation was estimated from Wagner’s formula Eqs.(3)and(4). Several combinations of O and Al diffusion coefficients in nickel or nickel alloys (Table 3) were tested. Results inTable 4show that if we consider that O diffuses in the volume (DO,vol) and that Al (DAl) diffuses either in the volume or in the grain,
the value of the internal oxidation depth (z) for a 3000-h oxidation at 850 °C is much too small compared to our observations. On the con-trary, if we consider that O diffuses at the intergranular oxide/metal interface (DO,interf) and that Al diffuses either in the metal volume or in
the alloy grain boundaries free of oxide, it is possible to find a realistic value for DO,interf. This results in an intergranular oxidation penetration
depth of 23 μm, which is close to the experimental results. To reach a depth of 23 μm, if we consider that Al diffusion at the alloy GBs (DAl,GB)
controls the kinetics, the O diffusion value must be set to DO,interf=
8 × 10⁷
DO,vol. If we now consider that kinetics are controlled by Al
diffusion in the volume of the alloy grains (DAl,Vol), the value must be
set to DO,interf= 2.2 × 10⁵DO,vol. This latter value is consistent with the
diffusion coefficient of O at the intergranular oxide/metal interface found in the literature. Indeed, Stott et al. [14] estimated that O dif-fusion at Al2O3internal oxide/nickel matrix incoherent interfaces was
1.2 × 10⁴times faster than O diffusion in the bulk at 1100 °C, and
Fig. 14. Schematic diagram explaining the intergranular oxidation mechanism of AM alloy 718 at 850 °C for different oxidation durations (48 h, 1000 h, 3000 h).
2 × 10⁴times faster at 1050 °C.
In conclusion, the intergranular oxidation kinetics could be con-trolled by both the supply of O at the tip of the oxide formed at the GB through the intergranular oxide/metal interfaces and the supply of Al. Al must diffuse through the volume of the alloy grains before diffusing in the alloy grain boundaries up to the tip of the oxides formed at the GB. Because these two diffusion paths act in series, the slowest step, i.e. the diffusion of Al in the volume, controls the kinetics of the supply of Al.
4. Conclusions
The isothermal oxidation at 850 °C, in air, of as-built LBM and EBM samples of alloy 718 was compared to the oxidation of a wrought heat-treated (AMS5662) alloy 718.
•
Oxidation kinetics in terms of mass gain or in terms of GB oxide penetration kinetics are close for AM samples and wrought alloy•
The mass gain of LBM samples was found to be 20 % higher than that of EBM and wrought samples. This was mainly attributed to a slightly thicker chromia scale, and a slightly higher quantity of in-tergranular oxidation. After a 3000-h oxidation test, the parabolic rate constants ranged from 0.4 × 10⁻⁷to 1.8 × 10⁻⁷mg² cm−4s−1which agrees well with the literature.
•
After a long oxidation exposure (3000 h), the Nb present beneath the oxide scale/metal interface, oxidised. This oxide was identified as TiNbO4(rutile-type oxide). Calphad calculations with TCNi9Ni-database are in agreement with the fact that TiO2and NbO2can
coexist in equilibrium with Cr2O3.
•
The morphology of the oxides formed at the grain boundaries in AM samples was found different than in wrought samples. GB oxides of AM samples were found less homogenous, thicker and with deeper penetrations than those found in the wrought samples which were found thinner and more homogenous.•
Intergranular oxidation kinetics of AM samples were slightly higher. However, the quantity of intergranular oxidation was not sig-nificantly different. The comparison of intergranular oxidation ki-netics with those found in the literature showed that additivelymanufactured samples in their as-built form have a competitive intergranular oxidation resistance when compared to a wrought or cast alloy 718.
•
AM samples, which presented larger grain sizes, also presented thicker oxides at grain boundaries. This observation was explained by the full depletion of Al in the grains. Nevertheless, the quanti-tative correlation between grain size and GBO thickness was weak.•
The impact of crystallographic texture and misorientation of the two grains from either side of the GB, on the quantity of intergranular oxidation was not significant.•
The main difference between AM and wrought samples lies in the nature of their grain boundaries. Indeed, in the wrought sample, 30 % of grain boundaries analysed were special grain boundaries, against 3% and 9% in LBM and EBM samples respectively. These boundaries are known to have a better resistance to intergranular oxidation, which was confirmed in the present work.•
A general mechanism for 718 alloy intergranular oxidation was proposed. The WDS analysis of Al depletion and the GBO kinetics analysis showed that intergranular oxidation growth follows Wagner’s internal oxidation theory, in which case GBO kinetics is controlled by both the diffusion of O in the GB oxide/metal interface and the diffusion of Al in the metal volume. For special GBs, the slower diffusion of Al and Ti in GBs participate in the control of GBO kinetics.•
A finer scale analysis of the chemical composition of grain bound-aries should be carried out in order to identify the elements affecting intergranular oxidation resistance and to determine whether AM modifies intergranular chemistry.CRediT authorship contribution statement
Tom Sanviemvongsak: Methodology, Investigation, Writing - ori-ginal draft, Visualization. Daniel Monceau: Supervision, Validation, Writing - review & editing. Clara Desgranges: Formal analysis, Writing - review & editing. Bruno Macquaire: Resources, Funding acquisition, Writing - review & editing.
Declaration of Competing Interest
The authors declare that they have no known competing financial interests or personal relationships that could have appeared to influ-ence the work reported in this paper.
Acknowledgments
The authors would like to thank Arnaud Proietti and Sophie Gouy, both from the Raimond Castaing Microanalysis Centre. We would like to thank them for their analysis and constructive discussions respec-tively for the EBSD results and EPMA-WDS results. This research was Table 3
Diffusion data on Ni-base fcc alloys from the literature: pre-exponential factors, activation energies. Diffusion coefficients and diffusion depths were determined at 850 °C after 3000 h.
Elements Temperature (°C) Pre-exponential factor D0
(cm²/s)
Activation energy Qa
(kJ/mol) Diffusion coef. at 850 °C D(cm²/s) Diffusion depth 850 °C-3000 h2 Dt(μm)
Ref. O in Ni (Polycrystal) 850−1400 4.90 × 10⁻² 164 1.14 × 10⁻⁹ 2222 [10] O in Ni (Polycrystal) 1000−1150 3.63 × 10+4 277 4.67 × 10⁻⁹ 4490 [56] Cr in Ni-20.4Cr (Polycrystal) 950−1360 2.10 × 10⁻¹ 249 5.48 × 10⁻¹³ 49 [57] Nb in Ni (Polycrystal) 927−1227 1.04 × 10⁻² 203 3.88 × 10⁻¹² 129 [58] Ti in Ni-76 % TiAl (Polycrystal) 900−1200 2.40 267 9.01 × 10⁻¹³ 62.4 [54] Al in Ni (Polycrystal) 996−646 4.40 × 10⁻¹ 245 1.74 × 10⁻¹² 87 [55] Al in Ni (GB) 200−287 7.10 × 10⁻² 120 1.85 × 10⁻⁷ 28,256 [59] Ni in Ni (Polycrystal) 927−1227 1.27 281 1.07 × 10⁻¹³ 22 [58] Ni in Ni (GB) 700−1250 5.40 × 10⁻² 123 1.02 × 10⁻⁷ 20,984 [60] Table 4
Calculated interganular oxidation kinetics for different diffusion paths of O and Al.kp(IO)and z were determined for a 3000-h oxidation at 850 °C using Wagner's
theory on internal oxidation and Thermocalc (TCNi9) values
= × −
PO2850,718 7.4 1026atmandN =6.2×10−at ppm. O850,TC,718 5 .
Diffusion paths for O and Al:
Al (Poly.) and O (Poly.) Al (GB) and O (Poly.) Al (Poly.) and O (GB) Al (GB) and O (GB) kp(IO)(cm² s−1) 1.0 × 10⁻²³ 9.4 × 10⁻²⁹ 4.9 × 10⁻¹³ 4.6 × 10⁻¹⁸ z (μm) 1.0 × 10⁻⁴ 3.2 × 10⁻⁷ 23 7.0 × 10−02
supported by Safran Group under the direction of Safran Additive Manufacturing (SAM) team.
References
[1] K.A. Al-hatab, M.A. Al-bukhaiti, U. Krupp, M. Kantehm, Cyclic oxidation behavior of IN 718 superalloy in air at high temperatures, Oxid. Met. 75 (2011) 209–228. [2] Q. Jia, D. Gu, Selective laser melting additive manufactured Inconel 718 superalloy
parts: high-temperature oxidation property and its mechanisms, Opt. Laser Technol. 62 (2014) 161–171.
[3] T. Sanviemvongsak, D. Monceau, B. Macquaire, High temperature oxidation of IN 718 manufactured by laser beam melting and electron beam melting: effect of surface topography, Corros. Sci. 141 (2018) 127–145.
[4] E. Andrieu, R. Molins, H. Ghonem, A. Pineau, Intergranular crack tip oxidation mechanism in a nickel-based superalloy, Mater. Sci. Eng. A 154 (1992) 21–28. [5] R. Molins, G. Hochstetter, J.-C. Chassaigne, E. Andrieu, Oxidation effects on the
fatigue crack growth behaviour of alloy 718 at high temperature, Acta Mater. 45 (1997) 663–674.
[6] H.E. Evans, H.Y. Li, P. Bowen, A mechanism for stress-aided grain boundary oxi-dation ahead of cracks, Scr. Mater. 69 (2013) 179–182.
[7] V. Garat, O. Brucelle, J.M. Cloue, V. Rebeyrolle, D. Monceau, B. Viguier, E. Andrieu, Comparing different methods to determine the intergranular oxidation damage on a nickel based superalloy, High Temperature Corrosion and Protection of Materials 6, Prt 1 and 2, Proceedings (2004) 537–544.
[8] E.-G. Wagenhuber, V.B. Trindade, U. Krupp, The Role of Oxygen-grain-Boundary Diffusion During Intercrystalline Oxidation and Intergranular Fatigue Crack Propagation in Alloy 718 Superalloys 718, 625 and Various Derivties, (2005). [9] U. Krupp, P.E.G. Wagenhuber, Y.M. Virkar, H.J. Christ, Studying the role of the
alloy-grain-boundary character during oxidation of Ni-base alloys by means of the electron back-scattered diffraction technique AU - Trindade, V.B, Mater. High Temp. 22 (2005) 207–212.
[10] J.-W. Park, C.J. Altstetter, The diffusion and solubility of oxygen in solid nickel, Metall. Trans. A 18 (1987) 43–50.
[11] W. Chang, Superalloys-Processing, Proc. 2nd Intl. Conf. on Superalloys, Sec. V, in, MCIC-72-10, 1972.
[12] R.G. Iacocca, D.A. Woodford, The kinetics of intergranular oxygen penetration in nickel and its relevance to weldment cracking, Metall. Trans. A 19 (1988) 2305–2313.
[13] L.A. Ronqueti, J. Favergeon, M. Risbet, M. Picard, Study of grain boundary oxida-tion of high alloyed carbon steels at coiling temperature, 53nd Rolling Seminar (2016) 283–292.
[14] F.H. Stott, G.C. Wood, Internal oxidation, Mater. Sci. Technol. 4 (1988) 1072–1078. [15] Y. Shida, G.C. Wood, F.H. Stott, D.P. Whittle, B.D. Bastow, Intergranular oxidation and internal void formation in Ni-40% Cr alloys, Corros. Sci. 21 (1981) 581–597. [16] G.C. Wood, F.H. Stott, D.P. Whittle, Y. Shida, B.D. Bastow, The high temperature internal oxidation and intergranular oxidation of nickel-chromium alloys, Corros. Sci. 23 (1983) 9–25.
[17] Y. Shida, F.H. Stott, B.D. Bastow, D.P. Whittle, G.C. Wood, Development of pre-ferential intergranular oxides in nickel-aluminum alloys at high temperatures, Oxid. Met. 18 (1982) 93–113.
[18] M.W. Brumm, H.J. Grabke, B. Wagemann, Oxidation of NiAl - III. Internal and in-tergranular oxidation, Corros. Sci. 36 (1994) 37–53.
[19] C.S. Giggins, F.S. Pettit, Oxidation of Ni-Cr-Al alloys between 1000° and 1200°C, J. Electrochem. Soc. 118 (1971) 1782–1790.
[20] F.H. Stott, G.C. Wood, Y. Shida, D.P. Whittle, B.D. Bastow, The development of internal and intergranular oxides in nickel-chromium-aluminium alloys at high temperature, Corros. Sci. 21 (1981) 599–624.
[21] D. Oquab, N. Xu, D. Monceau, D.J. Young, Subsurface microstructural changes in a cast heat resisting alloy caused by high temperature corrosion, Corros. Sci. 52 (2010) 255–262.
[22] C. Desgranges, F. Lequien, E. Aublant, M. Nastar, D. Monceau, Depletion and voids formation in the substrate during high temperature oxidation of Ni-Cr alloys, Oxid. Met. 79 (2013) 93–105.
[23] T. Watanabe, An approach to grain-boundary design for strong and ductile poly-crystals, Res Mechanica 11 (1984) 47–84.
[24] H. Tézenas Du Montcel, L. Nazé, V. Maurel, N. Souaï, R.E. Logé, J.Y. Guedou, Ingénierie des joints de grain dans les alliages à base de nickel, XIXème Congrès Français de Mécanique, (2009) Marseille, France, pp. 6.
[25] V. Trindade, H.-J. Christ, U. Krupp, Grain-size effects on the high-temperature oxidation behaviour of chromium steels, Oxid. Met. 73 (2011) 551–563. [26] J.G. Goedjen, D.A. Shores, The effect of alloy grain size on the transient oxidation
behavior of an alumina-forming alloy, Oxid. Met. 37 (1992) 125–142.
[27] L. Li, X. Gong, X. Ye, J. Teng, Y. Nie, Y. Li, Q. Lei, Influence of Building Direction on the Oxidation Behavior of Inconel 718 Alloy Fabricated by Additive Manufacture of Electron Beam Melting, (2018).
[28] P. Lin, G. Palumbo, U. Erb, K.T. Aust, Influence of grain boundary character dis-tribution on sensitization and intergranular corrosion of alloy 600, Scr. Metall. Mater. 33 (1995) 1387–1392.
[29] S. Yamaura, Y. Igarashi, S. Tsurekawa, T. Watanabe, Structure dependant inter-granular oxidation in Ni-Fe polycristalline alloy, Acta Mater. 47 (1999) 1175–1180. [30] S.-i. Yamaura, S. Tsurekawa, T. Watanabe, The control of oxidation-induced
intergranular embrittlement by grain boundary engineering in rapidly solidified Ni-Fe alloy ribbons, Mater. Trans. 44 (2003) 1494–1502.
[31]B. Pieraggi, Calculations of parabolic rate constants, Oxid. Met. 27 (1987) 177–185. [32]A. Chyrkin, P. Huczkowski, V. Shemet, L. Singheiser, W.J. Quadakkers, Sub-scale
depletion and enrichment processes during high temperature oxidation of the nickel base alloy 625 in the temperature range 900–1000 degrees C, Oxid. Met. 75 (2011) 143–166.
[33]V.S. Babu, A. Pavlovic, M.S. Seehra, Oxidation characteristics and thermal expan-sion of inconel alloy 718 from 300 K to 1273 K, Superalloys 718 (625) (1997) 689–693 706 and various derivatives.
[34]A. Bennouna, Etude de l’oxydation du superalliage refractaire inconel
718(NC19FeNb), Role Des Précipités De Carbure De Niobium Et De La Phase Delta (Ni3Nb), Institut National Polytechnique de Toulouse, 1986 PhD Thesis. [35]R. Rolland, Study of the Influence of the Steam Water on High Temperature
Oxidation of Chromia Forming Nickel Based Superalloy, PhD thesis University of Blaise Pascal, Clermont-Ferrand II, 2012.
[36]L.X. Zhou, T.N. Baker, Effects on dynamic and metadynamic recrystallization on microstructures of wrought IN-718 due to hot deformation, Mater. Sci. Eng. A 196 (1995) 89–95.
[37]B. Pieraggi, R.A. Rapp, J.P. Hirth, Role of interface structure and interfacial defects in oxide scale growth, Oxid. Met. 44 (1995) 63–79.
[38]D.J. Young, High Temperature Oxidation and Corrosion of Metals, Elsevier, Amsterdam, 2008.
[39]F.I. Wei, F.H. Stott, The influence of aluminium on the oxidation of a Cr2O3-forming nickel-chromium alloy, React. Solids 6 (1988) 129–144.
[40]F. Delaunay, C. Berthier, M. Lenglet, J.-M. Lameille, SEM-EDS and XPS studies of the high temperature oxidation behaviour of inconel 718, Microchim. Ichnoanal. Acta 132 (2000) 337–343.
[41]V.B. Trindade, U. Krupp, P.E.G. Wagenhuber, H.J. Christ, Oxidation mechanisms of Cr-containing steels and Ni-base alloys at high-temperatures - Part I: the different role of alloy grain boundaries, Mater. Corros. Und Korrosion 56 (2005) 785–790. [42]S. Cruchley, H.E. Evans, M.P. Taylor, M.C. Hardy, S. Stekovic, Chromia layer
growth on a Ni-based superalloy: sub-parabolic kinetics and the role of titanium, Corros. Sci. 75 (2013) 58–66.
[43]C. Duhamel, J. Caballero, T. Couvant, J. Crépin, F. Gaslain, C. Guerre, H.-T. Le, M. Wehbi, Intergranular oxidation of nickel-base alloys: potentialities of focused ion beam tomography, Oxid. Met. 88 (2017) 447–457.
[44]C. Juillet, A. Oudriss, J. Balmain, X. Feaugas, F. Pedraza, Characterization and oxidation resistance of additive manufactured and forged IN718 Ni-based super-alloys, Corros. Sci. (2018).
[45]M. Calandri, D. Manfredi, F. Calignano, E.P. Ambrosio, S. Biamino, R. Lupoi, D. Ugues, Solution treatment study of inconel 718 produced by SLM additive technique in view of the oxidation resistance, Adv. Eng. Mater. 0 (2018). [46]A. Prillieux, E. Andrieu, Personal reasearch, ENSIACET student project,
"Intergranular Oxidaiton of Alloy 718 at 1050 °C", (2018).
[47]A. Strondl, M. Palm, J. Gnauk, G. Frommeyer, Microstructure and mechanical properties of nickel based superalloy IN718 produced by rapid prototyping with electron beam melting (EBM), Mater. Sci. Technol. 27 (2011) 876–883. [48]Y. Idell, L.E. Levine, A.J. Allen, F. Zhang, C.E. Campbell, G.B. Olson, J. Gong,
D.R. Snyder, H.Z. Deutchman, Unexpected d-Phase formation in additive-manu-factured Ni-Based superalloy, the minerals, Metals Mater. Soc. 68 (2016) 950–959. [49]X. Wang, F. Fan, J.A. Szpunar, L. Zhang, Influence of grain orientation on the
in-cipient oxidation behavior of Haynes 230 at 900°C, Mater. Charact. 107 (2015) 33–42.
[50]A.P. Sutton, Grain-boundary structure, Int. Met. Rev. 29 (1984) 377–404. [51]S. Kobayashi, R. Kobayashi, T. Watanabe, Control of grain boundary connectivity
based on fractal analysis for improvement of intergranular corrosion resistance in SUS316L austenitic stainless steel, Acta Mater. 102 (2016) 397–405.
[52]U. Krupp, P.E.G. Wagenhuber, W.M. Kane, C.J. McMahon, Improving resistance to dynamic embrittlement and intergranular oxidation of nickel based superalloys by grain boundary engineering type processing, Mater. Sci. Technol. 21 (2005) 1247–1254.
[53]W.R. Sun, S.R. Guo, J.H. Lee, N.K. Park, Y.S. Yoo, S.J. Choe, Z.Q. Hu, Effects of phosphorus on the δ-Ni3Nb phase precipitation and the stress rupture properties in alloy 718, Mater. Sci. Eng. A 247 (1998) 173–179.
[54]M.S.A. Karunaratne, P. Carter, R.C. Reed, On the diffusion of aluminium and tita-nium in the Ni-RICH Ni-Al-Ti system between 900 and 1200°C, Acta Mater. 49 (2001) 861–875.
[55]M. Hasaka, T. Morimura, Y. Uchiyama, S.-i. Kondo, T. Watanabe, K. Hisatsune, T. Furuse, Diffusion of copper, aluminum and boron in nickel, Scr. Metall. Mater. 29 (1993) 959–962.
[56]A. Prillieux, Hydrogen and water vapour effects on oxygen solubility and diffusivity in high temperature Fe-Ni alloys, Phd Thesis, School of Materials Science and Engineering, University of New South Wales Sydney, 2017.
[57]J. Askill, Tracer diffusion in the chromium–nickel system, Phys. Status Solidi 8 (1971) 587–596.
[58]R.V. Patil, G.B. Kale, Chemical diffusion of niobium in nickel, J. Nucl. Mater. 230 (1996) 57–60.
[59]R. Grieseler, I.S. Au, T. Kups, P. Schaaf, Diffusion in thin bilayer films during rapid thermal annealing, Phys. Status Solidi 211 (2014) 2635–2644.
[60]S.V. Divinski, G. Reglitz, G. Wilde, Grain boundary self-diffusion in polycrystalline nickel of different purity levels, Acta Mater. 58 (2010) 386–395.