HAL Id: hal-02927919
https://hal.univ-grenoble-alpes.fr/hal-02927919
Submitted on 2 Sep 2020
HAL is a multi-disciplinary open access
archive for the deposit and dissemination of
sci-entific research documents, whether they are
pub-lished or not. The documents may come from
teaching and research institutions in France or
abroad, or from public or private research centers.
L’archive ouverte pluridisciplinaire HAL, est
destinée au dépôt et à la diffusion de documents
scientifiques de niveau recherche, publiés ou non,
émanant des établissements d’enseignement et de
recherche français ou étrangers, des laboratoires
publics ou privés.
Erebus Volcano, Antarctica
Thibaud Blondel, Julien Chaput, Arnaud Derode, Michel Campillo, Alexandre
Aubry
To cite this version:
Thibaud Blondel, Julien Chaput, Arnaud Derode, Michel Campillo, Alexandre Aubry.
Matrix
Approach of Seismic Imaging: Application to the Erebus Volcano, Antarctica. Journal of
Geo-physical Research : Solid Earth, American GeoGeo-physical Union, 2018, 123 (12), pp.10,936-10,950.
�10.1029/2018jb016361�. �hal-02927919�
Matrix Approach of Seismic Imaging: Application
to the Erebus Volcano, Antarctica
Thibaud Blondel1, Julien Chaput2, Arnaud Derode1, Michel Campillo3, and Alexandre Aubry1 1ESPCI Paris, PSL Research University, CNRS, Univ Paris Diderot, Sorbonne Paris Cité,Institut Langevin, UMR 7587, Paris,
France,2Department of Geological Sciences, University of Texas El Paso, El Paso, TX, USA,3ISTerre, Université Joseph
Fourier, Maison des Géosciences, Grenoble, France
Abstract
Multiple scattering of seismic waves is often seen as a nightmare for conventional migration techniques that generally rely on a ballistic or a single-scattering assumption. In heterogeneous areas such as volcanoes, the multiple-scattering contribution limits the imaging-depth to one scattering mean free path, the mean distance between two successive scattering events for body waves. In this Letter, we propose a matrix approach of passive seismic imaging that pushes back this fundamental limit by making an efficient use of scattered body waves drowned into a noisy seismic coda. As a proof of concept, the case of the Erebus volcano in Antarctica is considered. The Green’s functions between a set of geophones placed on top of the volcano are first retrieved by the cross correlation of coda waves induced by multiple icequakes. This set of impulse responses forms a reflection matrix. By combining a matrix discrimination of singly scattered waves with iterative time reversal, we are able to push back the multiple scattering limit beyond 10 scattering mean free paths. The matrix approach reveals the internal structure of the Erebus volcano: A chimney-shaped structure at shallow depths, a magma reservoir at 2,500 m and several cavities at sea level and below it. The matrix approach paves the way toward a greatly improved monitoring of volcanic structures at depth. Beyond this specific case, the matrix approach of seismic imaging can generally be applied to all scales and areas where multiple scattering events undergone by body waves prevent in-depth imaging of the Earth’s crust.1. Introduction
Conventional seismic modeling, imaging, and inversion methods generally apply to direct waves in seismic records (Yilmaz, 2008). However, in heterogeneous areas, the coherent components of the wave-field may vanish and the seismic record entails a long coda due to scattering undergone by seismic waves in the Earth’s crust. Albeit difficult to interpret via conventional approaches, the information contained in the coda is par-ticularly rich. The challenge is to extract relevant information from such a seemingly incoherent signal. Cross correlation of coda waves or seismic noise received at two stations was shown to be an important break-through in geophysics (Campillo & Paul, 2003; Larose, Margerin, et al., 2006). Under appropriate wavefield conditions, coda cross correlation converges toward the Green’s function between receiving stations (Derode et al., 2003; Snieder, 2004; Wapenaar, 2004; Weaver & Lobkis, 2001), as if one of them had been used as a source, thus paving the way to passive imaging.
In that process, multiple scattering of waves helps approaching energy equipartition (Hennino et al., 2001; Margerin et al., 2000), which is necessary to fully retrieve the exact Green’s function. This seems paradoxi-cal because multiple scattering is detrimental to imaging: it becomes more and more difficult to distinguish anything at depths larger than the scattering mean-free path 𝓁s, the mean distance between two successive
scattering events. Beyond that depth, the wave actually loses its coherence and the memory of its initial direc-tion. In reality, multiple scattering does help to retrieve the main features of the Green’s function passively, but subsequent imaging techniques ultimately apply to the ballistic (i.e., unscattered) or singly scattered compo-nent of the estimated Green’s functions. Although a multiply scattered wavefield is a prerequisite to passively recovering Green’s functions through cross correlations, ultimately passive imaging suffers from the same limitations as classical active imaging: it fails if multiple scattering is too strong.
Yet new perspectives to overcome this problem were opened by the advent of multielement arrays with con-trollable emitters and/or receivers, both in ultrasound imaging (Aubry & Derode, 2009a, 2009b; Shahjahan
RESEARCH ARTICLE
10.1029/2018JB016361Key Points:
• Matrix approach of passive seismic bulk wave imaging is proposed to overcome the fundamental multiple-scattering limit • Cross correlations of coda waves
induced by multiple icequakes on Erebus form a reflection matrix of impulse responses between geophones
• Matrix discrimination of singly scattered bulk waves combined with iterative time reversal reveal the internal structure of Erebus
Supporting Information: • Supporting Information S1 Correspondence to: A. Aubry, alexandre.aubry@espci.fr Citation:
Blondel, T., Chaput, J., Derode, A., Campillo, M., & Aubry, A. (2018). Matrix approach of seismic imaging: Application to the Erebus volcano, Antarctica. Journal of Geophysical Research: Solid Earth, 123.
https://doi.org/10.1029/2018JB016361
Received 10 JUL 2018 Accepted 23 NOV 2018
Accepted article online 28 NOV 2018
©2018. American Geophysical Union. All Rights Reserved.
et al., 2014) and in optical microscopy (Badon et al., 2016a, 2016b). In a linear and time-invariant system with an array of M-independent emitters/receivers, the propagation of waves can be described by a matrix approach. All relevant information is contained in the M× M reflection matrix composed of the set of interelement impulse responses. In this context, recent academic studies proposed a solution based on random matrix properties to overcome multiple scattering by separating the single- and multiple-scattering contributions in the reflection matrix. From a physical point of view, it was done by taking advantage of the memory effect in the far field (Shahjahan et al., 2014) or, equivalently, by a confocal discrimination between single and multiple scattering in the focal plane (Badon et al., 2016a).
Inspired by these previous works, this paper aims to develop a similar matrix approach for seismic wave imag-ing in strongly scatterimag-ing environments. Arrays of geophones are commonly used to probe the subsoil; hence, matrix formalism can be particularly appropriate, as is the case for ultrasound and optical imaging. As a proof of concept for seismic imaging, we here consider the case of the Erebus volcano in Antarctica. Volcanoes are among the most challenging media for seismic imaging given their highly localized and abrupt variations in physical parameters, extreme landforms, extensive fractures, and the additional presence of magma and other fluids. In that respect, the case of the Erebus volcano is extreme since the scattering mean free path 𝓁s
for body waves is smaller than their wavelength 𝜆 in the 1- to 4-Hz bandwidth (Chaput et al., 2015). Imaging the volcano at large depths with conventional techniques fails, since multiple scattering increasingly domi-nates as depth becomes significantly larger than 𝓁s. Strikingly, we will show that our matrix approach allows
us to push back the multiple scattering limit to a depth of 9,000 m, or roughly 12𝓁sat a frequency f = 2.6 Hz,
for which 𝓁s∼ 750 m (Chaput et al., 2015).
To do so, we take advantage of a high-density network of 76 seismographs that was deployed on the upper plateau of the volcano as part of the TOMO-Erebus project (2007–2009). The coda generated by shallow icequakes (Knox, 2012) is used to retrieve the vertical component of the Green’s functions between the geo-phones. The associated reflection matrix is then investigated for imaging purposes. As a whole, the process we present in this paper can be analyzed as a combination of five building blocks (see Figure S1 in the supporting information):
• (B1) Any reflection matrix can be written as a sum of three contributions: ballistic, single scattering, and multiple scattering.
• (B2) Based on a rough estimate of velocity c, the Green’s functions between the M actual geophones can be transformed in order to mimic a set of N virtual geophones, located in a plane at an arbitrary depth z below the surface. To that end, focusing is performed both at emission and reception by means of simple matrix operations. It yields a new reflection matrix, each element of which is the total response (i.e., ballistic, single, and multiple scattering) between two virtual geophones (Badon et al., 2016a; Robert & Fink, 2008; Wapenaar et al., 2018).
• (B3) An input-output analysis, which will be referred to as confocal filtering, allows for the removal of most of the multiple scattering contribution in the new reflection matrix (Badon et al., 2016a).
• (B4) Iterative time reversal (Prada & Fink, 1994; Prada et al., 1996) is applied to overcome the residual multiple-scattering contribution as well as the aberration effects induced by the scattering medium itself and detect possible reflectors.
• (B5) A statistical analysis of the matrix singular values permit attribution of a likelihood index to each detected structure (Aubry & Derode, 2009b, 2010).
As a result of these five steps, an image of the internal structure of the Erebus volcano is obtained. While conventional imaging methods lead to a speckled image due to multiple scattering, the matrix approach developed here manages to detect internal structures in a reliable way and reveal a chimney-shaped struc-ture feeding the lava lake that bifurcates sharply toward the northwest and then seems to set centrally in a shallow magma chamber near 2,500-m elevation. Some particular features also emerge from the sea level to 5,000 m below it. A structural interpretation of the obtained image is finally built on the existing literature about Erebus.
2. Response Matrix of Geophones
In this study, we take advantage of interstation correlations of icequake coda recorded on a large temporary short-period deployment (referred to as the ETS network). Previous studies have identified several distinct mechanisms for short period discrete seismicity, namely, Strombolian gas slug decompression eruptions
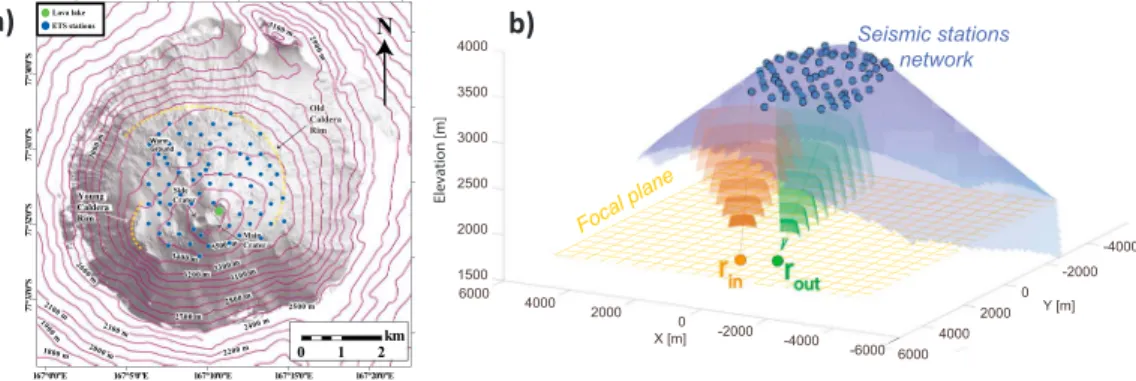
Figure 1. (a) Map of the Erebus volcano upper edifice with some principal geographic and geological features and showing the locations of the ETS Erebus stations. (b) Adaptive focusing at emission and reception on two pointsrinand
routof the focal plane (z= ct∕2) yields the Green’s function between virtual geophones placed at these two points. The
same operation is repeated for any couple of points in the focal plane and yields the focal reflection matrixR (equation (5)).
from a centralized convecting lava lake (Chaput et al., 2012; Knox et al., 2018), and a plethora of randomly distributed impulsive icequake events on Erebus volcano’s snow and ice cap (Knox, 2012). Though similar in both temporal and spectral character, eruptive events were systematically separated from icequake events in early studies (Chaput et al., 2012) using a joint seismic and infrasound matched filter. Icequake events were subsequently detected and roughly located using the Antelope database management package, using an STA/LTA trigger coupled with grid search waveform stacking for a simple velocity model. Spatial resolution of detected events, as noted in Knox (2012), is on the order of 10–100 m based on the number of recording sta-tions and the location of the icequake (inside or outside the network). The coda of both types of events were shown to satisfy theoretical precursors of equipartition (Chaput et al., 2015), notably, modal partition stabiliza-tion (Hennino et al., 2001), and coherent backscattering (Larose, Lobkis, & Weaver, 2006). Further studies using these icequake events also noted that exact source locations were unnecessary for Green’s function recon-struction, given that highly symmetric coda correlation functions could be obtained with a correct choice of coda windows, while using a severally azimuthally polarized subset of the icequakes (Chaput et al., 2015, 2016). These points together, along with numerically validated Bayesian optimization of coda windows as pro-posed by Chaput et al. (2016), form a set of corroborating arguments that point to an accurate convergence of icequake coda correlations to the true Green’s function between station pairs.
Figure 1a shows the location of the ETS instruments (Chaput et al., 2012; Zandomeneghi et al., 2010). The ∼5-km-diameter summit plateau, cone, and crater region of the Erebus volcano is a caldera-filling, highly heterogeneous, assemblage of bomb deposits, buried intrusions, geothermal features, gas-rich magma, per-mafrost, and lava flows. The volcano hosts an∼500-m-diameter main crater that hosts a long-lived phonolitic lava lake sustained by a significant near-summit magmatic system (Zandomeneghi et al., 2013). The 76 seis-mographs, spaced 300 to 500 m apart, were deployed over a roughly 4 by 4-km area surrounding the summit crater and lava lake. Each geophone is denoted by an index i and its position si. We make use here of 3,318 randomly located icequake events identified by Knox (2012) for a period of 1 month in 2008–2009 (Zandomeneghi et al., 2010). We performed interstation correlations of icequake coda using the vertical com-ponent of the recorded wavefields. The method used for the convergence of the coda cross correlation toward interstation Green’s functions has been detailed by Chaput et al. (2016) and relies on a Bayesian optimization scheme to select ideal combinations of coda windows at each icequake. The impulse response between sta-tions i and j is noted hij(𝜏), with 𝜏 the time lag. The set of impulse responses form a time-dependent response matrix H(𝜏). The Green’s functions are estimated over a time length of 15 s, with a 20-Hz sampling frequency. The central frequency f0is 2.6 Hz and the -3-dB frequency bandwidth is 1 Hz.
The impulse responses exhibit several direct arrivals that have already been investigated by Chaput et al. (2015) and Chaput et al. (2016). Rayleigh waves are well resolved, with an apparent velocity ranging between 1,000 and 1,300 m/s. Ballistic waves, likely direct interstation S wave and P wave, arrive before the Rayleigh wave at apparent velocities between 1,500 and 3,000 m/s. This range of body wave velocities is consistent with a previous seismic tomography study (Zandomeneghi et al., 2013) from which a mean P wave velocity of 2,200 m/s has been measured in the near-surface region of the edifice. In the following, we will use a homogeneous
wave velocity model with c= 2,200 m/s as the reference bulk wave velocity. This choice will be also validated a posteriori by a minimization of the aberration effects in the reflection matrix (see section 3).
In the present study, we are not interested in the ballistic component of the wavefield but rather in its scattered contribution due to reflections by the internal structure of the volcano. These vertical echoes are mainly asso-ciated with P waves since only the vertical component of the Green’s functions is considered in this study. The scattered wavefield consists of two parts: (i) a single-scattering contribution which can be taken advantage of for 3-D imaging, because there is a direct first-order relation between the arrival time 𝜏 of singly-scattered echoes and the distance d between sensors and scatterers, 𝜏 = 2d∕c; (ii) a multiple-scattering contribution for which the time-space relation does not hold, which is a hurdle for imaging. On the one hand, a time-resolved analysis of H is needed in order to enhance the single-scattering component compared to the multiple scat-tering contribution. On the other hand, a Fourier analysis of the impulse responses is required for a matrix description of wave propagation.
To fulfill these two constraints, a short-time Fourier analysis of the impulse response matrix H is achieved. The impulse responses hij(𝜏) are truncated into successive time windows of length Δt: kij(t, 𝜏) = hij(t + 𝜏)W(𝜏)
with W(𝜏) = 1 for 𝜏 ∈ [−Δt∕2, Δt∕2], W(𝜏) = 0 elsewhere t is the central time of each temporal window. The value ofΔt = 1 s is chosen so that signals associated with the same scattering event(s) within the medium arrive in the same time window (Aubry & Derode, 2010). For each value of time t, the coefficients kij(t, 𝜏) form a matrix K(t, 𝜏). A Fourier analysis is then achieved by means of a discrete Fourier transform and gives a set of impulse responses kij(t, f) at time t and frequency f. In the following, we will mainly consider the response matrix K(t, f0) at the central frequency f0= 2.6 Hz.
As previously discussed, any reflection matrix can be decomposed as the sum of a ballistic (B) contribu-tion, a single (S) scattering contribucontribu-tion, and a multiple (M) scattering contribution. In the case of K(t, f), this is written
K(t, f) = KB(t, f) + KS(t, f) + KM(t, f), (1)
or, in terms of matrix coefficients,
kij(t, f) = k(B)
ij (t, f) + k(S)ij (t, f) + k(M)ij (t, f). (2)
At any specific time t, KS(t, f) contains singly scattered echoes associated with reflectors contained in the isochronous volume, that is, the ensemble of points that contribute to the back-scattered signal at a given time. It is formed by the superposition of all ellipses whose foci are elements i and j, for(i, j) ∈ [1; M]. In a far-field configuration, the isochronous volume can be approximated to a slab of thicknessΔr = cΔt, centered at a distance z= ct∕2 from the array of geophones and parallel to it. The multiple scattering contribution KM(t, f)
corresponds to the sum of partial waves associated with multiple scattering paths that occur at shallower depths and whose length belongs to the interval[z − cΔt∕2; z + cΔt∕2].
Previous works in ultrasound imaging have investigated the input-output correlation properties of the reflec-tion matrix in order to discriminate single and multiple scattering (Aubry & Derode, 2009a, 2009b). While the latter contribution displays a random feature, the former contribution displays a deterministic coherence related to the memory effect (Shahjahan et al., 2014). The original multiple scattering filter in ultrasound imaging has been developed for a regular array of sensors under a paraxial approximation and neglecting wave-front distortions related to an inhomogeneous wave velocity background (Aubry & Derode, 2009a, 2009b). On the contrary, the geophones placed on top of Erebus have irregular positions relative to one another. Moreover, the paraxial approximation is everything but true at shallow depths and wave velocity tomography maps show strong variations at the top of Erebus volcano (Zandomeneghi et al., 2013). Hence, though we are dealing with seismic waves whose mechanical nature is similar to ultrasound, the discrimina-tion between single and multiple scattering must be performed in a different manner than what has been done in the context of ultrasonic detection. Instead, we adapt a recent extension of the matrix approach to optical imaging (Badon et al., 2016a). In the next section we explain how the reflection matrix is transformed by emission and reception focusing, before discriminating single and multiple scattering.
3. Focal Reflection Matrix
In order to emulate a set of virtual sources/receivers located below the surface at an arbitrary depth z, coherent beamforming can be achieved at emission and reception. If the geophones were active sensors, it would
consist in focusing the transmitted wave at the desired point by applying the appropriate time delay to each geophone. In the reception mode, the same delays would be applied to the received signals before being summed. Single-scattering signals coming from a scatterer located at the focus would add up coherently, whereas the summation would be expected to be incoherent for multiple-scattering signals arriving at the same time.
The matrix formalism allows to do all these operations in postprocessing. To that aim, we first have to map, at each time, the focal plane with a 2-D set of N2focusing points along the x and y directions (see Figure 1). The
spatial sampling period should be chosen smaller than the typical size 𝛿 of a resolution cell. 𝛿 is determined by the effective numerical aperture, sin 𝜃, of the geophone array at each depth z, such that
𝛿 ∼ 𝜆
2 sin 𝜃, with tan 𝜃 = D
2z (3)
where 𝜆 = c∕f0is the wavelength, assuming c is known. D is the typical size of the geophones’ network.
At shallow depth, 𝛿 is limited by diffraction: 𝛿 ∼ 𝜆∕2. The number N2of focusing points in the focal plane
is chosen such that the field-of-view N𝛿 (i.e., the transverse size of the focal plane) coincides with twice the geophones’ array size at shallow depth, hence we take N𝜆∕2 ∼ 2D. Here D = 4 km, so N is fixed to be 40. In the far-field (z > > D), the resolution cell 𝛿 scales as 𝜆z∕D and the field-of-view increases linearly with z. The second step consists in defining a Green’s matrix G that describes the ballistic propagation of seismic waves from the geophones’ network to the focal plane. As the scattered wave-field mainly contains P-waves, an homogeneous acoustic model is considered with a wave velocity equal to c. G gathers all the free-space causal Green’s functions G(si, rl) between each geophone at point siand each focal point rl:
G(si, rl) = e
−i2𝜋
𝜆‖rl−si‖ 4𝜋 ‖‖rl− si‖‖
(4) The final step consists in applying the double focusing operation to K to obtain the reflection matrix R in the focal plane. Based on the Kirchoff-Helmholtz integral, such a focusing operation is standard in exploration seismology and referred to as redatuming(Berkhout, 1984; Berryhill, 1984; Berkhout & Wapenaar, 1993). Under a matrix formalism, it can be written as follows,
R= 𝝏nG†× K × 𝝏nG∗ (5)
where the symbols† and ∗ stands for transpose conjugate and conjugate. The matrices 𝜕nG†and 𝜕nG∗contain
the normal derivatives of the anti-causal Green’s functions between the geophones and the focal points, i.e the wave-fronts that should be applied at emission and reception in order to project the reflection matrix in the focal plane (Figure 1). Each coefficient R(rin, rout) of R is the impulse response between a virtual source at
point rin = (xin, yin, z) and a virtual detector at rout = (xout, yout, z) at depth z = ct∕2 (Aubry & Derode, 2007;
Robert & Fink, 2008). The effective size of each virtual geophone is 𝛿 in the transverse direction and cΔt∕2 in the axial direction.
Figures 2a–2c display the focal reflection matrix at three different times of flight: t = 0.25, 5, and 12.5 s, respectively. Since the focal plane is bidimensional, R has a four-dimension structure: R(rin, rout) =
R(xin, yin, xout, yout). R is thus concatenated in 2-D as a set of block matrices to be represented graphically (see
Figure 3a). In such a representation, every submatrix of R corresponds to a specific couple(yin, yout), whereas
every element in the given submatrix corresponds to a specific couple(xin, xout) (Figure 3b). Each coefficient
R(rin, rout) corresponds to the complex amplitude of the echoes coming from the point routin the focal plane
when focusing at point rin(or conversely since R is a symmetric matrix due to spatial reciprocity). Therefore, a line of the reflection matrix yields the response of the medium all across the focal plane for a specific input focusing point. It may be reshaped in two dimensions to visualize the corresponding reflected wavefields in the focal plane (Figure 3b). Figures 2d–2f show the 2-D reshaped central line of the matrices R displayed in Figures 2a–2c, respectively, and in these examples, the input focusing point is at the center of the field of view. At small times of flight (t= 0.25 s) or equivalently at shallow depths (z ∼ 275 m), single scattering is predom-inant since the corresponding focal depth is shallower than 𝓁s. Not surprisingly, R is close to being a diagonal
Figure 2. (a–c) Reflection matricesRin the focal plane basis recorded at timet= 0.25, 5, and 12.5 s. (d–f) The central line of these reflection matrices is reshaped in 2-D and yields the focal spot for a central input focusing pointrin= 0. The black circle represents the ideal focal spot of radius𝛿that would be
obtained in absence of aberration. The white circle line accounts for the typical size𝓁cof the aberrated focal spot. (g–i) The diagonal of these reflection matrices
is reshaped in 2-D and yields the confocal image of each focal plane. Note that the field-of-view scales with the size of the resolution cell predicted by diffraction theory such that each focal plane contains a constant number of points. In each panel, the modulus of matrix coefficients is displayed in arbitrary units with a linear color scale.
echoes are collected nearby, which is a characteristic feature of singly-scattered echoes. Nevertheless, as illus-trated by Figure 2d, the characteristic size of the focal spot is larger than the resolution cell 𝛿 predicted by diffraction theory. The size of the focal spot is given by the coherence length 𝓁cof the reflected wavefield
back-propagated in the focal plane. At time t= 0.25 s, 𝓁cis twice the theoretical resolution cell 𝛿. The
inhomo-geneity of the bulk wave velocity implies wave-front distortions and an energy spreading over off-diagonal elements of R in Figure 2a. The blurring of the reflection matrix around the diagonal is a manifestation of the aberrations undergone by the incident and reflected wave-fronts during their travel from the geophone array to the focal plane. This property has been taken advantage of to validate a posteriori our initial choice for the mean wave velocity. The selected value, c= 2,200 m/s, is found to minimize the ratio 𝓁c∕𝜆. Such an
Figure 3. Structure of the focal reflection matrixR. (a) Every line or column corresponds to the reflected wavefield for an input or output focusing point,rinorrout, respectively. (b) The 2-D representation ofRcorresponds to a set of block
matrices that represents the reflection matrix between two lines of virtual geophones in the focal plane. (c) A line in the reflection matrix provides the backscattered wavefield backpropagated in the focal plane for an input focusing pointrin.
d) The diagonal ofRprovides the reflected wave-field for identical input and output focusing points. It yields a confocal image of the volcano at depthz= ct∕2.
optimization is important since it has an impact on both the transverse resolution and the stretching in depth of the synthesized image.
At larger depths (𝓁s < z < 10𝓁s), we are in an intermediate regime where single and multiple scattering
coexist. Figures 2b and 2e display an example of reflection matrix and its central focal spot in this intermediary regime (t= 5 s, z ∼ 5.5 km). An aberrated focal spot can hardly be observed in the vicinity of the input focusing point (Figure 2e). Aberration can be assessed by the ratio 𝓁c∕𝛿 ∼ 3, which is stronger than at shallow depths
(Figure 2d). Otherwise, beyond the central area (‖rin− rout‖ > 𝓁c), the reflected wavefield also shows much
higher side lobes that can be accounted for by multiple scattering events occurring at shallower depths. With regard to the reflection matrix (Figure 2b), the multiple-scattering contribution manifests itself as a spreading of the back-scattered energy over its off-diagonal elements.
At last, beyond a depth of 10𝓁s, we are in a fully developed multiple scattering regime. Figures 2c and 2f show
a reflexion matrix and its 2-D reshaped central line in this regime (t= 12.5 s, z ∼ 13.75 km). Unlike previous cases, the backscattered wavefield displays a random feature with hardly any relationship to the original input location (Figure 2f). At large travel times, backscattered waves have actually undergone numerous scatter-ing events and followed complex trajectories. Not surprisscatter-ingly, multiple scatterscatter-ing yield a seemscatter-ingly random reflection matrix (Figure 2c).
The results displayed in Figure 2 have shown how the reflection matrix gives a quantitative information about the aberration level and the single-to-multiple scattering ratio. In the next sections, we will show how the internal structure of the volcano can be imaged from the reflection matrix.
4. In-Depth Imaging of Erebus Volcano
4.1. Confocal ImagingA direct way to build a map of reflectivity for each focal plane, hence a 3-D image, is to consider the diagonal of the reflection matrix R. Each diagonal element R(rin, rin) corresponds to the recorded echo amplitude when
focused beamforming is performed both at emission and reception on the same point rin. Repeating this
operation for each point within the field of view gives an image, each pixel of which codes the reflectivity of a specific point rin. Confocal imaging is actually the underlying principle of ultrasound imaging. It is based on
Figures 2g–2i display the 2-D confocal images built from the diagonal of the reflection matrices displayed in Figures 2a–2c at time t = 0.5, 5, and 10 s. At shallow depth (Figure 2g), one could have expected the confocal image to provide a satisfying image of the Erebus volcano. However, the short propagation distance and the aberration level (Figure 2d) preclude a clear distinction of inner structures of the volcano beyond roughly 1-km depth. Note that Chaput et al. (2012) already obtained a scattering image of Erebus in this depth range by means of a confocal imaging process. However, this work benefited from additional arrival incidence information provided by the full Green’s tensor, itself estimated by correlations of Strombolian eruption coda. At larger depths (Figures 2h–2i), multiple scattering predominates over single scattering. A random speckle image is obtained with, probably, no connection with the reflectivity of the volcano at the corresponding focal depth. This is confirmed by Figure 6a that displays the 3-D confocal image of Erebus.
Confocal imaging here fails not only because of multiple scattering but also owing to aberrations. A strict confocal discrimination of single-scattering events is actually too restrictive. Aberrations induced by the wave velocity inhomogeneities degrade the singly scattered focal spots that spread over the off-diagonal elements of the reflection matrix. In the next section, we show how to discriminate more precisely the single- and multiple-scattering contributions for imaging purposes.
4.2. Confocal Filter
Recently, a new route has been proposed to extract singly scattered echoes from a predominant multiple-scattering background in presence of aberrations (Badon et al., 2016a). It consists in applying con-secutively to the reflection matrix R: (i) an adaptive confocal filter that we describe below; (ii) an iterative time reversal process that we will describe in section 4.3. The adaptive confocal filter consists in weighting the coefficients R(rin, rout) of the focal reflection matrix as a function of the distance ||rout− rin|| between
the virtual geophones. The characteristic size of the adaptive confocal filter matches the coherence length 𝓁cof the backscattered wave-field (Figure 4a), that was introduced in section 3. The filter is chosen to be
Gaussian-shaped
RF(rin, rout) = R(rin, rout) × exp
[ −‖‖rin− rout‖‖2 2𝓁2 c ] (6) The effect of confocal filtering is illustrated in Figure 4; it displays the filtered reflection matrix RF(Figure 4c) at time t= 5 s. The original reflection matrix R is shown for comparison in Figure 2b. Figures 4b–4d display one line of R and RFreshaped in a 2-D wavefield. They correspond to the reflected wavefield from the focal plane for an input focusing point at the origin. The confocal filter of equation (6) tends to favor single-scattering paths that are associated with input and output focusing points distant from less than one coherence length 𝓁c. The further the input and output points are apart, the likelier the resulting signal is to contain
multi-ple scattering and the more it is accordingly penalized through the filter. As a consequence, even though R is clearly dominated by multiple scattering, RFindeed displays a single-scattering feature with most of the back-scattered energy gathered by close-diagonal elements (Figure 4c) and much narrower focal spots than the original matrix R (see, e.g., the comparison between the central focal spots displayed Figures 4b and 4d). However, RFstill contains a residual multiple-scattering component. Indeed, multiple scattering also con-tributes to the diagonal of R which is unaffected by the adaptive confocal filter in Equation 6. As a result, standard confocal imaging applied to RFwould also fail, resulting in the random speckle images displayed in
Figures 2h and 2i. Another operation is needed to filter the residual multiple scattering contribution. This is done using iterative time reversal (Badon et al., 2016a; Prada & Fink, 1994; Prada et al., 1996), presented in the next section.
4.3. Iterative Time Reversal
Iterative time reversal has originally been developed in acoustics. It initially consisted in insonifying a mul-titarget medium with a pulse wave, recording the back-scattered wavefield, and time reversing it. Then, this time-reversed response was sent back into the medium and the whole process was iterated (Prada & Fink, 1994). The procedure has been shown to converge toward a wave-front that selectively focuses on the strongest scatterer, even in presence of strong aberrations. Mathematically, this amounts to looking for the first invariant of the time reversal operator KK†.
Iterative time reversal paved the way toward the DORT method (French acronym for Decomposition of the Time Reversal Operator), which takes advantage of the response matrix K associated with an array of trans-ducers probing a homogeneous medium in which discrete scatterers are embedded (Prada & Fink, 1994;
Figure 4. Adaptive confocal filter of single scattering. (a) Scheme of the confocal filtering operation described in equation (6). (b) Reflected wavefield in the focal plane for an incident focusing wave at the origin of the focal plane at timet=5 s. (c) Filtered reflection matrixRFdeduced fromRdisplayed in Figure 2b. (equation (6)]. d) Adaptive confocal
filter applied to the wavefield displayed in (b). In panels (b, c, d), the modulus of matrix coefficients is displayed in arbitrary units with a linear color scale.
Prada et al., 1996). It consists in computing the whole set of invariants of the time reversal operator KK†from its eigenvalue decomposition, or equivalently, from the singular value decomposition (SVD) of K. Under a single-scattering assumption, there is a one-to-one correspondence between each eigenstate of K and each scatterer embedded in the medium. Each singular value is proportional to the target reflectivity and the cor-responding singular vector yields the wave-front that selectively focuses on each scatterer, even in presence of strong aberrations.
In the present case, the single scattering assumption is far from being verified and the one-to-one matching between scatterers and singular states of K is no longer true. Instead of working on the reflection matrix at the volcano surface, we consider it in the focal plane, and its confocally filtered version RFis brought into play. Due to the confocal filter, the multiple-scattering component has been severely reduced in RF. Next, we rely on DORT for extracting singly scattered echoes among the residual multiple scattering noise. The SVD of
RFreads RF= UΛV†= N 2 ∑ p=1𝜆p UpVp† (7)
where U and V are unitary matrices whose columns Upand Vpare the singular vectors.𝚲 is a real diagonal
matrix whose elements 𝜆1≥ 𝜆2≥ · · · ≥ 𝜆N2 ≥ 0 are the singular values. In the present case, the symmetry
of RFimplies that U = V∗. As was mentioned before, each eigenstate of R
Fshould be associated with one
scatterer only, under a single scattering assumption. Note that, in the case of RF, this assumption refers to scattering trajectories starting and ending at the virtual transducers, not the actual geophones.
Figure 5a displays the singular values of RFat time t= 5 s. The first two singular values seem to emerge from a continuum of lower singular values associated with the residual multiple scattering noise in RF. The square
Figure 5. Singular value decomposition of the reflection matrixRFat timet= 5s (Figure 4c). (a) Normalized singular values̃𝜆p(equation (8)) displayed in
decreasing order. (b) Image associated with the first eigenspace ofRF,|U1(r)|2. (c) Image associated with the second eigenspace ofRF,|U2(r)|2. (d) Histogram of
the experimental singular values compared with the probability density functions𝜌(𝜆)(red line),𝜌1(𝜆)(dark blue line), and𝜌2(𝜆)(light blue line) that would be
obtained in a fully developed multiple-scattering regime. The integration of𝜌1(𝜆)(green-shaded area) and𝜌2(𝜆)(blue-shaded area) from 0 to ̃𝜆1and ̃𝜆2
(equation (9)), respectively, yields the likelihood index of the corresponding eigenspaces.
norm‖Up(rin)‖2of the corresponding singular vector coefficients are displayed in Figures 5b and 5c. They
show an energy focusing at specific locations. However, a systematic and quantitative analysis of the singular value spectrum is needed in order to assess whether the first two singular values are indeed associated with coherent reflectors at the focal depth or if they are false alarms due to speckle fluctuations. To that aim, a prob-abilistic approach based on random matrix theory is developed in the next section in order to discriminate potential artifacts (Aubry & Derode, 2009b, 2010; Shahjahan et al., 2017).
4.4. Likelihood Index of Potential Targets
Since the scattering medium is considered as one realization of a random process, assessing the reliability of the images obtained requires a statistical model for the probability density function of the singular values
𝜆pin the multiple scattering regime. At any time t, by convention and for the sake of simplicity, the singular
values 𝜆pare normalized by their quadratic mean:
̃𝜆p= N𝜆p √ N2 ∑ q=1𝜆 2 q (8)
If the reflection matrix coefficients were independently and identically distributed random variables, the sin-gular values would obey the quarter-circle law(Marˇcenko & Pastur, 1967). However, because of the adaptive confocal filter applied to the raw reflection matrix R, the variance of the matrix elements RF(rin, rout) strongly
depends on the distance||rin− rout||. Moreover, aberrations also imply short-range correlations over the
coherence length 𝓁c, which also impacts the distribution of singular values (Sengupta & Mitra, 1999). For all
these reasons, the histogram of normalized singular values displayed in Figure 5d does not follow the quar-ter circle law. Therefore, in order to obtain a model for the probability density function 𝜌(𝜆) in a target-less area, we numerically generated a set of random reflection matrices whose elements display the same statis-tical behavior (i.e., mean value, standard deviation and inter-element correlation) as the experimental matrix coefficients(Aubry & Derode, 2011). By repeating this operation over 500 realizations, the probability density function 𝜌(𝜆) is estimated. Close agreement is found with the experimental histogram of the singular values, as shown in Figure 5d.
Once 𝜌(𝜆) is known, a likelihood index can be associated with the first singular state. To that aim, the relevant quantity is the distribution function F1of the first singular value (Aubry & Derode, 2009b, 2010):
F1(𝜆) = P( ̃𝜆1< 𝜆) = ∫
𝜆
0 𝜌1(𝜆)d𝜆
Figure 6. Isosurface plots of the three-dimensional images of the volcano built from (a) confocal focusing, (b, c) the first and second singular vectors ofRF,
𝜆21|U1(r)|2and𝜆22|U2(r)|2, respectively, and (d) the coherent combination of both (equation (10)). For all these isosurface plots, the images are multiplied in
depth by a factorz2to compensate for the geometrical decrease of singly scattered body waves.The isosurface is fixed to be 4% of the maximum of each image.
The color scale in panels (b) and (c) accounts for the likelihood index associated with the singular vector at each depth (see section 4.4).
with 𝜌1(𝜆) the probability density function of ̃𝜆1[see Figure 5d]. The quantity 1− F1( ̃𝜆1) is the probability that
a pure multiple-scattering speckle gives rise to a first singular value larger than the measured ̃𝜆1. Therefore,
F1( ̃𝜆1) can be directly used as a likelihood index that the first singular state of RFis actually associated with a
coherent reflector (a target) rather than a normal multiple-scattering speckle fluctuation. For instance, at the specific time of flight t= 5 s considered in Figure 5, the first singular state is associated with a target with a high likelihood index of 97%.
A likelihood index can also be assigned to any eigenstate of rank p > 1. To that aim, we need to determine the singular value distribution 𝜌p(𝜆) for a reflection matrix whose signal subspace is of rank (p − 1). Sengupta
and Mitra (1999) have shown that the(N2− p) smallest singular values (linked to the noise subspace) exhibit
the same distribution as singular values of a random matrix whose size is(N2− p) × N2. The corresponding
distribution function Fp(𝜆) can then be derived numerically following the same method as above. By way of example, the likelihood index of the second singular state in Figure 5 is of 98%.
5. Three-Dimensional Imaging of the Erebus Volcano
Before building a 3-D image of Erebus, let us recap the main steps of the procedure (see Figure S1 in the supporting information):
• The Green’s functions between the actual geophones have been recovered from cross correlation of ice-quakes;
• The resulting matrix H has been submitted to a time-frequency analysis;
• Assuming a constant velocity, focused beamforming has been achieved in order to emulate a virtual array of sources and receivers, at any arbitrary depth;
• A confocal filter, whose cutoff length is adapted to match the coherence length of the scattered field at each depth, is applied;
• The resulting matrix RFundergoes an SVD in order to extract its strongest eigenstates, and the probability for these eigenstates to be due to an actual reflector is evaluated, based on random matrix theory. So at this stage, we have all the necessary ingredients to build images and compare the result of the matrix approach to standard techniques.
The iterative time reversal process described in section 4.3 is applied at each time of flight. The images obtained from the first and second singular vectors of RFat each ballistic depth are stacked into 3-D images. The corresponding isosurface plots are displayed in Figures 6b and 6c. The statistical analysis described in section 4.4 allows to assign a likelihood index to each detected scattering structure. Note that only scattering structures associated with a likelihood index larger than 70% are displayed. Inferior values mean that the cor-responding singular state has a high probability of being associated with pure multiple-scattering speckle. Figure 6b displays the image provided by the first singular vector U1. Internal scattering structures of the vol-cano are imaged with a likelihood index higher than 90% until an elevation of−3, 000 m, that is, a depth z ∼ 9 ls. Figure 6c displays the image provided by the second singular vector U2. The latter image is much more sparse than the former one. Notably, U2is often associated with the same coherent reflector as U1but focuses on smaller details. Indeed, as soon as a scatterer is larger than a resolution cell, several singular vectors are associated with it. Their number n actually scales as the number of resolution cells contained in the scatterer (Aubry et al., 2006; Robert & Fink, 2009). A weighted combination of singular vectors allows to recover the complete structure of the reflectors in the volcano:
I(r) = n ∑ p=1 𝜆p|||Up(r)||| 2 (10) In the present case, only the two first singular vectors are considered (n= 2) because the third singular value is dominated by the multiple-scattering noise subspace of RF(see, e.g., Figure 5a).
Figure 6d displays the resulting three-dimensional image of the Erebus volcano. It should be compared with the random speckle image obtained by the direct confocal method (Figure 6a). The matrix approach described in this paper enables to highlight a chimney-shaped structure with a nearly 100% likelihood index (Figure 6b). Moreover, although computed independently, the results at each depth are spatially consistent, substanti-ating their physical meaning. In agreement with previous studies (Chaput et al., 2012; Zandomeneghi et al., 2013), the chimney seems to rise toward the lava lake at shallow depth, followed by a sharp bifurcation toward the northwest, finally setting centrally in a shallow magma chamber near 2,500-m elevation. Some particular features also emerge from the sea level to 5,000 m below it. An interpretation of these imaged structures will be provided in the next section.
Beforehand, however, it should be noted that the velocity model used for emission and reception is a bulk approximation and thus the depth is likely to be inaccurate. Yet a correct model would dilate the structure up or down but would not change significantly its geometrical shape. We should also keep in mind that the obtained 3-D image still suffers from aberrations owing to the imperfect wave velocity model used for the Erebus volcano. One great advantage of iterative time reversal is the ability to detect scatterers in presence of the strong wave-front distortions. However, the associated image still suffers from aberrations as the wave velocity model used for the back-propagation is inaccurate. The perspective of this work will be to tackle these aberration issues. A first step will be to incorporate the existing wave velocity model over the first kilometer depths (Zandomeneghi et al., 2013), before improving and extending it to larger depths thanks to the reflec-tion matrix approach. The removal of multiple reflecreflec-tions due to geological layering will be also a challenge (Verschuur et al., 1992).
6. Structural Interpretation
A structural interpretation of the three-dimensional image displayed in Figure 6 is now proposed by relying on the existing literature about Erebus. The Erebus magmatic system consists of a persistently open convect-ing lava lake and has historically produced multiphase magma, potentially a testament to its complex inner structure. Magmas related to the proposed hot spot upwelling beneath Ross Island have been found in wide regions (such as the Dry Valleys), and variability in the compositions have pointed to radial fracturing in the
lower crust as a mechanism for diversification. All current models suggest a single original mantle source with subsequent crustal assimilation. A large mantle anomaly down to roughly 400-km depth has been imaged as a source (Gupta et al., 2009). Beyond the modified confocal image produced by Chaput et al. (2012) and the subsequent shallow active source tomography model (Zandomeneghi et al., 2013); however, there are no reliable structural images of Erebus at intermediate depths. This lack of information between 1 and 100 km is due to several factors.
First, there is a general lack of magmatic seismicity at Erebus, thus precluding event location studies, com-pounded with a paucity of tectonic earthquakes in West Antarctica that could be used in passive tomographic studies (Winberry & Anandakrishnan, 2003). Furthermore, given the extreme topographic expression of Ere-bus on Ross Island, ambient noise Rayleigh wave reconstructions for imaging at depths of interest would require stations located in the Ross Sea. Geochemical and geological methods therefore are the only alterna-tive source of constraint for this depth range. Moussalam et al. (2013), for instance, studied phase equilibria in lavas for Erebus Lineage magmas (CO2-H2O-Pressure-Temperature-O2-fugacity). These magma phase equilib-ria suggest that a pressurized deeper body capable of reproducing Erebus lavas must be contained in the 4-to 7.5-km range. Note that this is in agreement with the inferred deeper structures imaged in the 5-km depth range in Figure 6d.
As a measure of confidence in our results, the top kilometer imaged in this study shows a distinctly west/northwest bifurcation immediately under the lava lake, which is supported by previous imaging stud-ies (Chaput et al., 2012; Zandomeneghi et al., 2013), as well as moment tensor inversions of very long period signals associated with gas slug movement in the shallow conduit preceding Strombolian eruptions (Aster et al., 2008). The agreement between Chaput et al. (2012) and this paper, both showing a west/northwest shallow bifurcation with a recentralization at 2,500-m elevation, is particularly encouraging, given that the former study was performed with autocorrelations of eruption coda, and thus an entirely different data set. This corroboration lays credence to the unbiased nature of the icequake-reconstructed Green’s functions. Furthermore, temporal variations in the timing of VLP signals with respect to the short-period lava lake eruption imply concurrent changes in gas slug trapping mechanisms (Knox et al., 2018), thus suggesting an abnormally lateral conduit system at shallow depths. This is a further testament to the complexity of the near-surface conduit structure and is reflected in the results presented here (see Figure 6d). Efforts are cur-rently underway to back-project continuous seismic data from the ETS-ETB arrays (Hansen & Schmandt, 2015) and identify any potential coherent magmatic seismicity embedded in the noise that might locate at depth.
7. Conclusion
The analysis of the cross-correlation of coda waves recorded by a set of geophones under a reflection matrix approach provides an elegant and powerful tool for geophysical exploration. The reflection matrix actually contains all the information about the propagation of body waves beneath the geophones array. The inco-herent noise present in the cross correlation of coda waves is efficiently reduced by the imaging procedure. This allows for an effective use of body waves for passive imaging with array correlations. Our approach first consists in applying a set of matrix operations to perform an adaptive confocal selection of singly scattered waves among a predominant multiple-scattering background. Iterative time reversal is then applied to the focal reflection matrix in order selectively focus on the most scattering parts of the scattering medium while removing the residual multiple scattering noise. This approach is applied successfully to the case of Erebus volcano. A 3-D image of the internal structure of the volcano is revealed while state-of-the art techniques fail in imaging such scattering media. Although the velocity model is approximate, the penetration depth and resolution are strongly enhanced compared to a direct back-propagation of seismic waves and could be even improved using more sophisticated back-propagation tools. Although only the single scattering contribution has been used here, a matrix analysis of the multiple scattering contribution can be fruitful to characterize the scattering and transport parameters of seismic waves propagating in the medium of interest (Aubry & Derode, 2007; Margerin et al., 2016; Mayor et al., 2017). In any case, this approach is very general and can be particularly useful in strongly heterogeneous environments such as volcanoes, mountain areas, or fault zones in which aberrations and scattering impede seismic bulk wave imaging.
References
Aster, R., Zandomeneghi, D., Mah, S., & Jones, K. (2008). Moment tensor inversion of very long period seismic signals from Strombolian eruptions of Erebus volcano. Journal of Volcanology and Geothermal Research, 177, 635–647.
Aubry, A., de Rosny, J., Minonzio, J.-G., Prada, C., & Fink, M. (2006). Gaussian beams and legendre polynomials as invariants of the time reversal operator for a large rigid cylinder. The Journal of the Acoustical Society of America, 120(5), 2746–2754.
Aubry, A., & Derode, A. (2007). Ultrasonic imaging of highly scattering media from local measurements of the diffusion constant: Separation of coherent and incoherent intensities. Physical Review E, 75, 026602.
Aubry, A., & Derode, A. (2009a). Random matrix theory applied to acoustic backscattering and imaging in complex media. Physical Review Letters, 102(8), 084301.
Aubry, A., & Derode, A. (2009b). Detection and imaging in a random medium: A matrix method to overcome multiple scattering and aberration. Journal of Applied Physics, 106, 044903.
Aubry, A., & Derode, A. (2010). Singular value distribution of the propagation matrix in random scattering media. Waves in Random and Complex Media, 20, 333–363.
Aubry, A., & Derode, A. (2011). Multiple scattering of ultrasound in weakly inhomogeneous media: Application to human soft tissues. The Journal of the Acoustical Society of America, 129, 225–233.
Badon, A., Li, D., Lerosey, G., Boccara, A. C., Fink, M., & Aubry, A. (2016a). Smart optical coherence tomography for ultra-deep imaging through highly scattering media. Science Advances, 2, e1600370.
Badon, A., Li, D., Lerosey, G., Boccara, A. C., Fink, M., & Aubry, A. (2016b). Spatio-temporal imaging of light transport in highly scattering media under white light illumination. Optica, 3, 1160–1166.
Berkhout, A. J. (1984). Seismic migration imaging of acoustic energy by wave field extrapolation. Amsterdam, Netherlands: Elsevier. Berkhout, A. J., & Wapenaar, C. P. A. (1993). A unified approach to acoustical reflection imaging. II: The inverse problem. Journal of the
Acoustical Society of America, 93, 2017–2023.
Berryhill, J. R. (1984). Wave equation datuming before stack. Geophysics, 49, 2064–2066.
Campillo, M., & Paul, A. (2003). Long-range correlations in the diffuse seismic coda. Science, 299, 547–549.
Chaput, J., Campillo, M., Aster, R. C., Roux, P., Kyle, P. R., Knox, H., & Czoski, P. (2015). Multiple scattering from icequakes at Erebus volcano, Antarctica: Implications for imaging at glaciated volcanoes. Journal of Geophysical Research: Solid Earth, 120, 1129–1141.
https://doi.org/10.1002/2014JB011278
Chaput, J., Clerc, V., Campillo, M., Roux, P., & Knox, H. (2016). On the practical convergence of coda-based correlations: A window optimization approach. Geophysical Journal International, 204, 736–747.
Chaput, J., Zandomeneghi, Z., Aster, R. C., Knox, H., & Kyle, P. R. (2012). Imaging of Erebus volcano using body wave seismic interferometry of Strombolian eruption coda. Geophysical Research Letters, 39, L07304. https://doi.org/10.1029/2012GL050956
Derode, A., Larose, E., Tanter, M., de Rosny, J., Tourin, A., Campillo, M., & Fink, M. (2003). Recovering the Green’s function from field-field correlations in an open scattering medium. The Journal of the Acoustical Society of America, 113, 2973–2976.
Gupta, S., Zhao, D., & Rai, S. S. (2009). Seismic imaging of the upper mantle under the Erebus hotspot in Antarctica. Gondwana Research, 19, 109–118.
Hansen, S. M., & Schmandt, B. (2015). Automated detection and location of microseismicity at Mount St. Helens with a large-N geophone array. Geophysical Research Letters, 42, 7390–7397. https://doi.org/10.1002/2015GL064848
Hennino, R., Tregoures, N., Shapiro, N., Margerin, L., Campillo, M., van Tiggelen, B. A., & Weaver, R. (2001). Observation of equipartition of seismic waves. Physical Review Letters, 86, 3447–3450.
Knox, H. (2012). Eruptive characteristics and glacial earthquake investigation on Erebus volcano, Antarctica (PhD thesis), Mexico Institute of Mining and Technology.
Knox, H., Chaput, J., Aster, R., & Kyle, P. (2018). Multiyear shallow conduit changes observed with lava lake eruption seismograms at Erebus volcano, Antarctica. Journal of Geophysical Research: Solid Earth, 123, 3178–3196. https://doi.org/10.1002/2017JB015045
Larose, E., Lobkis, O. I., & Weaver, R. L. (2006). Coherent backscattering of ultrasound without a source. Europhysics Letters, 76, 422–428. Larose, E., Margerin, A., Derode, L., van Tiggelen, B., Campillo, M., Shapiro, N., et al. (2006). Correlation of random wavefields: An
interdisciplinary review. Geophysics, 71, SI11.
Marˇcenko, V., & Pastur, L. (1967). Distributions of eigenvalues for some sets of random matrices. Math. USSR-Sbornik, 1, 457–483. Margerin, L., Campillo, M., & van Tiggelen, B. A. (2000). Monte Carlo simulation of multiple scattering of elastic waves. Journal of Geophysical
Research, 105, 7873–7892.
Margerin, L., Planôs, T., Mayor, J., & Calvet, M. (2016). Sensitivity kernels for coda-wave interferometry and scattering tomography: Theory and numerical evaluation in two-dimensional anisotropically scattering media. Geophysical Journal International, 204, 650–666. Mayor, J., Traversa, P., Calvet, M., & Margerin, L. (2017). Tomography of crustal seismic attenuation in metropolitan France: Implications for
seismicity analysis. Bulletin of Earthquake Engineering, 16, 2195–2210.
Moussalam, Y., Oppenheimer, C., Scaillet, B., & Kyle, P. (2013). Experimental phase-equilibrium constraints on the phonolite magmatic system of Erebus volcano, Antarctica. Journal of Petroleum, 54, 1285–1307.
Prada, C., & Fink, M. (1994). Eigenmodes of the time reversal operator: A solution to selective focusing in multiple-target media. Wave Motion, 20, 151–163.
Prada, C., Manneville, S., Spoliansky, D., & Fink, M. (1996). Decomposition of the time reversal operator: Detection and selective focusing on two scatterers. The Journal of the Acoustical Society of America, 99, 2067–2076.
Robert, J.-L., & Fink, M. (2008). The time-reversal operator with virtual transducers: Application to far-field aberration correction. The Journal of the Acoustical Society of America, 124, 3659–3668.
Robert, J.-L., & Fink, M. (2009). The prolate spheroidal wave functions as invariants of the time reversal operator for an extended scatterer in the Fraunhofer approximation. The Journal of the Acoustical Society of America, 125, 218–226.
Sengupta, A., & Mitra, P. (1999). Distribution of singular values for some random matrices. Physical Review E, 60, 3389–3392.
Shahjahan, S., Aubry, A., Rupin, F., Chassignole, B., & Derode, A. (2014). A random matrix approach to detect defects in a strongly scattering polycrystal: How the memory effect can help overcome multiple scattering. Applied Physics Letters, 104, 234105.
Shahjahan, S., Rupin, F., Aubry, A., & Derode, A. (2017). Evaluation of a multiple scattering filter to enhance defect detection in heterogeneous media. The Journal of the Acoustical Society of America, 141, 624–640.
Snieder, R. (2004). Retrieving the elastodynamic Green’s function of an arbitrary inhomogeneous medium by cross correlation. Physical Review E, 69, 046610.
Verschuur, D. J., Berkhout, A. J., & Wapenaar, C. P. A. (1992). Adaptive surface-related multiple elimination. Geophysics, 57, 1166–1177. Wapenaar, K. (2004). Retrieving the elastodynamic Green’s function of an arbitrary inhomogeneous medium by cross correlation. Physical
Review Letters, 93, 254301. Acknowledgments
The authors are grateful for funding provided by LABEX WIFI (Laboratory of Excellence within the French Program Investments for the Future, LABX-24 and ANR-10-IDEX-0001-02 PSL*), the European Research Council (F-IMAGE) and by TOTAL R&D. Portable seismic instruments for the TOMO Erebus experiment were provided by the Incorporated Research Institutions for Seismology (IRIS) through the PASSCAL Instrument Center at New Mexico Tech. Data are available through the IRIS Data Management Center under network code ZO (2011–2012), YA, and ZW (2007–2009). The facilities of the IRIS Consortium are supported by the National Science Foundation under cooperative agreement EAR-1063471, the NSF Oïce of Polar Programs, and the DOE National Nuclear Security Administration.
Wapenaar, K., Brackenhoff, J., Thorbecke, J., van der Neut, J., Slob, E., & Verschuur, E. (2018). Virtual acoustics in inhomogeneous media with single-sided access. Scientific Reports, 8, 2497.
Weaver, R. L., & Lobkis, O. I. (2001). Ultrasonics without a source: Thermal fluctuation correlations at MHz frequencies. Physical Review Letters, 87, 134301.
Winberry, P., & Anandakrishnan, S. (2003). Seismicity and neotectonics of West Antarctica. Geophysical Research Letters, 30(18), 1931. https://doi.org/10.1029/2003GL018001
Yilmaz, O. (2008). Seismic data analysis. Processing, inversion, and interpretation of seismic data, Society of Exploration Geophysicists Tulsa, OK, USA.
Zandomeneghi, D., Aster, A., Kyle, P., Barclay, A. H., Chaput, J., & Knox, H. (2013). Internal structure of Erebus volcano, Antarctica imaged by high-resolution active-source seismic tomography and coda interferometry. Journal of Geophysical Research: Solid Earth, 118, 1067–1078. https://doi.org/10.1002/jgrb.50073
Zandomeneghi, D., Kyle, P., Miller, P., Snelson, C., & Aster, R. (2010). Seismic tomography of Erebus volcano, Antarctica. Eos, Transactions American Geophysical Union, 91, 53–55.