Dynamic Planning and Control Methodology:
Understanding and Managing Iterative Error and Change Cycles in
Large-Scale Concurrent Design and Construction Projects
by SangHyun Lee
B.E., Architectural Engineering, Dong-A University, 2000 M.S., Civil and Environmental Engineering, MIT, 2003 Submitted to the Department of Civil and Environmental Engineering
in Partial Fulfillment of the Requirements for the Degree of
Doctor of Philosophy in the Field of Construction Management and Information Technology at the
Massachusetts Institute of Technology June 2006
© 2006 Massachusetts Institute of Technology a tl i .· ·~~~~~~ OF TECHNOLOGY JUN 0 7 26 LIBRARIES All nrgnts reserved Signature of Author.
... ...
Department of Civil and Environmental Engiing May 12, 2006 Certified by
... ... vn~~i
Fd Moavenzadeh
Professor of Civil and Environmental Engineering Chairman, Doctoral Thesis Committee Certified by
...-
1
...
( Feniosky Pefia-Mora Associate Professor of Civil and EnvYonmental Engineering I X aI . Thesis Supervisor Accepted by
...
t
'
V,
v
:
;A
dew ii
...
'
.
Chairman, Departmental Commre WhittleChairman, Departmental Committee for Graduate Students
Dynamic Planning and Control Methodology:
Understanding and Managing Iterative Error and Change Cycles
in Large-Scale Concurrent Design and Construction Projects
by SangHyun Lee
Submitted to the Department of Civil and Environmental Engineering in Partial Fulfillment of the Requirements for the Degree of
Doctor of Philosophy in the Field of Construction Management and Information Technology
ABSTRACT
Construction projects are uncertain and complex in nature. One of the major driving forces that may account for these characteristics is iterative cycles caused by errors and changes. Errors and changes worsen project performance and consequently, cause schedule and cost overruns to be prevalent. In particular, these iterative cycles are more detrimental when large-scale concurrent design and construction is applied.
In an effort to address these issues, this research proposes Dynamic Planning and control Methodology (DPM) as a robust design and construction planning methodology for large-scale concurrent design and construction. The proposed DPM is composed of: 1) an error and change management framework that enables understanding of the construction processes associated with errors and changes and how they affect construction performance; 2) a proactive buffering strategy for reducing sensitivity to iterative error and changes cycles; 3) a System Dynamics-based construction project model which provides policy guidelines for the planning and control of projects; and 4) a web-based error and change management system, which supports coordination of errors and changes among contractors and design professionals without hardware and software compatibility issues.
Applying all research components into a couple of real world case projects, this research concludes that a concurrently developed project can benefit by: 1) adding realism to planning taking into account iterative error and change cycles; 2) implementing a proactive mechanism to look and act ahead against uncertainties; 3) making appropriate policies with the help of the system dynamics-based simulation model; and 4) facilitating coordination from the IT-supported management system; even if the time frame of a project is shortened. Also, future research opportunities are discussed extending the findings from this research.
Chairman, Doctoral Thesis Committee: Fred Moavenzadeh Title: Professor of Civil and Environmental Engineering Thesis Supervisor: Feniosky Pefia-Mora
ACKNOWLEDGEMENTS
This thesis is dedicated to my family. Without their care, my studies at MIT would not have been a reality. To my father and mother, their unconditional love has been a source of inspiration. If this thesis can make them smile, my efforts and patience will be fully paid off. In particular, I sincerely wish my completion of this thesis will keep my lovely nephew and niece 'dreaming'. I would like to thank my mentor, Professor Feniosky Pefia-Mora, for his inexhaustible support. Actually, it is not just 'support', rather, 'shadow'. He has been behind me for my research and my family. Working with him is the most valuable and exciting experience in my MIT life. I am very proud that I am his student and friend and hope I can do the same kinds of things for him throughout our lives.
I would like to express my gratitude to Professor Fred Moavenzadeh who has given me sincere guidance on this research. His sharp comments have always inspired me to work hard. I would also like to acknowledge Professor Jerome Connor's and Professor Massood Samii's contributions to this research. They have been always kind to me and further, encouraged me to get through it. Also, I would like to thank Professor MoonSeo Park at Seoul National University and ManHyoung Lee at ChungBuk National University for their endless care. Spending the time with them and their family is one of the most pleasant memories during this study.
In addition, I would like to acknowledge the contribution to this thesis by Professor Chimay Anumba at Loughborough University, Professor Indra Gunawan and Mr. Tai Soon Chi at the Malaysia University of Science and Technology, Philip Helmes and Margaret Fulenwider, Vice President and Associate Principal, respectively, at CRA International Inc., Professor Lucio Soibelman at Carnegie Mellon University, Professor Khaled El-Rayes at the University of Illinois at Urbana-Champaign, Professor NamSeek Hong at Dong-A University, JongMin Shim, Graduate Student at MIT, SangWon Han, JeongWook Son, and DoHeon Jeon, Graduate Students at UIUC, and the financial support for the thesis research received from CRA International Inc. (previously, InteCap Inc.), Kajima Corporation, the National Science Foundation CAREER and PECASE Award CMS-9875557, the National Science Foundation Award CMS-0324501, and MIT Berger Fellowship.
Finally, I wish to thank my wife, JungSook. Her love and support has been essential. I have never been afraid of any challenge and hardship because she has been and will continue to be with me. Moreover, her passion and endeavor for her dream has driven me to never give up. This thesis is all about her smiles and tears.
The completion of this thesis means not 'mastering' knowledge but 'recognizing' ignorance. It just opened the door to the truth, enabling to see the road toward it. At this moment, I am the happiest man in the world, realizing the joy of a lifetime of learning, standing with my eternal learning companion, JungSook.
TABLE of CONTENTS
CHAPTER 1 PREFACE ... 10
CHAPTER 2 RESEARCH APPROACH ... 15
2.1 ANALYSIS ... 17
2.2 DEVELOPMENT ... 17
2.3 VALIDATION ... 18
CHAPTER 3 ERROR AND CHANGE MANAGEMENT FRAMEWORK ... 19
3.1 LITERATURE REVIEW ... 20
3.2 FEEDBACK PROCESSES CAUSED BY ERRORS AND CHANGES ... 21
3.3 ADDITIONAL WORK SCOPE GENERATED BY ERRORS AND CHANGES ... 22
3.4 ERRPR AND CHANGE MANAGEMENT FRAMEWORK ... 23
3.5 PLANNED, PERCEIVED, AND REAL PERFORMANCE ... 37
CHAPTER 4 RELIABILITY AND STABILITY SCHEDULE BUFFERING ... 44
4.1 JUST-IN-TIME VS. JUST-IN-CASE ... 45
4.2 LITERATURE REVIEW ... 47
4.3 RELIABILITY AND STABILITY BUFFEIRNG APPROACH ... 49
4.4 IMPLEMENTATION OF RELIABILITY AND STABILITY BUFFEIRNG ... 61
CHAPTER 5 SYSTEM DYANMCIS-BASED SIMULATION MODEL ... 63
5.1 LITERATURE REVIEW ... 65
5.2 WHY SYSTEM DYNAMICS9 ... 66
5.3 DYNAMIC DESIGN AND CONSTRUCTION PROJECT MODEL ... 70
5.4 VALIDATION ... 101
CHAPTER 6 WEB-BASED ERROR AND CHANGE MANAGEMENT SYSTEM ... 104
6.1 LITERATURE REVIEW ... 104
6.2 SYSTEM OVERVIEW ... 106
6.3 COLLABORATIVE ENVIRONMENT ... 109
6.4 IMPLEMENTATION OF THE DPM SYSTEM ... 112
6.5 FUNTIONALITIES OF THE DPM SYSTEM ... 116
CHAPTER 7 CASE STUDY ... 126
7.1 INPUT ELICITATION PROCESS ... 126
7.2 LABORATORY BUIDLING PROJECT IN MALAYSIA ... 129
7.3 HIGHWAY BRIDGE INFRASTRUCTURE PROJECT IN MASSACHUSETTS ... 137
CHAPTER 8 CONCLUSIONS ... 152
8.1 POTENTIAL IMPACT ... 157
CHAPTER 9 FUTURE RESEARCH ... 159
9.1 COMPREHENSIVE SIMULATION FRAMEWORK ... 160
9.2 APPLICATION OF LATENCY AND PROACTIVE BUFFERING ... 163
RFERENCES ... 174
APPENDIX I SYSTEM DYANMICS MODEL STRUCTURES ... 181
APPENDIX II SYSTEM DYNAMICS MODEL EQUATIONS ... 188
APPENDIX III JAVA CODES FOR THE WEB-BASED DPM SYSTEM ... 211
LIST of FIGURES
FIGURE 1. DERIVATIVE ACTIVITY ... 12
FIGURE 2. RESEARCH APPROACH ... 16
FIGURE 3. SIMULTANEITY CAUSED BY ERRORS AND CHANGES ... 22
FIGURE 4. INTERNAL ERROR AND CHANGE MANAGEMENT FRAMEWORK ... 25
FIGURE 5. EXAMPLE OF LATENCY ... 27
FIGURE 6. EXTERNAL ERROR & CHANGE MANAGEMENT FRAMEWORK ... 36
FIGURE 7. ERROR AND CHANGE MANAGEMENT PROPAGATION EFFECT ON THE WHOLE NETWORK ... 37
FIGURE 8. SCHEMA OF DYNAMIC DESIGN AND CONSTRUCTION PROJECT MODEL ... 39
[ADAPTED FROM FORD AND STERMAN, 1998] ... 39
FIGURE 9. PLANNED, PERCEIVED, AND REAL PERFORMANCE AT PILE INSTALLATION EXAMPLE ... 42
FIGURE 10. APPLICATION OF THE D2CPM SCHEMA ... 43
FIGURE 11. INEFFICIENCY OF CONTINGENCY BUFFER ... 48
FIGURE 12. RELIABILITY AND STABILITY BUFFER SPLIT ... 52
FIGURE 13. YERKES-DODSON LAW [ADOPTED FROM YERKES-DODSON, 1908 AS REFERRED ON STERMAN, 2000] ... 53
FIGURE 14. EXAMPLE OF PRODUCTION TYPE [ADAPTED FROM EPPINGER, 1997 AS REFERRED BY PESA-MORA AND LI, 2001] AND THEIR IMPACT ON BUFFER SIZE ... 56
FIGURE 15. SCHEDULE UPDATE BY DYNAMIC BUFFERING ... 60
FIGURE 16. RELIABILITY AND STABILITY BUFFERING IMPLEMENTATION STEPS IN SCHEDULE [ADAPTED FROM GOLDRATT, 1997; PARK AND PE&A-MORA, 20041 ... 62
FIGURE 17. INCONSISTENT TIME STEP SIZE N DES [ADAPTED FROM HAN ET AL., 2006] ... 70
FIGURE 18. FEEDBACK PROCESSES ON ERROR AND CHANGE MANAGEMENT PROCESS ... 74
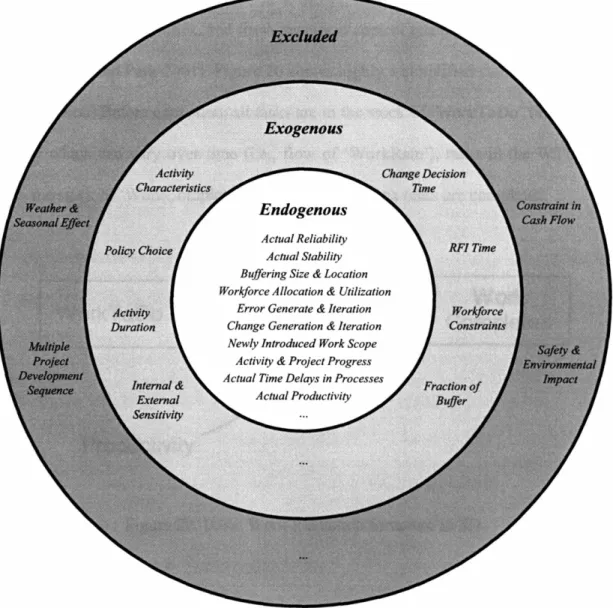
FIGURE 19. MODEL BOUNDARIES ... 76
FIGURE 20. BASIC WORK EXECUTION STRUCTURE IN SD ... 77
FIGURE 21. MODELING WORK CONSTRAINTS ... 79
FIGURE 22. ACTIVITIES FOR SIMULATION EXPERIMENT ... 79
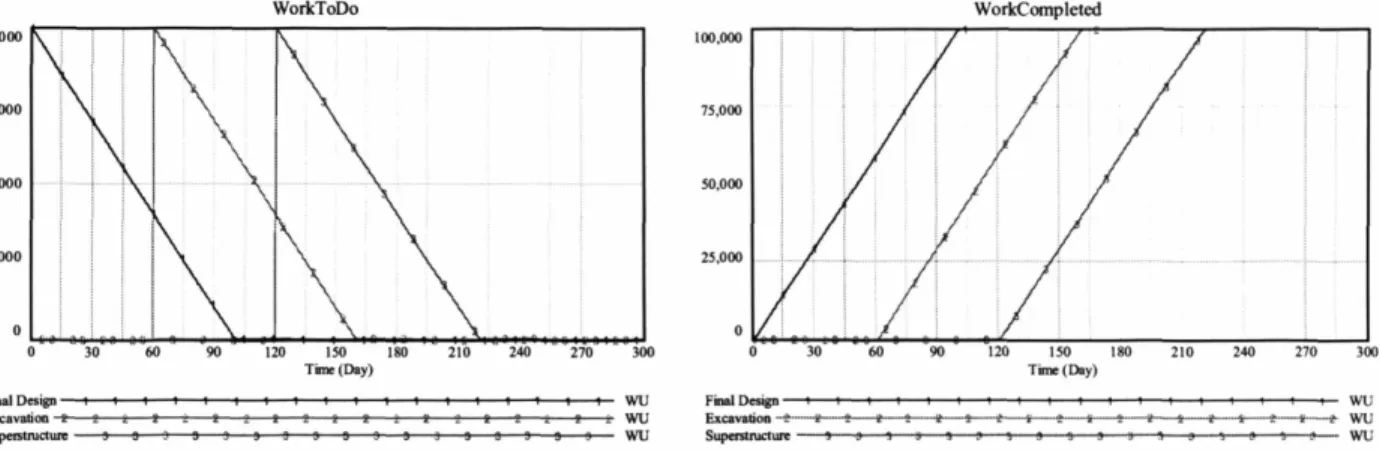
FIGURE 23. CPM CASE- BEHAVIOR OF WORKTODO AND WORKCOMPLETED STOCK ... 80
FIGURE 24. DYNAMIC PRODUCTION RATE ... 81
FIGURE 25. CASE 1- BEHAVIOR OF WoRKTODO AND WORKCOMPLETED STOCK ... 81
FIGURE 26. CASE 1 -EXCESS OF QM CAPACITY ... 82
FIGURE 27. WORK EXECUTION WITH ERROR MANAGEMENT [ADAPTED FROM PUGH-ROBERTS ASSOCIATES, 1980; FORD AND STERMAN, 1998; PARK AND PERA-MORA, 2003] ... 84
FIGURE 28. CO-FLOW STRUCTURES FOR ERRORS ... 85
FIGURE 29. WORK EXECUTION WITH CHANGE MANAGEMENT ... 86
FIGURE 30. ILLUSTRATION OF TWO DIFFERENT EXCAVATION METHOD ... 88
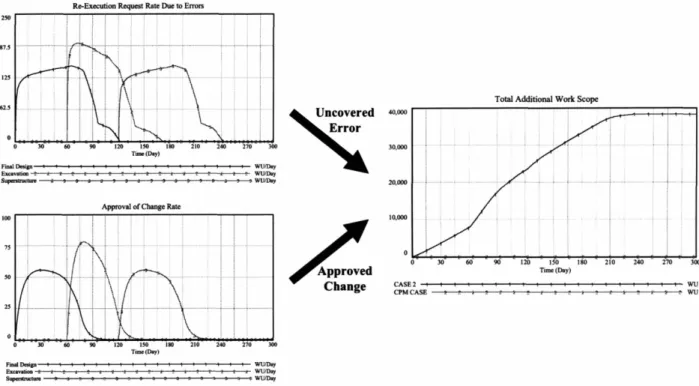
FIGURE 31. CASE 2- ADDITIONAL WORK SCOPE CAUSED BY ERRORS AND CHANGES ... 89
FIGURE 32. WORK EXECUTION WITH THE RFI PROCESS [ADAPTED FROM PUGH-ROBERTS ASSOCIATES, 1980; FORD AND STERMAN, 1998; PARK AND PE&A-MORA, 20031 ... 93
FIGURE 33. EXAMPLE - LATE DISCOVERY OF HIDDEN ERROR AND CORRECTION REQUEST
FROM THE SUCCESSOR ACTIVITY ... 94
FIGURE 34. CASE 3 - PROPAGATION IMPACT ... 95
FIGURE 35. CASE 4-IMPACT OF LATENCY ... 96
FIGURE 36. CASE 4-LATE DISCOVERY OF ADDITIONAL WORK SCOPE DUE TO LATENCY .... 97
FIGURE 37. SUPPORTING MODEL STRUCTURES ... 98
FIGURE 38. EXAMPLE OF SUPPORTING MODEL STRUCTURE ... 101
FIGURE 39. DPM SYSTEM OVERVIEW ... 107
FIGURE 40. UML ACTIVITY DIAGRAM WITH SWIMLANES-. ... 109
COMPARING SIMULATION RESULT WITH ORIGINAL PLAN ... 109
FIGURE 41. DPM SYSTEM ARCHITECTURE FOR COLLABORATIVE ENVIRONMENT ... 111
FIGURE 42. SAMPLE DATA MODEL IN DPM ... 113
FIGURE 43. UML DEPLOYMENT DIAGRAM ... 114
FIGURE 44. INSIDE APPLICATION LOGIC TIER ... 115
FIGURE 45. DPM MAIN WINDOW ... 116
FIGURE 46. OVERVIEW OF INPUT AND OUTPUT OF DPM ... 117
FIGURE 47. BASIC DATA - DEPENDENCY STRUCTURE MATRIX WITH SMART CELLS ... 119
FIGURE 48. SIMULATION DATA: PROJECT POLICY-RELATED INFORMATION ... 120
FIGURE 49. PROJECT AND ACTIVITY LEVEL OUTPUT ... 122
FIGURE 50. TRACKING SCHEDULE CHANGES ... 123
FIGURE 51. GAME (INTERACTIVE SIMULATION) ... 124
FIGURE 52. INFORMATION EXCHANGE WITH PRIMAVERA DATABASE ... 125
FIGURE 53. INPUT ELICITATION PROCESS ... 128
FIGURE 54. EXAMPLE OF THE PRE-DETERMINED QUESTIONNAIRE FOR THE INPUT ELICITATION PROCESS ... 128
FIGURE 55. PROJECT LOCATION AND SITE PHOTO ... 130
FIGURE 56. PLANNED, ACTUAL, AND SIMULATION PERCENTAGE OF WORK COMPLETE ... 133
FIGURE 57. TOTAL ADDITIONAL WORK SCOPE CAUSED BY HIDDEN ERROR AND LATENCY CHANGES... 135
FIGURE 58. COORDINATION WORK TO RESOLVE ERRORS AND CHANGES ... 136
FIGURE 59. PROJECT LOCATION AND SITE PHOTO ... 137
FIGURE 60. SIMULATION RESULTS OF THE CASE PROJECT BY WEB-BASED DPM ... 141
FIGURE 61. IMPACTS OF DESIGN ERRORS AND CHANGES ... 142
FIGURE 62. INCREASED WORK SCOPE IN SUCCEEDING ACTIVITIES ... 143
FIGURE 63. SIMULATION SETTING AND RESULTS ... 146
FIGURE 64. REDUCTION OF HIDDEN ERRORS AND LATENT CHANGES DURING THE BUFFER PERIOD ... 147
FIGURE 65. IMPROVEMENT OF RELIABILITY AND STABILITY DURING THE BUFFER PERIOD. 148 FIGURE 66. EARLY ADOPTION OF ERRORS AND CHANGES ... 149
FIGURE 67. EFFECTIVENESS OF RELIABILITY AND STABILITY BUFFER ... 151
FIGURE 68. COMPREHENSIVE SIMULATION FRAMEWORK ... 160
FIGURE 69. DPM'S EXTENSION TO STOCHASTIC SIMULATION ... 162
FIGURE 70. EXAMPLES OF STOCHASTIC SIMULATION RESULTS ... 163
FIGURE 71. VISUAL MOTION METAPHOR [EXTENDED FROM SONG ET AL., 2005] ... 168
FIGURE 73. VISUALIZED PROGRESS MONITORING HISTORY ... 170
LIST of TABLES
TABLE 1. APPLIED TEST TECHNIQUES ... 102
TABLE 2. SIMULATION INPUT FOR SIRIM PROJECT ... 132
TABLE 3. SIMULATION INPUT FOR TREBLE COVE PROJECT ... 139
TABLE 4. DIVERSE PROJECT DURATIONS OF THE CASE PROJECT ... 140
CHAPTER
1
PREFACE
Errors and changes are very common and are one of the major driving factors for uncertainty in construction. Errors, changes, and consequent conflicts lead to significant schedule and cost overrun if not properly managed. For example, during the execution of a project, the time taken to rectify errors is estimated to be 11% of the total working hours allocated for a project and the cost to correct these errors is approximately 6% of production costs [Josephson and Hammarlund,
1999]. The cost to implement changes is estimated to be 5.1% - 7.6% of the total project cost [Cox et al, 1999]. This translates into $50 billion being spent annually on new change orders by the construction industry in the U.S. alone [Ibbs et al., 1998].
This is partly because of the nature of design and construction processes, which inherently involves complex and dynamic interactions among diverse variables, such as participant experience, physical attributes, resource procurement, strategies, time and cost constraints, and management techniques. Thus, an unanticipated error or change could propagate to other activities; for example, through their physical and procedural relationships. As a result, the monitored performance may not follow the planned performance and is often ambiguous in identifying the root causes for this gap. Consequent symptoms in construction projects include chronic schedule and cost overrun, despite advancements in construction equipment and
management techniques [Park and Pefia-Mora, 2003]. The static approach of traditional construction planning and control tools is not very efficient in dealing with these problems [Lyneis et al, 2001], and situations become worse when concurrent design and construction is applied, a process that has been widely adopted in the A/E/C industry due to its promise for shortening project duration. This is because in concurrent design and construction: 1) succeeding activities often have to start work without complete information from preceding activities, which in turn, increases the number of assumptions to be made [Tighe, 1991 ] and the frequency and the number of information transfers [Ford and Sterman, 2003]; 2) overloaded workers sometimes fail to respond to communications, thereby compounding the information supply problem and compromising others' performance [Chachere et al, 2004]; and 3) pressures of a shortened project delivery time can accelerate the decision making process, which could introduce additional errors and changes [Lee et al., 2005]. Thus, combined with high procedural and physical constraints, errors and changes in concurrent design and construction may lead to a significant chain of wrong decisions in other related activities, which consequently, resulted in performance degradation and schedule and cost overruns.
However, traditional network-based tools, which have been widely used in the A/E/C industry, lack the capability to manage such dynamic and complex feedback caused by iterative error and change cycles, which are very common in construction industry [Lyneis et al, 2001]. Through some methods, such as Graphical Evaluation and Review Technique (GERT, 1966), feedback can be managed, but their usage is limited to a static work scope (e.g., rework iterations). As an example, suppose overtime is applied to rework unanticipated errors and changes. GERT can capture these rework iterations through loop relationships with a given
probability. However, when the completed predecessor activity's errors and changes are discovered at the successor activity, as illustrated in Figure 1, workers and equipment from completed activities may have to be called back to the site, in particular if the only way to make adjustments is to go back and re-execute the work on the predecessor activity. GERT does not provide an effective way to deal with those types of dynamics like supplemental activities or
derivative activities, which are common in design and construction projects. In addition,
feedback in construction can have intangible and dynamic effects on the construction system as
well (e.g., varying workers' morale during construction). In the previous example, applying
overtime could deteriorate workers' morale and consequently, decrease workers' productivity. As a result, the applied overtime can have a negative effect on the schedule performance. Traditional network-based tools may not be efficient in capturing this dynamic feedback.
S ST PFT
Situation
Result
I I
I I
: !' P's Er~or &Change
9
ComJlle~ed P II
DIscovery""'--l
S-.
I
P's Error or Change : Generation Derivative Activity ...----c-o-m-p-'-e-t.e-d-p--- .... S Delay_~s_m
-Note P: The Predecessor Activity
S: The Successor Activity
Figure 1. Derivative Activity
ST: Start Time FT: Finish Time
One notable research effort to deal with these problems is the Dynamic Planning and
control Methodology (DPM), which has been developed at the Intelligent Engineering Systems
Laboratory (IESL), MIT [Pefia-Mora and Li, 2001; Park and Pefla-Mora, 2003]. DPM aims to provide policy guidelines for unexpected events by supplementing network-based tools with mechanisms to represent the dynamics of a project. However, DPM, in its original version, focused only on the quality aspect of construction performance. The original DPM did not contain mechanisms to explicitly address uncertainties resulting from changes, which is another important source of iterative cycles during the construction process. In addition, the original DPM may lack the capability of managing the impact of errors and changes, particularly in concurrent design and construction. In such an aggressive development environment, the impacts of errors and changes could be more iterative and complex so that they often substantially increase the project duration and total cost [Ibbs, 1997].
To effectively address iterative error and change cycles and their impacts in concurrent design and construction, an extension of the original DPM is presented in this research. The enhanced DPM identifies construction changes as well as quality problems in a timely manner so that possible conflicts resulting from iterative cycles can be minimized. Specifically, DPM constitutes: 1) an analytic error and change management framework to understand how errors and changes are associated with the construction process and how they affect construction performance; 2) a proactive schedule buffering approach to absorb the detrimental impacts of errors and changes; 3) a System Dynamics-based construction project model to analyze the impacts of errors and changes on construction performance; and 4) a web-based error and
change management system to support the coordination of errors and changes among
geographically distributed parties involved in the construction project.
The objective of this research is to develop a DPM that helps prepare a robust design and
construction plan against uncertainties and complexities caused by errors and changes and
provides policy guidelines for the planning and control of large-scale concurrent design and
construction projects. Thus, the proposed DPM is expected to benefit the entire life cycle of
design and construction projects by reducing costs, avoiding delays, increasing quality, eliminating counterproductive disputes, and improving project management by reducing the impact of errors and changes.
This dissertation continues with a brief introduction of research methodology adopted in this research (Chapter 2). Then, four major components of this research: an analytic framework, a proactive buffering, a System Dynamics-based simulation model, and a web-based system, are discussed in subsequent chapters (Chapter 3-6). In particular, each chapter is composed of a respective problem statement, literature review, and this research's accomplishment. In the subsequent chapters, a couple of real world case projects, a highway bridge infrastructure project in Massachusetts and a laboratory building project in Malaysia, are discussed applying all research components (Chapter 7), and conclusions are drawn (Chapter 8). Lastly, future research opportunities will be discussed based on this research (Chapter 9).
CHAPTER 2
RESEARCH APPROACH
To accomplish the objectives stated in Chapter 1, this research is conducted based on three major steps: analysis, development, and validation, as seen in Figure 2. The analysis step sets research objectives and determines the focus of this research through diverse research methods. Based on this analysis, four major research components were developed (development). Then, these are validated through a couple of real-world case projects. One thing to note is that these steps are not sequential but spiral. For example, more analysis could be done during a development and validation phase if necessary. Because research products (e.g., model and system) evolve as research progresses, we continue to develop a better understanding of problems and challenges.
M
e
=! ~ i <J!~~ ~ ~" J!~H c-..
j
-~ll!=i ~=
=
LUhH
~ 0 ..cH
lfl.!.P
~ CJ ~ ~=
0....--+
.•
....-=
=
~-e
=
~e
~..
=
rJ'J=
=
~ ~z
~t
~ ~ 0 ~u
~ jl1I1~11
ile
!! H • ~ ~M .
....- ,...l::l Q ! ~ U ~ ~ ~ i ill j rJ'J 0 ~ ~ J. Jl I f 0.. 0 ~ 0.. ~ ij! l!IH
I, f i ~ ~=
~ ilf¥ hi I~II ..c ,...l::le
I U ! III
i'i 1 ..c ~=
~ J.11=!1=T
~ Q) ~ ~ CIl ~ ~ IIIHI-1
Lm ~ ~~ !ii ;:j Ol)11
~11
2.1 ANALYSIS
To identify what to solve and how to solve in detail, diverse research methods were conducted in this analysis phase, such as a literature review, practitioner interview, and practitioner survey. For example, an extensive literature review is conducted to study related works and their major accomplishments. In addition, diverse interviews and surveys are directly conducted with industrial partners such as Charles River Associates and Barletta Co. in the US and indirectly with Topjaya Engineering Sendirian Berhad in Malaysia through the Malaysia University of Science and Technology. Based on these research methods, four major research developments were determined. All issues raised in this analysis phase will be included in each chapter for each development.
2.2 DEVELOPMENT
There are four major developments in this research. The first one is an analytic framework that aims to understand how errors and changes are associated with the construction process and how they ultimately affect construction performance. Based on this understanding, the means to manage the detrimental impacts of errors and changes is presented focusing on construction schedule. Then, a System Dynamics-based simulation model is developed to analyze the impact of errors and changes and the benefit from the proposed management mechanism. Finally, a web-based error and change management system is implemented to support coordination of errors and changes among geographically distributed parties. In summary, a comprehensive
research development is designed from initiating a theory to implementing a working model and system in order to understand and manage the impact of errors and changes.
2.3 VALIDATION
All developments are applied to a couple of real-world case projects: a laboratory building project in Malaysia and a highway bridge infrastructure project in Massachusetts. The former was in collaboration with the Malaysia University of Science and Technology, and the latter was with Charles River Associates. Through these case studies, consequent conclusions and implications of this research are drawn.
CHAPTER 3
ERROR AND CHANGE
MANAGEMENT FRAMEWORK
Most iterative cycles in design and construction are triggered by errors and changes. Error is defined as defective work of poor quality, such as the placement of piling in the wrong location or poor concrete performance; change is defined as any work required of the contractor or subcontractor that was not specified in the original contract document [Trauner, 1992]. An example of this would be the owner's request to change the building's purpose from a usual office space to a library facility.
In this chapter, the association of errors and changes with the construction process and
how they dynamically affect construction performance are discussed. In particular, the
understanding of the process with respect to errors and changes is the author's main interest. This is because if we have a good understanding of how it works, we will have a better chance to manage errors and changes successfully.
3.1 LITERATURE REVIEW
There has been a lot of research done in understanding of errors and changes. One of the main streams is the identification of their impact on productivity mostly with regression or neural network. For instance, Hester et al. (1991) studied construction change order impacts on labor productivity at the craft level, and Ibbs (1997) identified the effect of the size of change and its impact on productivity and cost. Hanna et al. (1999) researched on the impact of change orders on labor productivity using a linear regression model, and Moselhi et al. (2005) performed similar investigations using a neural network. In addition, Williams (2000) studied the risk of changes to safety regulations and their effect on a project and Lee et al. (2004) developed decision tree models to classify and quantify productivity losses caused by change order impacts.
All of these research efforts have contributed to the understanding of the impact of errors and changes on a project. However, another significant issue in understanding of errors and changes is the identification of impact mechanism caused by errors and changes. In addition to the identification of the degree of relationships between errors and changes and their impact on a project, how the construction process behaves as errors and changes are introduced is a key to make an appropriate policy to manage them. In this context, this research focuses on how errors and changes are associated with the construction process and how they affect construction performance. In addition, a timing issue in errors and changes has been rarely discussed in previous research. Recently, the author raised the detrimental impact of latency' (i.e., late
Ia situation where errors and changes are not identified immediately and thus, become hidden and have a high possibility of re-appeared in a later stage of a project. It will be heavily discussed in this dissertation.
discovery of errors and changes) on performance [Lee et al., 2005], and Ibbs (2005) discussed the timing issue of changes concluding that late changes are more disruptive of project productivity than early changes. Extending these discussions, this chapter also explores latency in managing errors and changes at the process level.
3.2 FEEDBACK PROCESSES CAUSED BY ERRORS AND CHANGES
Construction projects are inherently complex and dynamic, involving multiple feedback processes [Sterman, 1992]. The uncertainty and complexity of design and construction projects
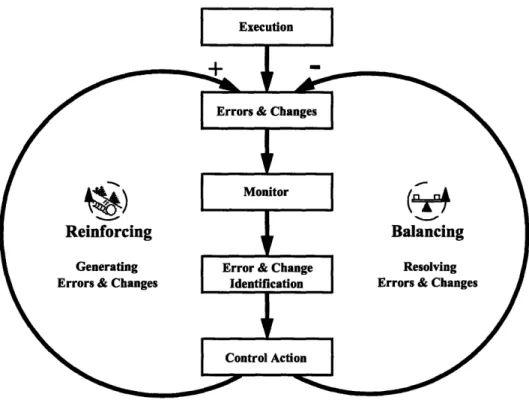
are usually driven by these feedback processes. There are only two types of feedback processes; reinforcing and balancing [Sterman, 2000]. Dynamics in a system arise from the interaction of these two types of feedback processes among the components of the system, not from the complexity of the components themselves [Sterman, 2000]. Figure 3 shows the basic simultaneity of the reinforcing and balancing feedback in design and construction projects, which is caused by errors and changes. The control actions to address errors and changes can have the intended effect of resolving the issues that initiate the control actions, if the decision is correct and well implemented. At the same time, they can produce a side effect that may create some unintended problems, if the decision is incorrect, not well implemented, exceeds the time frame of its effectiveness or if a project manager does not realize the impact of the control actions on other related activities. As discussed earlier, overtime applied to deal with a schedule slippage could slow the project progress down by deteriorating workers' productivity.
Figure 3. Simultaneity caused by Errors and Changes
3.3 ADDITIONAL WORK SCOPE GENERATED BY ERRORS AND CHANGES
Errors and changes usually cause non-value-adding iterations that deteriorate productivity and quality. These iterations are originally set according to an initial work scope. Thus, when an additional work amount is introduced by errors and changes, the designed productivity and quality may no longer be maintainable. The deterioration of productivity and quality are one of the main sources of multiple feedback processes and the corresponding actions necessary to recoup the deficit often generate unanticipated side effects.
Suppose an excavation activity can be completed by 10 backhoe loaders within 10 working days. If an additional 20% of work is added to the initial work amount to rectify errors and implement changes, a schedule delay of two days will occur (i.e., initial productivity will then require 12 days with 10 backhoe loaders). Managers will then typically utilize the tool of overtime to keep the initial 10 days. As expected, prolonging work hours will take care of the additional work, but the extended work hours simultaneously deteriorate the workforce's productivity due to increasing fatigue. Therefore, unexpected effects caused by various compensatory mechanisms need to be anticipated.
In this context, identifying how errors and changes are introduced, how they produce additional work scope and ultimately, how they affect performance, would be the key to the success of managing errors and changes in design and construction projects. Concentrating on the additional work scope as the source that affects design and construction performance, the following section will illustrate a framework that has been designed to show the impact of errors and changes in the design and construction process.
3.4 ERRPR AND CHANGE MANAGEMENT FRAMEWORK
The existence of multiple feedback processes, caused by errors and changes in complex inter-relationships of activities leads us to believe that errors and changes cannot be treated as discrete and constant events because they usually occur as iterative cycles. In other words, one response to an error and change could accompany another response if its unanticipated side
effects are not accounted for and avoided. To address this, this paper presents an analytic framework for error and change management, which can be used to identify the generation and management of iterative cycles caused by error and change. The proposed framework takes a holistic view of the design and construction process, considering all relevant elements continuously. This is distinct from the discrete view of traditional network planning tools that regard all the factors separately. The proposed framework would take a holistic approach, making it possible to draw the big picture of a project so that the interconnection of the components can be identified.
Internal Error Management Framework
Before exploring the project network as a whole, it is important to focus on how error behaves internally within a single activity. As seen in Figure 4, work is performed based on a given work scope during the actual execution of a design and construction project. However, the fact that all work has been performed does not guarantee that the work has been done correctly, and this will be addressed at the quality management process. The term, reliability (A in Figure 4) is used in this framework to indicate the degree to which the performed task has been done correctly during actual execution. For example, if Activity A has 90% reliability, the amount of error in Activity A is expected to be as much as 10% of the total work scope of the activity. However, this estimated reliability can vary due to the impact of a diverse set of variables during the work process. If Activity A is composed of repetitive tasks, the possibility to generate errors could decrease at the later stages as the workers become more familiar with those tasks.
r -- -- -- -- -- --- - - - ") i i
!
~
~.'
I
! ~ \tfjff) i j ~- j I - ~ ~ ~ ! i ~E' eo. I i j - 8:.5 i : Q -< ~ I•
]X
~a!
~~
I
;;~~ i~ :~ :.a
c,=--=::::.:==.:~::=--=:= ..__.~J !~!!
i
i ! i i i i !i
i ! i iI
iiI
iI
i II
I
i I ii
I
i
i
I
i !i
J
[" -- - --..- -- - - 1 I •I)!
I
it
J~
I
I
.,]Ji
U
I
i ;;.f~
I
I
j :~
~
C'-::::::..=::= ..-..-.:-:::;I
i ~$ i j I i !" jI
!
i ! i !,I
!
I
i
i i i i i, i j---,!
i 'iI
:
iI
:I
... ~
',I
5.i 5I
~~~
!I
=~~
I,i,I ~ ~ ~
i E-o~=I
8180
I:'
Ji~ umI
! !
I.~.p.,;''':'.';
f'c::
Y ' .. --- -t-"( '~:....I...•i -- ~~
=:::~
':::===J i ~ ~ ---.-.--- -- .. --- : " .:. 8. ~ I \!l;!I ~ T ! ~ •e
..
?;" ':';~f
i.*'
l'::... L .~~,*,.. ---t-1 ~= e-r--- .~ ·
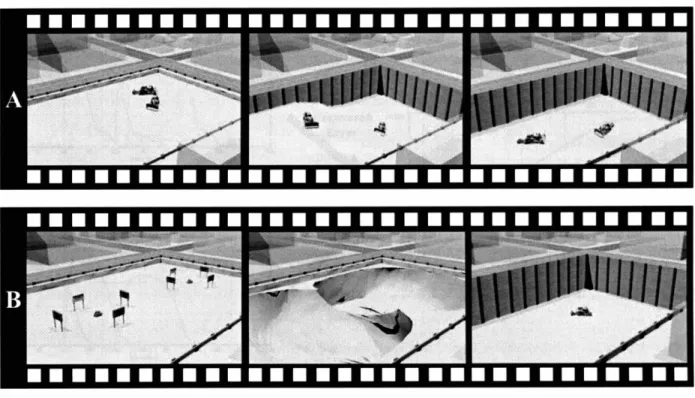
I ,t~ ._._ ... _._ ..__ ... __ .... -'-. ._ ... _ •.J L..__..__.._ ...__..__._._--_..._ ... .__.. ... _Another crucial point is that some portion of the errors generated in the execution of an activity may not be uncovered during the quality management process. Suppose a Waterstop Activity (WA) and a Substructure Activity (SA) are developed concurrently, and waterproof membrane in the WA is not properly installed, as seen in Figure 5. If the problem were discovered immediately, the impact could be manageable even though there is a corresponding cost. However, if the problem is found later, the impact could be more severe. Suppose we find that water is leaking from a wall after the preceding WA is completed, as illustrated in Figure 5. In this case, it is difficult to identify whether the leak is due to a problem with the membrane or a drainage pipe. Removal of the wall may be necessary to identify the root cause, and then, the subcontractor for the preceding WA may need to come back to the site again to fix or replace the membrane. This creates additional activity in the network, derivative activity (A in Figure 5) [Lee et al., 2005], which was discussed earlier. Such a situation, where errors and changes are not identified immediately and thus, become hidden and have a high possibility of re-appeared in a later stage of a project, is called latency. Latency can generate significant impacts on project performance and in the worst case, cause legal disputes due to a liability issue (e.g., in the above example, who is responsible for this problem? It could be a subcontractor of the WA due to his/her initial error in waterproof membrane. It could also be the inspector who approved problematic waterproof membrane).
Drainage Pipe Not properly installed
Waterproof Membrane Delay Discovery
@
Derivative Activity•
ErrorFigure 5. Example of Latency
In order to explain this latency, quality management thoroughness (B in Figure 4) is
introduced in this framework. Quality management thoroughness is defined as a dynamic
variable that represents the degree to which the existing quality problems of an activity have been identified during the quality management process applied to that activity. This is based on the fact that the applied quality management techniques or system may not be executed perfectly or the techniques themselves may not be perfect to start with. For example, if Activity A has 80% quality management thoroughness, 80% of the total errors would be discovered during the
quality management process, and the remaining 20% would be elusive to the quality
management process. Errors that are not uncovered during the quality management process are denoted as hidden errors (D in Figure 4) in the framework, while uncovered errors (C in Figure
4) are those that are discovered. These relationships can be mathematically formulated as
follows:
n Eu = Et x 1I (QTk) (2)
k=l
n Eh = Et x (1- QTk) (3) k=1where, Et is total error generation rate, Eu is uncovered error generation rate, Eh is hidden error generation rate, R(t) is reliability in a given activity, QTk is the quality management thoroughness of a particular applied technique k, and n is total number of techniques in the quality management process. The right-side product found in both Eq. (2) and (3) explains the effect of quality management thoroughness on the uncovered and hidden error generation rate. Here, the product is used in order to combine impacts of different techniques because the failure of one of the applied techniques could mean a system failure.
Diverse techniques for quality management can be applied to a particular activity at a given time. They have different abilities to discover errors, depending on various system conditions, which include the users' familiarity with applied QM techniques (QM familiarity), how well the QM techniques are implemented or how adequate they are to be applied to a particular activity (QM implementation), and the impact of the schedule pressure on the implementation of the different QM techniques (schedule pressure on QM). For example, suppose welding is performed in a pipe installation activity, and ultrasonic testing is used as a quality management technique to inspect the welding quality. Though this inspection technique may be accurate and well-implemented (i.e., high QM implementation), an inspector may not have sufficient experience and knowledge to analyze the results from this testing (i.e., low QM
familiarity). Therefore, this low QM familiarity negatively affects the quality management thoroughness. Some portion of the quality problems with the welding may not be uncovered. In addition, if inspectors have more work to inspect than expected and feel the pressure of meeting the schedule, they may make an effort to speed up the progress of the testing activity. Thus, there would be more of a chance that errors could not be uncovered (i.e., high schedule pressure on
QM).
Internal Change Management Framework
In the case of the change management framework, there are two major components as presented in Figure 4. One is the scope management process, which can be explained as the review process necessary to make sure that the given scope of work is the same as the specified one in the drawings and specifications. The other is the claim and change management, which plays a major role in deciding whether a claimed change order should be accepted or rejected.
Change depends on the stability (E in Figure 4) of the given initial scope of an activity. Stability is used in this framework to indicate the degree to which the given work scope would be performed without a request for change. High stability means that only a small number of changes would be expected during the execution of a particular activity, while low stability represents the possibility that a great number of changes would be requested.
However, some potential changes may not be identified during the scope management process (i.e., latency). Changes that are not identified are denoted as latent changes (H in Figure
4) in this framework, while identified changes (G in Figure 4) denote those that are recognized by the project management team. To represent this situation, the concept of thoroughness is applied to the scope management process in a similar way that it was applied earlier to the quality management process. These relationships can be also formulated as follows:
Ct = - S(t) (4)
Ci = Ct x ST (5) CI = Ctx(1-ST) (6)
where, Ct is total change generation rate, Ci is identified change generation rate, Cl is latent change generation rate, S(t) is stability in a given activity, and ST is the scope management thoroughness. Estimating those values follows similar procedures as in the quality management process situation.
Scope management thoroughness (F in Figure 4) is identified by three factors, which are Scope Management (SM) familiarity, completeness of sources, and schedule pressure on SM, respectively. SM familiarity represents users' experience on or familiarity with the change review process, and completeness of sources explains the degree to which sources supporting a change, such as drawings and specifications, are complete and ready for analysis. The more complete the sources, the more opportunity there is to identify changes. Lastly, schedule pressure on SM shows the effect of schedule pressure on the scope management process.
When contrasted with the error management, the change management framework has one more process after the scope management process: the approval of an identified change request, which is determined by a special group in an organizational level (i.e., claim and change
management group). Identified changes are usually approved (approved change, I in Figure 4)
on the basis of their feasibility (K in Figure 4) to the project through the claim and change
management process. For instance, if the identified change is perceived to require a significant
investment or there are other options to replace it, it can be rejected (rejected change, J in Figure 4). If a change is approved, the corresponding additional work scope is introduced to that particular activity. A rejected change may either become a permanently rejected change (L in Figure 4) or it can be designated as a latent change in terms of its potential for reconsideration later in the project (i.e., latent re-evaluation, M in Figure 4).
Suppose that an unexpected site condition triggers a change in the construction method. This change (i.e., identified change) may have been the best way to deal with the different site condition. However, this change had not actually been approved (i.e., rejected change) at that time because it would have increased the budget of the project significantly, and there was a possibility that the original method could handle the differing site condition. Because this rejected change may be brought back to the table, it would not be permanently rejected. But it would instead be reclassified as a latent change. If there is no possibility of reconsideration, the potential change would be permanently removed. This reconsideration process for a rejected change is denoted as latent re-evaluation, and it determines if a rejected change would be adopted as a latent change or a permanently rejected change.
Lastly, a latent change may be re-introduced as a change. Continuing with the above example, suppose the originally planned method didn't work well, so the suggested change in the construction method (i.e., latent change) is brought back to the table. This re-introduction is based on two main factors, criticality and inflexibility (N in Figure 4). Criticality represents the importance of an activity in the network, and inflexibility represents the lack of other alternatives to address this change. Therefore, if the activity is on the critical path and there are no other options to substitute it, this latent change would be re-introduced as a change to be re-evaluated by the claim and change management group.
Overall Internal Error and Change Management Framework
The error and change management framework presented thus far can be integrated into one cohesive framework, since they share an important common feature; the generation of errors and changes means the potential increase of the initial scope. An important point in this scope increase is that the inter-relationships within an activity can amplify the total scope increased by errors and changes. If tasks within an activity (this research assumes that an activity can be divisible into many work units and hereafter, task is used to denote the work unit within an activity) are highly coupled due to physical and procedural constraints, the impact of errors or changes can be much more than the case in which the tasks are independent from each other. For example, if a project has an activity called column foundation that encompasses all the foundations for the columns in a given area, a problem with one of the column foundations does not affect the other column foundations. In such a case, the tasks within the column foundation activity are not highly coupled. However, if a project has an activity called pile foundation
alignment, then an error on the alignment of the first pile may affect the alignment of the remaining piles. In this case, the tasks within the pile foundation alignment are highly coupled. In this context, internal sensitivity (O in Figure 4) is defined as an amplifier variable to capture the degree to which the corresponding tasks are inter-related within an activity [Eppinger, 1997].
Applying internal sensitivity into the overall framework, an uncovered error becomes a
total uncovered error impact (P in Figure 4). This is because total uncovered error impact is the
actual impact on the construction process after combining uncovered error and its impact on other tasks in an activity. This can be extended to total approved change impact (Q in Figure 4) from approved change. On the other hand, internal sensitivity also governs hidden errors and latent changes, creating total hidden error impact (R in Figure 4) from hidden error as well as
total latent change impact (S in Figure 4) from latent change. Though they are not uncovered or
approved, they can have an impact on succeeding tasks, by creating quality problems. Continuing with the example of the piling activity, if misplaced string lines are not discovered immediately, this hidden error may also generate subsequent errors because workers may install piles according to the misplaced string lines.
As denoted by T in Figure 4, the total uncovered error impact and total approved change impact can be combined as the total uncovered error & approved change amplification because their existence has been detected by managers through the normal monitoring process. This total uncovered error & approved change amplification refers to the additional work scope that is ultimately brought about by uncovered errors and approved changes. To address this change of the work scope during actual execution, adjusted scope (U in Figure 4) is denoted as the newly
introduced work scope combined with the initial scope and may consistently change as the activity progresses.
Meanwhile, as denoted by V in Figure 4, hidden errors and latent changes can also be combined to produce the total hidden error & latent change amplification because their existence would not have been detected by managers at this point. This total hidden error & latent change amplification is the unknown work scope increased by hidden errors and latent changes and should be dealt with because a project cannot be completed without correcting hidden errors and addressing latent changes. Non-adjusted scope (W in Figure 4) is used here to address this unknown impact on the work scope and can explain what is called the '90% syndrome', which is often encountered on design and construction projects [Ford and Sterman, 2003]. In other words, late discovery of the non-adjusted scope causes an overflow of work and consequently, could cause a project to suffer from slow progress at the later stages. Moreover, this slow progress at the later stages may increase the pressure on the project manager and influence him/her to accelerate the planned quality and scope management process in order to speed up the delay. However, this rush could generate other errors and changes. X and Y in Figure 4 illustrate how the non-adjusted scope could deteriorate the reliability and stability of an activity.
External Error and Change Management Framework
The internal error and change management framework can be extended to capture the quality and change management process impacts from one activity to other inter-related activities.
This is enabled by the extension of the concept of sensitivity to the inter-relationship between activities. External sensitivity, as denoted by A in Figure 6, is defined as the degree to which activities are externally inter-dependent on other activities. Therefore, the total uncovered error impact (B in Figure 6) and the total approved change impact (C in Figure 6) in the activity under
study, become, respectively, the total uncovered error amplification (D in Figure 6) and the total approved change amplification (E in Figure 6) of the predecessor and the successor activities by course of the external sensitivity among those activities.
These are combined as the total uncovered error & approved change amplification (F in Figure 6), which is perceived by managers (similar to T in Figure 4). Consequently, these errors and changes would be absorbed in the adjusted scope of each corresponding activity. Similar logic also applies to the total hidden error & latent change amplification (G in Figure 6) in the predecessor and the successor activities with one major difference; this is not easily perceived by managers, which will constitute the problematic non-adjusted scope. Therefore, adjusted scope and non-adjusted scope are defined by these internal and external impacts together. On the other hand, the total uncovered error & approved change amplification (H in Figure 6) and the total hidden error & latent change amplification (I in Figure 6), in the activity under study, are also affected by error and change impact in the predecessor and the successor activities through the corresponding external sensitivity (J in Figure 6).
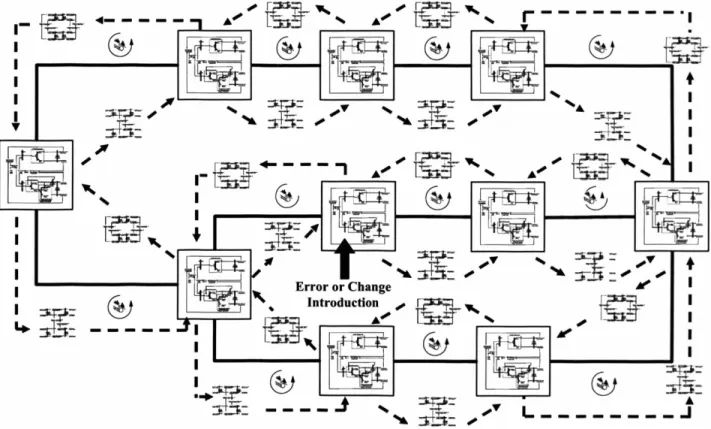
Ultimately, this external quality and change management framework between activities can be extended to the whole network of a project, as seen in Figure 7. Based on the concepts
r - - - --- - ----: @oll .. I ~~ ~c : 1: ~~ : ~~~~
:
r-~~i
$: ~g;< '-": ;J<,0:
.-
> •. ."t:-
. <: I.' Q: '" , '" ~ y y=
00previously presented, error or change introduction at a certain activity may affect the activity
itself as well as adjacent activities through a corresponding sensitivity. In other words, this
process could iterate, in theory, until the end of the project, if external sensitivity impacts exist
among all the activities. Figure 7 shows this propagation effect on the whole network, in
particular, when concurrent design and construction is used in a project.
I-M--I I I I I T I I I I I I=-:9-":r+5:
~---
r---"I " ~Ln~r
+
I I I I IFigure 7. Error and Change Management Propagation Effect on the Whole Network
3.5 PLANNED, PERCEIVED, AND REAL PERFORMANCE
By understanding the process associated with errors and changes, and in particular, by
and changes, it becomes possible to understand how errors and changes affect construction performance.
For that purpose, the schema of Dynamic Design and Construction Project Model
(DI)2CPM), the basic framework used to build the system dynamics simulation model, is proposed tlo illustrate how the project can be understood at systems-level. The D2CPM schema consists of five sub components: the project scope, the project target (e.g., schedule, cost, and quality), the resource acquisition and allocation profile (e.g., labor, equipment, and material), the design and construction process, and the design and construction performance profile, as illustrated in Figure 8 [modified after Ford and Sterman, 1998]. The main idea of this schema is to highlight the role of the design and construction process that bridges the project scope, target, and resource profile with the design and construction performance profile. Envisioning the process as a bridge enables a clear identification of the interaction and mechanics of these five sub components in an uncertain and dynamic environment.
For example, prior to its execution, a design and construction project usually pre-sets its initial scope, resources (e.g., cost, worker, material, and equipment) and target (e.g., deadline and budget limit that should be kept). During actual execution, the actual design and construction process is determined by the interaction of these three inputs. Consequently, this process will generate a corresponding performance profile that reflects the status of design and construction. For instance, if it is not feasible that the planned resource allocation can be accomplished within the scope of the target schedule, the resulting performance would not match the expected inputs. This identified performance during actual execution is called perceived (or monitored)
r - -- -- - -- -- - - - -- - - -- -- - - -- - -
--1;11
~I
th
H
!l 1l~u
"~u
!!
<!
p !lH
lfJ ]I!U
UI~.'.•...•.~.w.<.••.•\..•....
: i ~.1.'.~1~.
---1---1- ---
-1
---.------- --- --I ,---, ,--- --- ---I I 1 I ,I I. I I I I_ !'\~...
CJ,
i
i
! i
~11.j .1
E-- i:: ::&:
! ': I I I I
1 , I I I I
L .:';: :.t ::
performance [adapted from Abdel-Hamid, 1984] and can be different from planned
performance (A in Figure 8). If a gap between planned and perceived performance exists, the
process will reflect the impact of this performance gap on these three inputs (scope, resource, and target). In other words, the three inputs will be adjusted throughout the process because managers would take control actions to meet the planned performance. Suppose the perceived performance is far behind the planned performance due to a delay caused from encountering more solid rock than expected during an excavation activity. In order to overcome this performance gap, several control actions can be made, such as putting more backhoe loaders to work (i.e., changing resource), or deferring the completion of the excavation (i.e., changing the target schedule). If more backhoe loaders are working, the construction process would be executed with a different resource (e.g., increased backhoe loaders). Accordingly, it would generate another performance profile and these interactions might be iterated until the project is completed.
Actually, this iteration would be continued until the realperformance [adapted from Abdel-Hamid, 1984] is identified. Real performance represents what truly happens in a project. This is because perceived performance may not reflect 100% of actual performance. For example, due to the characteristics of construction (e.g., open environment and involvement of many temporary subcontractors), it is difficult to receive accurate performance information. Moreover, even if it is received, an information delay could exist (e.g., information acquired today actually reflects previous week's information). In reality, this difference between perceived and real performance (B in Figure 8) is often disregarded in practice because it has been difficult to measure. But, it has a significant impact on a project. For example, the discussed 90% syndrome,
the sudden overflow of work at a late stage of a project, exemplifies the detrimental impact of the gap between perceived and real performance.
A simple illustration of this would be to suppose we are installing 9 piles, as seen in Figure 9. If performance is measured by the number of completed piles, completing 9 piles would be expected as the output of the process, and this is planned (or expected) performance. However, errors can be generated and uncovered (i.e., uncovered error) and changes can be approved (i.e., approved change) during the process. In this pile installation example, suppose the belief that one of the piles is complete turns out to be erroneous due to a strength failure during the quality management process. In this case, 8 piles were actually completed rather than 9, and this is perceived (or monitored) performance.
On the other hand, errors and changes are not often identified immediately, giving rise to the situation called latency (i.e., hidden errors and latent changes). Continuing with the same pile installation example, suppose one of the piles is erroneous and at this time, it has not identified yet (i.e., hidden error). In this case, even though we perceived that we accomplished 8 piles, real (or actual) performance is the completion of 7 piles.
The gap between perceived performance and real performance has a crucial meaning in managing errors and changes. If there is the gap between planned and perceived performance, which is caused by uncovered errors and approved changes, we will make a decision and take control actions to eliminate this gap. However, the fact that perceived performance may not be same as real performance, which is caused by hidden errors and latent changes, informs us that
this decision making and controlling process may start with incorrect information. Thus, there is strong possibility that decisions intended to solve errors and changes rather would generate unexpected side effects, thereby disrupting construction severely. This is due to latency.
e.g.) Pile Installation Planned Performance (9 piles)
-.---+---~--.0- - -- --Q. - - -- - 0- -~---~---~-Perceived Performance (8 piles) Uncovered Error-Z~~~~~~t~~~~~t~
-~- _u --~ -- --- <P-Real Performance (7 piles)~1~~~~~~!~~~~~:~
-~---~---~ Hidden ErrorFigure 9. Planned, Perceived, and Real Performance at Pile Installation Example
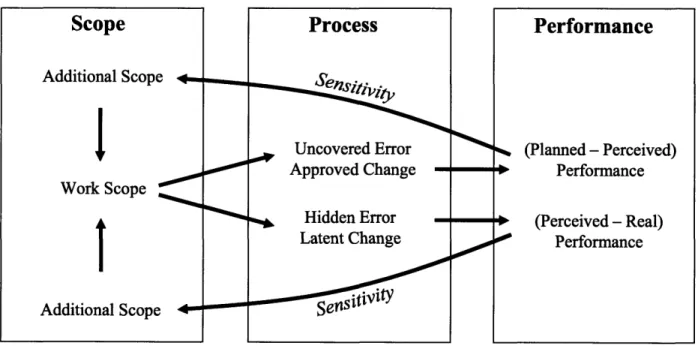
This detrimental impact of latency becomes more severe when sensitivity is considered. Figure 10 illustrates a modified and simplified D2CPM schema to explain the impact of errors
and changes on performance and scope. If there is a gap between planned and perceived
performance, managers take some control actions in an attempt to reduce this gap, which usually are accompanied by an increase of scope. Continuing with the pile installation example, we may need to remove the existing erroneous pile and to install a new one. Thus, removing and installing a pile contribute to additional scope.
On the other hand, in the latency case, succeeding tasks, such as installing a column, could be already completed. If the hidden error is discovered after installing the column, the column may need to be removed before the erroneous pile and followed by installation of a new pile and column. This creates increased additional work compared to the first case. The increase of scope during actual execution is one of the main drivers of project disruption because most plans are
based on the estimated scope. For example, assume we are going to prepare workers and resources based on the scope of this pile installation, installing 9 piles. In order to deal with additional scope, we need to procure more workers and resources. Furthermore, the schedule extension may not be allowed for this corrective work because keeping the schedule is a primary objective in most projects. Thus, more resources tend to be assigned at a late stage of the project, such as adopting overtime and hiring new workers. However, it is well known that this late assignment does not increase productivity [Sterman, 1992]. In summary, when latency and sensitivity are taken into account together, construction becomes seriously disrupted due to unexpected increases in the scope during execution and this understanding is enabled by the
D2CPM schema.
2
Figure 10. Application of the D2CPM Schema
Scope Additional Scope Work Scope Additional Scope
Process
W
Uncovered Error Approved Change -% , Hidden Error Latent Change SenPerformance
% (Planned- Perceived) Performance (Perceived- Real) Performance0-0
CHAPTER 4
RELIABILITY AND STABILITY
SCHEDULE BUFFERING
Based on the understanding of errors and changes attained from the framework, this chapter discusses the impact of errors and changes can be mitigated or absorbed. In the previous chapter, the author explained that errors and changes can have a harmful effect on project performance, most often producing a ripple effect among the different activities needed to accomplish more additional work than expected. Furthermore, when concurrent design and construction is applied, often succeeding activities have to proceed without complete information from preceding activities and this can lead to a chain of suboptimal or erroneous decisions affecting other related activities.
One method that is able to control these unanticipated effects of errors and changes is the deliberate utilization of buffers in the design and construction schedule (i.e., schedule buffer). Buffers provide a method to accommodate uncertain and variable conditions by absorbing perturbations and problems [Sakamoto et al, 2002]. However, buffers in design and construction have been mainly used as a contingency, such as adding certain percentage of the activity durations at the end of an activity without an appropriate analysis of the individual characteristics
of the activity. As a result, buffers often fail to protect schedule performance despite their potential to overcome uncertainty.
Taking these issues into account, this dissertation presents a reliability and stability buffering approach that extends Park and Pefia-Mora's reliability buffering (2004). It further extends to account not only with error issues (i.e., reliability) but also change issues (i.e., stability), especially in concurrent design and construction. In addition, dealing with latency is seriously considered. This reliability and stability buffering approach aims to build a robust design and construction plan against uncertainties, focusing on the detrimental impacts of errors and changes, when concurrent design and construction is used. The presented buffering approach adopts a proactive and flexible buffer location: a systemic buffer size based on activity characteristics; and a dynamic update mechanism, to vary location and size, in order to maximize its benefit. Prior to describing the proposed buffering approach, how buffers have been utilized in design and construction are discussed.
4.1 JUST-IN-TIME VS. JUST-IN-CASE
Planners in construction companies do not typically discuss the deliberate insertion of buffers in their schedules to manage their programs [Horman et al, 2003]. One of the reasons is that buffers do not directly add value and are considered a waste. This viewpoint has been strongly supported in Just-In-Time (JIT) literature [Womack and Jones, 1996]. JIT emphasizes the importance of a smooth workflow of execution, such as minimizing inventory and synchronizing the production
rate. Concurrent with this viewpoint, it is believed that buffers could impede a smooth workflow of execution by maintaining a redundant capacity without value adding.
However, there has been recent research in the area of supply management which emphasizes the role of a redundant capacity to reduce significant risks, which is known as Just-In-Case (JIC) []Brown, 2003]. JIC highlights the need for preparedness against uncertain business environments and thus, buffers are strongly advocated. In other words, if uncertainty is inevitable in business, preparing a redundant capacity could avoid a worse situation; even though, it could be more costly. Ultimately, it is believed that the cost to keep the redundancy would be less than the disastrous case that could result from no preparedness.
If all activities in a project are predictable and follow a planned performance, JIT without buffers would be the best solution in terms of a speedy and efficient execution of design and construction projects. However, if uncertainty is inevitable, JIC with buffers is the best alternative for a JIT delivery by providing the capacity needed to maintain a smooth workflow of execution. Therefore, JIC with buffers should be viewed as an approach that is taken to incorporate the main idea of JIT, not to replace it, by pursuing a speedy and efficient execution. Even in JIT literature, there has been arguments that advocate the potential benefit of a redundant capacity, and particularly; the usage of buffers, in order to absorb perturbations caused by uncertainty in construction [Howell et al, 1993; Ballard and Howell, 1995; Alarc6n and Ashley; 1999, Tommelein and Weissenberger, 1999; Sakamoto et al, 2002]. Thus, buffers could play a
![Figure 14. Example of Production Type [Adapted from Eppinger, 1997 as referred by Peiia- Peiia-Mora and Li, 2001] and Their Impact on Buffer Size](https://thumb-eu.123doks.com/thumbv2/123doknet/14754356.581771/56.918.104.797.205.520/figure-example-production-adapted-eppinger-referred-impact-buffer.webp)
![Figure 27. Work Execution with Error Management [adapted from Pugh-Roberts Associates, 1980; Ford and Sterman, 1998; Park and Pefia-Mora, 2003]](https://thumb-eu.123doks.com/thumbv2/123doknet/14754356.581771/84.918.116.788.245.558/figure-execution-error-management-adapted-roberts-associates-sterman.webp)