Dynamic Quality and Change Management
For Large Scale Concurrent Design and Construction Projects
by
Sang Hyun Lee
B.E., Architectural Engineering, Dong-A University, 2000
Submitted to the Department of Civil and Environmental Engineering in
Partial Fulfillment of the Requirements
for the Degree of
Master of Science in Civil and Environmental Engineering
at the
Massachusetts Institute of Technology
June 2003
©
2003 Massachusetts Institute of Technology
All rights reserved
MASSACHUSETTS INSTITUTE
OF TECHNOLOGY
JUN 0 2 2003
LIBRARIES
Signature of Author ...
...
Department of Civil and Environmental Engineering
May 9, 2003
C ertified by ...
Leerlosky Pefia-Mora
Associate Professor of Civil and Environmental Engineering
I Thesis Supervisor
Accepted by ...
Oral Buyukozturk
Chairman, Departmental 'Committee on Graduate Studies
Dynamic Quality and Change Management
For Large Scale Concurrent Design and Construction Projects
bySang Hyun Lee
Submitted to the Department of Civil and Environmental Engineering on May 9, 2003 in Partial Fulfillment of the
Requirements for the Degree of Master of Science
ABSTRACT
Though concurrent design and construction has been lauded for reducing the time of the total processes, such an approach may make projects more uncertain and complex than those where a sequential design and construction process is used. The main sources of risk are iterative cycles that result from errors and changes introduced during the execution of concurrent design and construction. Such cycles create subsequent impacts on the project performance. In addition, traditional network scheduling tools are not adequate to deal with problems encountered during concurrent design and construction because they consider the project only as a combination of discrete activities and ignore dynamic interactions between different activities. In this context, Dynamic Planning and control Methodology (DPM), a simulation-based planning and control tool, was developed to help prepare a robust construction plan that would avoid these uncertainties.
However, DPM focuses only on iterative cycles caused by quality problems in construction, and it lacks the capability to deal with change cycles. In order to address this issue, this paper proposes a framework for quality and change management and a new generation of DPM based on this framework. The new DPM incorporates the traditional network tools and buffering strategies into system dynamics simulation models and aims to capture iterative cycles and their impact on design and construction performance in advance. Generated policy guidelines and analysis by the new DPM show comprehensive project profiles and help avoid unnecessary redundant subsequent actions. In addition, uncertainties of complex concurrent projects can be reduced by the buffering strategy of the new DPM. Finally, a case study of a bridge project demonstrates that DPM can help prepare robust and systemic planning for concurrent design and construction in the real world setting, and DPM allows managers or site engineers to analyze the unpredictable incidents that may occur during concurrent design and construction and to anticipate their impacts on project performance.
Thesis Supervisor: Feniosky Pefia-Mora
ACKNOWLEDGEMENT
First, I would like to thank Professor Pefia-Mora for his continual guidance and support for this research and my family. Working with him is the most valuable and exciting experience in my MIT life and I believe our relationship has something beyond just research matters. As he has been my supporter and mentor, I hope that I would be his proud student and great friend throughout our continuous research and life.
Technically, I would like to acknowledge the contribution to this paper by Joe Peck, Corporate Planning and Scheduling Manager, Bill Lemoine, Vice President, and John Foster, Senior Project Manager at Modern Continental Co., Philip Helmes, Vice President, and Margaret Fulenwider, Senior Consultant at InteCap Inc., Dr. Mikio Shoji, Senior Managing Director at Kajima Corporation, and the financial support for this research received from InteCap Inc., Kajima Corporation, the National Science Foundation CAREER Award, and the White House PECASE Award CMS-9875557.
My gratitude goes to my friends in Korea and US. Sharing my small achievement with them is the
unforgettable moment to me. I am very happy to have friends like you to share my personal feelings. In particular, I would like to show my thanks to MoonSeo Park, the former graduate student at IESL and professor at NUS, and his family, having the pleasant memory with them in US and Singapore.
I am thankful to my family for their love and understanding. Though we are live separately on the
opposite side of the globe, they have been a constant source of encouragement during my studies at MIT. Finally, I would like to share this moment with my lovely wife, JungSook. Without her love and care, this moment would not have been a reality. I remember every moment with her and believe that these are the most valuable property throughout my life.
TABLE of CONTENTS
CHAPTER 1 INTRODU CTION ... 7
CHAPTER 2 RESEARCH M ETH ODOLO GY ... 9
CHAPTER 3 FUNDAM ENTALS OF DPM ... 11
3.1 USER-DEFINED M ODELING APPROACH ... 11
3.2 CONSIDERATION OF FEEDBACKS ... 12
3.3 CAPTURING CONSTRUCTION DYNAMICS... 12
3.4 REDEUCING SENSITIVITY TO CHANGES... 13
CHAPTER 4 FEEDBACK PROCESSES BY ERRORS AND CHANGES ... 15
4.1 DEFINITION OF ERROR AND CHANGE ... 17
4.2 CAUSES FOR ERROR AND CHANGE... 17
4.3 ERROR AND CHANGE IMPACT PATTERNS... ... 18
4.4 DERIVATIVE ACTIVITY ... 20
CHAPTER 5 QUALITY AND CHANGE MANAGEMENT MECHANISM... 22
5.1 INTERNAL QUALITY AND CHANGE M ANAGEMENT M ECHANISM ... 22
5.2 W ORK M ULTIPLIERS... 27
5.3 IMPACT OF ADJUSTED SCOPE AND NOT ADJUSTED SCOPE... 28
5.4 EXTERNAL QUALITY AND CHANGE MANAGEMENT MECHANISM... 30
CHAPTER 6 PERFORM ANCE ... 33
CHAPTER 7 DYNAM IC PROJECT M ODEL... 35
7.1 ISSUES ON SYSTEM DYNAMICS M ODELING... 35
7.2 GENERIC PROCESS M ODEL ... 36
7.3 SCHEMAN OF THE DYNAMIC PROJECT M ODEL... 40
CHAPTER 8 THE EFFECT OF RELIABILITY AND STABILITY BUFFERING ... 40
8.1 RELIABILITY AND STABILITY BUFFER SPLIT ... 41
8.2 THE EFFECT OF RELIABILITY AND STABILITY BUFFERING... 42
8.3 THE VALIDATION OF RELIABILITY AND STABILITY BUFFER ... 44
8.4 SCHEDULE UPDATE BY RELIABILITY AND STABILITY BUFFERIING... 48
CHAPTER 9 THE IMPLEMENTATION OF DPM... 50
9.1 SYSTEM OVERVIEW ... 50
9.2 COLLABORATION SCHEME... 53
CH APTER 10 A CASE STUDY ... 56
CHAPTER 11 CO NCLUSION ... 59
11.1 POTENTIAL IMPACT ... 60
11.2 FURTHER W ORK ... 60
LIST of FIGURES
FIGURE 1: EXAMPLE OF DEPENDENCIES [FORD & STERMAN, 1997]... 12
FIGURE 2: FEEDBACK PROCESSES THROUGHOUT THE ACTUAL EXECUTION [MODIFIED FROM MOONSEO PARK, 2000] ... 16
FIGURE 3: IM PACT OF LATE D ISCOVERY ... 21
FIGURE 4: INTERNAL QUALITY AND CHANGE MANAGEMENT PROCESS ... 25
FIGURE 5: FEEDBACK PROCESSES ON QUALITY AND CHANGE MANAGEMENT PROCESS ... 29
FIGURE 6: EXTERNAL QUALITY & CHANGE MANAGEMENT To PREDECESSOR AND SUCCESSOR ACTIVITIES ... 30
FIGURE 7: EXTERNAL QUALITY & CHANGE MANAGEMENT IMPACT FROM PREDECESSOR AND SUCCESSOR ... A CTIV IT IES ... 3 1 FIGURE 8: QUALITY AND CHANGE MANAGEMENT PROPAGATION EFFECT ON THE WHOLE NETWORK ... 32
FIGURE 9: PERCEIVED VS. REAL PERFORMANCE ... 34
FIGURE 10: GENERIC PROCESS MODEL WITH QUALITY MANAGEMENT PROCESS AT THE EXISTING PROJECT MODEL [ADOPTED FROM FORD & STERMAN, 1997; MOONSEO PARK, 2000; LENEIS ET AL, 2001]... 36
FIGURE 11: GENERIC PROCESS MODEL AND EQUATIONS [ADOPTED FROM MOONSEO PARK, 2000]... 37
FIGURE 12: EQUATION AND BEHAVIOR OF EXTENDED GENERIC DPM PROCESS MODEL ... 39
FIGURE 13: SCHEMA OF DYNAMIC PROJECT MODEL [MODIFIED FROM FORD & STERMAN, 1998]... 40
FIGURE 14: RELIABILITY AND STABILITY BUFFER SPLIT ... 42
FIGURE 15: THE EFFECT OF RELIABILITY AND STABILITY BUFFERING ... 43
FIGURE 16: SIMULATION RESULT OF No BUFFERING AND BUFFERING... 46
FIGURE 17: FAST AND SLOW PRODUCTION TYPE... 47
FIGURE 18: SCHEDULE UPDATE BY RELIABILITY AND STABILITY BUFFERING ... 49
FIGURE 19: DPM INTEGRATED COMPONENTS [EXTENDED FROM MOONSEO PARK, 2000] ... 51
FIG URE 20: SM ART C ELL ... 52
FIGURE 21: COLLABORATION SCHEME WITH SAME VIEW ... 53
FIGURE 22: DPM SYSTEM ARCHITECTURE... 54
FIGURE 23: PROJECT PROFILES THROUGH JAVA APPLET ... 55
LIST of TABLES
TABLE 1: KEY VARIABLES WHICH AFFECT ERRORS AND CHANGES ... 17
TABLE 2: ExAMPLE OF ERROR AND CHANGE IMPACT PATTERNS IN CONSTRUCTION [AUGMENTED FROM MOONSEO P A R K , 2000 ] ... 19
TABLE 3: MODEL SETTING AND SIMULATION RESULT ... 45
TABLE 4: SECOND BUFFER VS. PRODUCTION TYPE... 48
CHAPTER 1
INTRODUCTION
Nowadays, concurrent design and construction is gaining popularity in the industry due to the increased demand for faster development time. However, despite the promise of speed, increased uncertainties and complexities in concurrent design and construction can make a project more difficult than ever to handle. Although traditional tools have been the most popular planning mechanisms used in construction projects, they are not sufficient to represent what really happens during concurrent design and construction. They have a discrete view, decomposing the project into activities that can have only individual relationships with adjacent activities. In addition, the impact of iterative cycles caused by errors and changes is not addressed by traditional tools. In particular, when construction is performed concurrently, the effectiveness of the traditional network-based tools needs to be questioned, since there are more possibilities of introducing iterative cycles in the concurrent design and construction process. In this context, a dynamic approach, which can deal with the uncertainty of the concurrent design and construction process, has emerged as an alternative to the traditional network-based tools. In an effort to meet this industry need, the Dynamic Planning and control Methodology (DPM) was developed. DPM aims to help prepare a robust construction plan against uncertainties and provides policy guidelines for unexpected events during actual execution by supplementing the network-based tools with system dynamics and reliability buffering [Park and Pefia-Mora, 2002]. However, since DPM in its original version focused only on the quality aspect of construction performance, it lacks the capability to address change iterations caused by other factors, such as external requests and uncontrollable issues. Moreover, changes and consequent conflicts are very common to concurrent design and construction projects and
can substantially increase the duration and total cost [Ibbs, 1997]. In addition, in its original version of DPM did not emphasize identifying construction changes in a timely manner to minimize possible conflicts in the project management. These issues heavily support the need for an extension of the capabilities of the original DPM.
As an extension of DPM, this paper presents a framework to explain the way in which quality and change management more adequately address problems in real-world concurrent design and construction projects. The quality and change management framework will be useful in identifying the dynamic behavior of concurrent design and construction processes and in helping to prepare a more effective construction plan by analyzing iterative error and change cycles and their impacts. Based on these identified impacts of iterative cycles, reliability and stability buffering is enhanced as a mechanism to reduce sensitivity to their impacts in concurrent design and construction. Finally, a web-based system, which incorporates these components, is developed to assist diverse interdisciplinary parties, in particular, in geographically distributed complex projects.
CHAPTER 2
RESEARCH METHODOLOGY
To provide a systemic approach to managing uncertainties and complexities in concurrent design and construction, system dynamics and the overlapping framework for construction projects are adopted by the quality and change management framework and DPM.
System Dynamics was developed to apply control theory to the analysis of industrial systems in the late 1950's [Richardson, 1985]. In this research, system dynamics is adopted to acquire the realities of dynamic complexities and feedback processes in the actual construction with its powerful analytical capability and simulation ability. System dynamics has been applied to many complex industrial, economic, social, and environmental systems of all kinds [Turek, 1995]. However, having realities based on system dynamics may lack the applicability and flexibility to be applied to diverse projects. On the other hand, the traditional network-based tools have demonstrated their applicability and flexibility, serving various projects without much resistance, though they have difficulty handling dynamic complexities in a real project. In that sense, DPM incorporates them into the system dynamics models to enhance its applicability and flexibility for ease of use.
In addition, the overlapping framework for construction [Pefia-Mora and Li, 2001] is used and extended to analyze the activity characteristics to provide insight into the actual processes in concurrent design and construction. Their overlapping framework focuses on the transfer of physical production
units between overlapped activities by applying concurrent engineering to the construction field. Basic idea of the overlapping framework is that overlapping practices should vary depending on the characteristics of construction activities, which includes activity production rate, production reliability in the predecessor activity, and sensitivity in the successor activity as key characteristics [Pefia-Mora and Li, 2001]. Based on this framework, our research explores the way to represent iterative cycles and their impact on the performance during construction.
CHAPTER 3
FUNDAMENTALS OF DPM
The previous DPM had been developed as integrated methodology to handle dynamic behavior of complex construction projects. Construction projects are inherently dynamic and complex involving multiple feedback processes and non-linear relationships [Sterman, 1992]. These features make construction projects uncertain and consequently, they can generate schedule delay and cost overrun. To effectively handle these challenging issues, several concepts and logic of DPM have been derived from closer observations of construction processes in order to provide an integrated methodology [Park and Pelia-Mora, 2002]. In this section, fundamentals of DPM are briefly introduced.
3.1. User-defined Modeling Approach
Although simulation-based planning tools provide effective handling for dynamic complexities, they have been limited to a specific set of activities on a project. To extend the applicability of simulation-based tool, DPM aims to provide a general pre-structured model and parameters that are common to all
3.2. Consideration of Feedbacks
DPM focuses on capturing the feedback processes in construction projects that make projects dynamic and uncertain and cannot be captured in the traditional network-based planning tools. For example, when a control action is taken to reduce variations from a planned performance, the action can fix the problems but at the same time its side effects can deteriorate the project performance. DPM aims to capture these kinds of feedback that are caused by human response to control actions.
3.3. Capturing Construction Dynamics
DPM considers change as an iteration trigger not just a result, so already made changes can be the source of subsequent changes in either concurrent, succeeding or preceding activities. For example, changes in design work that have been made by mistake can cause subsequent changes in construction if the error is not identified before construction starts. In this case, the design changes are a result to the designer, while they can be a need for changes to the construction crew. On the other hand, as main constraints to the construction progress, dependencies involved in processes are identified and modeled in detail. External dependency captures the dependency between activities in a way similar to the precedence relationship in network tools [Ford and Sterman, 1997]. However, external dependency deals with the relationship during the whole activity duration, while the precedence relationship only refers to
the start and finish of activity. For example, if the successor activity is scheduled to start at 50%
completion of the predecessor activity and the successor activity can proceed in proportion to the progress of the predecessor activity, external dependency can be represented as the left-side of Figure 1.
Example of External Dependency Example of Internal Dependency
1- L..-.J_.L - - - -- -.-L_....- -- - -I-1 Ir I - - - -I a 0 CA - -,I1--- -- -- i II4----44--- II II In 1 0
~~~
-, b ---- r -I 0Progress of 0 Work ProgressOn the other hand, internal dependency aims to capture procedural or physical constraints within an activity, which is not addressed by traditional network tools. For example, in the right-side of Figure 1, available work within activity can proceed in proportion to work progress due to certain constraints till 75% completion and, after then, it can proceed freely without the restriction from work progress. Those two dependencies are adopted in order to represent inter and intra relationships of activities.
3.4. Reducing Sensitivity to Changes
To decrease non-value adding iterations through reducing sensitivity of the design and construction process to unintended changes, DPM provides an appropriately pooled, located, characterized and sized reliability buffer. Usually, the traditional contingency buffer in construction planning is used to guarantee the completion time either of an activity or a project. In usual practice, it is positioned uniformly at the end of the activity duration having some more time. However, it tends to be used as part of an activity without clear distinction from the original duration. As a result, time added to the original duration may not effectively protect the planned schedule because when people realize that they have more time to complete a task than the time known, their work productivity usually goes down [Sterman, 2000]. It can also be explained by the Parkinson's law [Parkinson, 1957] that the work expands to fill the time available for its completion.
In contrast to the traditional contingency buffer, Park and Pefia-Mora [2001]'s research argues that reliability buffer can systemically protect the whole project schedule from being disrupted by failures in individual activities. Reliability buffering first attempts to take off contingency buffers from individual activities when there exists contingency buffer, and makes each activity benefit from appropriate schedule pressure. Excessive schedule pressure may deteriorate workers' productivity. However, appropriate and well managed schedule pressure can increase their productivity [Sterman, 2000]. This fact is derived from not only the physiological and psychological effects but also logistical considerations. Suppose that Activity A has 10 days to finish it. But, due to the urgent request from the owner, the duration of Activity
A is reduced as 8 days. The project manager explained this situation and announced it as a 'crisis' for the
project. In that case, construction crews would not resist this shortened duration and try to keep the reduced schedule, even though overtime is applied. They would put off their personal activities for that period with tolerance, though they may be tired. In that case, construction crews' productivity is increased comparing to the planned productivity, when we measures it as work accomplished per hour of effort. However, if Activity A has a longer duration like 50 days and required to finish within 40 days, crews
would start to resist this request after some time because of their fatigue from declining health, lack of a social life, and even family problem. Studies of the construction industry and other manual labor contexts indicate that long work hours begin to reduce productivity after a week or two, with the full effect requiring somewhat longer [Oliva, 1996].
After taking off contingency buffers from individual activities, the reliability buffer is positioned at the beginning of activities, rather than the end of activity in the traditional contingency buffer. These different logistics can handle ill-defined tasks by introducing a pre-checking process having time to capture and correct predecessors' hidden errors before being performed in unknown state. Meanwhile, the size of buffer needs to be varied depending on construction characteristics. The degree of overlapping between activities should be decided in a way that enough time to discover and fix problems made in the predecessor activity can be secured before the successor activity starts [Pefia-Mora and Li, 2001]. Following this argument, the size of buffer is determined by appropriate simulation using activity characteristics and project control policies. In addition, the size and the location of the buffer are continuously updated in order to handle changing construction performance, which results from the updated information on construction system characteristics.
CHAPTER 4
FEEDBACK PROCESSES BY ERRORS
AND CHANGES
Construction projects are inherently complex and dynamic, involving multiple feedback processes [Sterman, 1992]. The uncertainty and complexity of projects results mainly from these feedback processes in design and construction. Feedback processes can be represented as the simultaneity of the positive and negative effects of decisions. In other words, the decision to handle a problem that arises can have a positive effect, fixing the problem itself but, at the same time, it can have another side effect, one that may generate other unintended problems.
One of the main sources for these feedback processes is the gap between the planned work scope and the actual work scope, due to errors and changes. In other words, the work scope is usually increased as a result of the discovery of errors and the request for changes throughout the actual execution. To deal with this increase in the work scope as well as to keep the schedule as planned, the manager may take appropriate control actions such as adding more resources (ex. material, equipment, workforce, and etc.), or adopting overtime. Many other control actions can be taken in order to reduce this gap of work scope. These solutions for the confronted problem, however, may generate unintended negative side effects on the project performance, such as the decrease of productivity and quality. For example, although the adoption of overtime may handle the increased amount of the work being performed, the extended work
hours may increase the workforce's fatigue. Ultimately, accumulated fatigue could worsen productivity and quality of work and would slow the project progress down as more errors and changes are introduced. This explains why errors and changes are iterative and make the project uncertain and complex by producing side effects from control actions that have been taken, as seen in Figure 2.
Negative side effects caused by errors and changes become more hazardous when fast-tracking and concurrent engineering techniques are applied. Projects applying both techniques could be more uncertain and complex due to the lack of finalized information about predecessor activities and the complex inter-relationships of activities than traditional sequential development [Lee et al, 2003].
Therefore, the understanding of error and change and its iterative impact is a key to reduce multiple feedback processes, particularly, in concurrent design and construction. On the following pages, as a foundation for the proposed framework, we discuss the ways in which error and change are generated and are represented in the actual construction processes.
Plan Execution Error & Change Reinforcing Balancing - Generate other
Ressolve the issues
problems Monitor
Control Actions
Figure 2. Feedback Processes throughout the Actual Execution [Modified from MoonSeo Park, 2000]
4.1. Definition of Error and Change
Most iterative cycles in design and construction are triggered by errors and changes. Error is defined as defective work of poor quality, such as the placement of piling in the wrong location or poor concrete performance; change is defined as any work required of the contractor or subcontractor that was not specified in the original contract document [Trauner, 1992]. An example of this would be the owner's request to change the building's purpose as from a usual office space to a library facility.
4.2. Causes for Error and Change
In the actual execution, errors and changes are not generated in a constant or predictable way. Their generation depends on non-linear relationships with several variables which are time-dependent and
highly interactive. One such non-linear relationship is with the workers' learning curve of the applied
technology or method. In the learning process, it usually takes a considerable amount of time to be proficient during the initial stages and there would be no notable improvement during the later stages. In other words, the proficiency caused by the learning process usually follows 'S' shape curve. Therefore, it can be said that errors have more possibility of being generated in these initial stages than the later stages in terms of workers' learning curve.
Table 1. Key Variables which Affect Errors and Changes
Among many potential variables, Table 1 summarizes key variables which might affect errors and changes and their characteristics in terms of controllability during the actual execution. In the case of errors, most variables can be managed and controlled. For example, hiring experts or holding workshops of the adopted construction technology could increase worker's skillfulness and boost learning curve in its initial stages. At the same time, however, there are some uncontrollable variables which are related to policy and environmental reliability. For example of the policy reliability, the adoption of unproven
Key Variables Controllability
Policy, Environmental Reliability Uncontrollable
Error Worker's Experience, Schedule Pressure,
Controllable Learning Curve
Political, Social, Environmental Stability, Uncontrollable
Change External Change Request
Information & Resource Availabillity, Controllable
process, technology, or material by the decisions of high-level management team, could include the inherent problems which would generate errors during the actual execution. In addition, the bad weather, as an example of the environmental reliability, could affect the concrete curing performance. In these examples, errors may be hard to be managed and controlled by the project level decision.
On the other hand, in the case of changes, political, social, and environmental stability which affect the change generated are not controllable and they are beyond the project level. External change requests
by the owner and high-level management team are also uncontrollable. However, other change requests
caused by information and resource unavailability, different conditions, and lack of action can be controlled by the appropriate processes on the project level. For example, close investigation of the site throughout precise methods could improve the accuracy of the information about site conditions and consequently reduce the potential changes. Meanwhile, there may be certain changes that don't require direct cost and consequent tasks, and this phenomenon is denoted as lack of action. One such example is late inspection by a third party who has a direct contract with owner. If he/she performs inspection two days later than stated date in the specification, it generates two day schedule delay. Though it does not drive up any cost or require unplanned additional tasks to catch up with usual change cases, it can be categorized as a change based on the above definition [Trauner, 1992]. This kind of change is common in design and construction projects due to a significant amount of interactions among related parties.
4.3. Error and Change Impact Patterns
Among many possible ways to classify error and change impact patterns on construction, this paper focuses on their impacts on the work scope in order to quantify how much they generate additional unplanned works. As mentioned earlier, the increased work scope mainly caused by errors and changes is the source of feedback processes. Therefore, identifying how errors and change influences on the work scope can help to capture and reduce feedback processes.
Error and change impacts can have three different patterns, rework, scope substitution, and extra work, during construction processes as illustrated in Table 2. The first pattern is the rework of an activity required for it to achieve the planned goal, and its target is the problematic task or the issued task. In other words, it is to work again on the problematic or the issued task. Therefore, the work amount of rework is the same as the original work. For example, if the location of piles is different from the original plan, one possible reaction is to add piles on the planned location, keeping previous piles. Or piles can be added
after removing previous piles. In the case of change, as illustrated in Table 2, assuming that change is requested to increase the structure capacity of piles to bear more load than planned, adding more piles can be a way to accommodate the change request.
The second one is the scope substitution on the project. It does not require any unplanned additional work, but substitutes the kind of work to be performed. Therefore, it does not generate any additional work amount. In the case of above wrong location of piles, manager can decide to change the subsequent works in order to keep the previous work. Due to the change of pile location, subsequent column and floor installation can be different from the original plan, but there is no need for additional works in succeeding activities.
Finally, the third on is the extra work. It is generated to supplement error or change and requires performing unplanned additional work in the other tasks or activities. Extra work is usually preferred to rework in the construction because construction rework is normally accompanied with the demolition of what has already been built [Park and Pelia-Mora, 2003] and direct additional work amount is usually less than rework. As a result, construction managers tend to avoid rework on problematic tasks by adopting extra work modifying their design and specification. Therefore, the work amount can be represented as less than the possible rework and more than scope substitution.
Table 2. Example of Error and Change Impact Patterns in Construction [Augmented from MoonSeo Park, 2000]
Planned Error or Change Error or Change Impact Patterns in Construction
Performance Generation Rework
Scope Substitution Extra Work
Error Case
Exml Adding
Piling Error Generation: To keep work so far,
Piling is not located as planned Tis achieeplanned goal. are added to Column position is unpla can vers are
chgd. installed.
Change Request & Adding
Approval: I r
Change Case "Increase the structure
--capacity of piles to bear
Example more load, since heavier
equie ont is g tc re Additional piles are
The size of columns Is To keep work so far, added. changed.laned.
avr or change gencrnlion Object: Activity A Object: Activity B Object: Activity B
Gantt Chart _ __ _ dela
Denotation
A: Piling B: Structure
However, in general, error and change impact pattern is not issued individually. In the above piling example, if the scope substitution is adopted for a wrong pile location, columns could not handle the planned area as expected. Therefore, additional cantilever work could be added to the successor activity to structurally cover the planned area as illustrated in Table 2, and it is extra work. This phenomenon can be interpreted as iterative cycle because the later extra work is apparently caused by the former scope substitution based on the relationships with each other, rather than being occurred individually. This is also applied to the above change case. Additional columns can be installed as the extra work in order to incorporate the change of the piling activity, and even the size of column can be enlarged to accommodate the increased bearing capacity as the scope substitution.
Therefore, in order to capture total impact of error and change, each direct error and change impact pattern is identified as seen earlier, for example, A causes B as rework and B causes C as extra work. And then the corresponding quantification is applied to get the quantity of each sequence and finally, total impacts of error and change are acquired by the sum of total sequence.
4.4. Derivative Activity
Error and change impacts on the construction performance vary depending on several factors such as an activity own characteristics and its relationships with other activities [Park and Pefia-Mora, 2001]. However, the serious impact of error and change usually occurs when they are discovered at the later stages. For example, if error and change in the predecessor activity are found and immediately adopted in the predecessor activity, the possible reaction is executing that task again or executing additional work to accommodate the generated error or change. Therefore, their impact on the successor activity may not be very significant because the successor activity can have time to adopt them.
However, if error and change in the predecessor activity are discovered at the successor activity, its impact on performance requires careful attention due to the subsequent impacts of already performed work. Errors and changes that are not immediately discovered and approved after their generation are main sources that make the project uncertain and complex because they usually cause sudden work overflow at late stages of the project, which is called 'the last minute syndrome' [Lee et al, 2003].
In this case, two cases are possible in concurrent engineering as illustrated in Figure 3. One of them is that error or change in the predecessor activity is found before the predecessor activity finishes. In this
case, the successor activity can request correction or adoption of the error or change during the execution of the predecessor activity. Due to the work re-executed on the predecessor activity, the successor activity can be delayed before the work in the predecessor activity is completed again. In addition, the predecessor and the successor activity may do more work to correct already completed work because of their inter-relationships such as physical and procedural constraints. The other case is after the predecessor activity finishes. If the only way to deal with error or change in the predecessor activity is to work again throughout the predecessor activity, its impact is more significant than the previous case, because workers and equipments in the predecessor activity were already withdrawn. In addition, if the predecessor and the successor activity are performed by different subcontractors, this situation can require new or additional contract to accommodate the discovered error or change, and it may generate a contractual dispute in order to avoid the responsibility of this error or change. We denote this situation as 'derivative activity' and whether error or change is detected early and whether they are throughout an adequate error and change management process becomes a significant issue in the effective management of the scope and the corresponding performance.
-Error/Change Generation: P
-Error/Change Discovery Location: S
-Error/Change Discovery Time -Error/Change Discovery Time
-Before P Finish -After P Finish
S ST P Fr S ST P FT
P P
Error or Change 4 ]Error or Change
Generation Error or Change Gneration
Error or Change
Discovery Discovery
&Der ti Activity
[111y Delay
P s A 5: T Se
*Note P: The Predecessor Activity S: The Successor Activity ST: Start Time FT: Finish Time
CHAPTER
5
QUALITY AND CHANGE MANAGEMENT
MECHANISM
Discussions on different impact patterns of error and change show that they cannot be treated as discrete events. Therefore, identifying how error and change behave and are managed during the actual execution is a critical point to effectively deal with them. In this sense, the framework for quality and change management is proposed with dynamic relationships among design and construction activities. For this, a holistic view is adopted, rather than the discrete view of traditional network planning tools.
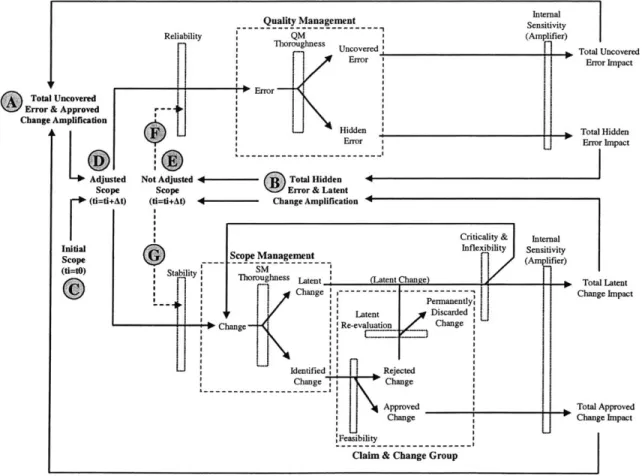
5.1. Internal Quality and Change Management Mechanism
Before exploring the whole project network, we discuss how error and change behave internally within the activity. As summarized in Figure 4, first, work is performed based on the given work scope. However, all the work being performed does not guarantee that this work is done correctly and can have errors. To represent this situation, reliability is here defined as the degree of how much performed tasks has been done correctly during the actual execution. High reliability means that a small number of errors are introduced, while low reliability represents the possibility of a great number of errors during design and construction. For example, if Activity A has 90% reliability, error in the Activity A is expected to be
depending on diverse variables over time. For instance, if the schedule pressure becomes high as the project progresses, the worker's fatigue would be increased and consequently, more errors would be introduced, which means reliability becomes low.
However, some portions of errors may not be uncovered and become hidden during the quality management process. In order to explain this situation, we use the dynamic variable, the quality
management thoroughness, which is defined as the degree of how many of the existing quality problems
are identified during a quality management process. For example, if Activity A has 90% of the quality management thoroughness, 90% of total errors are discovered and remaining 10% would be hidden throughout the quality management process.
This concept is based on the fact that applied quality management techniques are not perfect and constant during the execution. In reality, diverse techniques for quality management can be applied and they have a different effect on error discovery depending on several conditions such as their effectiveness on a particular kind of construction project and users' familiarity of applied techniques. Suppose welding is performed in the pipe installation activity in the building construction. Reinforcement welding is often used as a quality management technique if welding volume is not sufficient. The inspector found that welding volume of pipes in the second floor is not sufficient, and that means error is uncovered during the quality management process by the inspector. He asked the worker to do reinforcement welding on that already performed pipe and left for the third floor. However, the worker assigned for reinforcement has only experience on basic welding tasks not reinforcement welding. Reinforcement needs to be performed carefully because excessive reinforcement can affects the fatigue-strength of a welding part. Due to his/her no knowledge on this fact, excessive reinforcement may occur since the worker may think that more is better. In that case, welding parts with excessive welding will become hidden errors. Therefore, quality management thoroughness represents the actual effectiveness of applied techniques on the particular work as seen in the above example.
Last component for the internal quality management process is the elasticity for error. The elasticity for error represents how much the schedule pressure affects the personnel who perform the quality management process. In other words, if inspectors have more works to be inspected than usual and feel the pressure to meet the schedule, he/she would force them to be progressed aggressively. Therefore, there are more chances that errors become hidden due to his/her hurry. In this sense, having enough quality management staff would be one of the solutions to manage unexpected additional work, and this phenomenon has not been paid much attention to by traditional project management practice. In summary,
the elasticity for error is adopted to represent the effect of the schedule pressure on the quality management thoroughness, and their relationship, together with the quantification, is derived from the interview and survey with the quality management staff.
Having these components, each uncovered and hidden error generation ratio can be represented as the form in Eq. (1) and (2), respectively:
n Eu = (I - R(t)) x fl (Mqi ai) (1) i=1 n Eh = (1 - R(t)) x H (1-Mqiai) (2) i=1
where, Eu is uncovered error generation ratio, Eh is hidden error generation ratio, R(t) is reliability in a given activity, Mqi is the quality management thoroughness of the overall effectiveness of several applied techniques, ai is the elasticity for each error generation ratio, i represents each applied technique, and n is total number of techniques in the quality management process. The left-side of equations, (J-R(t)), are the projected total error generation ratio and the right-side product explains the dynamic effect of the applied techniques. In this case, the product is used in order to combine impacts of different techniques because the failure of one of the applied techniques means the system failure.
Meanwhile, change order process has a slightly complex management mechanism. It has two major elements. One is the scope management process, and the other is the claim and change group. First, change is triggered based on stability having a given initial scope. Stability is defined as the degree of how many tasks will be done without change request and is insusceptible to scope management issues. High stability means that small number of changes would be issued to a particular activity, while low stability represents the possibility of significant number of change requests during the execution of a particular activity. For instance, if activity A has 90% stability, 10% of the work scope would be subject to change. Among potential changes, some changes can or can't be identified through scope management thoroughness similar to the quality management process. Change that is not identified during scope management process is represented as latent change. Latent changes are changes that have not been identified and have the potential to be reactivated as identified change at a later stage. Also, change generation process has the elasticity for change with respect to scope management thoroughness. Based
on these factors, identified and latent change generation ratio is formulated in the form of Eq. (3) and Eq. (4): n Ci =(1 -S (t)) X1(Msi fi) i=1 n Cl = (I - S (t)) x rl (I - Msi') (3) (4) i=1
where, Ci is identified change generation ratio, Ci is latent change generation ratio, S(t) is stability in a given activity, Msi is the scope management thoroughness of the overall effectiveness of several applied techniques, fli is the elasticity for each change generation ratio, i represents each applied technique, n is total number of techniques in the scope management process. The left-side of equations, (1-S(t)), are the total error generation ratio and the right-side product explains the dynamic effect of the applied techniques.
Internal
Quality Management. Sensitivity
Reliability M (Amplifier)
Thoroughness Unovre
Uncovered Total
Error Eo
Error
Cg SError & Approved Total Uncovered r-Change Amplification
A LHidden TOtWl
Error Error
Adjusted Not Adjusted Total Hidden o
Scope Scope Error & Latent
(ti=ti+At) (ti=ti+At) 4 Change Amplification
Criticality & Internal
SScope Management Inflexibility Sensitivity
I
It
(ti__tO) Stability SMI
--- : Thoroughness L atent ' (Latent Chanize) Tot
Change | --- --- '---- Chang
-/Permanently:
Latent Discarded I Change - Re-evauation Change
Identified Rejected Change Change --- i Approved Total Change Chang ibility --- I Claim & Change Group
Uncovered r Impact Hidden itmpact I Latent e impact Approved e impact
However, another process is involved in changes after the above categorization. That is the role of the claim and change groups in a project, which is initiated in order to deal with the claim and change order process. Identified change isn't always approved by the claim and change group because of itsfeasibility. For example, the explosion method was planned for excavation work for Project A. But, the owner failed to get permission to use that method from the local authorities due to community's objection to noise and dust. In that case, the scrape and excavate method can be an alternative to the explosion method in Project
A. However, if equipment and subcontractors for the explosion method were already contracted and
another equipment and subcontractors for the scrape and excavate method are contracted additionally, it would create significant cost increase. Therefore, the claim and change group on the project can object to the scrape and excavate method and suggest that the owner persuade the community aggressively to prevent paying double cost. In other words, whether identified change becomes approved change or
rejected change depends on the feasibility of the requested change.
In addition, rejected changes become latent change due to the potential for reactivation, particularly, if certain events work against particular action been undertaken. For example, even though the scrape and excavate method was rejected by the claim and change group, it may be brought back to the table if the owner fails to get permission from the community. Rejected change can also be permanently discarded
change, if there is no need for further consideration. In this change example, though the scrape and
excavate method is rejected due to the budget and contractual problem, but it still remains as latent change in order to prepare the worst case, like the community's final objection. If the explosion method is performed without any further problems or is too infeasible to adopt in this stage due to cost or contractual problems, the scrape and excavate method will be permanently discarded. The process for re-consideration for rejected changes is denoted as latent re-evaluation. Latent re-evaluation determines if rejected changes are adopted as latent changes or permanently discarded changes. In addition, latent changes also have a possibility to be reactivated due to certain factors related to criticality and inflexibility of certain activities. Continuing with the above example, while the owner tries to persuade the community to get permission, the scrape and excavate method, latent change, may be back to the table of the claim and change group due to the schedule delay. Though permission from the community is still progressing and the owner reported their positive reaction to the claim and change group, the schedule delay brought
by this process becomes intolerable to wait any more, because the excavation work is a very critical and
inflexible activity as a starting point of a chain of subsequent structural activities such as the foundation and the superstructure work. In other words, the other subsequent activities can not progress without the completion of the excavation work.
Though change was not introduced as approved change, this latent change may be issued again because it is very critical to the whole network and the activity is very inflexible, which means there are very few or uneconomical choices as the alternatives to this latent change.
5.2. Work Multipliers
So far, it could be observed how error and change can be generated and differentiated based on their behaviors and state in the internal construction process. However, without capturing the dynamic relationships among activities, they may not reflect the actual conditions and effects on construction processes. For instance, if identified change in the scope management process is approved by the claim and change group, its effect can vary depending on the relationships with internal or external activities. In our previous change example, the scrape and excavate method may be approved as a change replacing the explosion method. In that case, it can generate subsequent changes to the remaining tasks within that activity or successor activities such as their late start, because it is less effective than the explosion method in terms of required duration. Consequently, this late start may generate other contractual problems in the worst case and that means its effects can not be limited to just that issue having different impact. Work multiplier is contrived in order to capture this dynamic relationship and to quantify its effect. For this, sensitivity is adopted here to address these impact relationships within or among activities. The former is denoted as internal sensitivity and the latter as external sensitivity. In addition, sensitivity is related to not only change but also error impact. For example, if piling is wrongly located as seen before, subsequent column and floor work may be affected by different impact strength based on their relationship with piling work.
The one point to note is that sensitivity also governs hidden errors and latent changes. Though they are not uncovered or approved, they can impact successor activities such as generating quality problems. In the piling case, if manager didn't catch the error in piling location, this hidden error may also generate subsequent errors on successor activities like continuously wrongly located columns.
Therefore, total hidden error and latent change impact as well as total uncovered error and approved
change impact, which are denoted as A and B in Figure 4, are finally determined by sensitivity. It implies
that the reduction of hidden errors and latent changes is necessary to avoid late and sudden overflow of work to meet the scheduled date, usually known as 'the last minute syndrome'.
5.3. Impact of Adjusted Scope and Not Adjusted Scope
The initial scope, C in Figure 4, is given before the activity starts. However, as the activity progresses, newly introduced work scope may be added to the initial scope due to uncovered errors and approved changes. Of course, these errors and changes include their impacts within the activity through internal sensitivity to account for its impact on the activity under study. Therefore, adjusted scope, D in Figure 4, is denoted as the newly added scope with the initial scope and is updated as the activity goes on. In other words, it is apparently perceived as the work to do by managers. Meanwhile, hidden errors and latent changes are also errors and changes though they are not uncovered or approved as errors and changes. These errors and changes, with their impact on that activity through internal sensitivity, are denoted as not
adjusted scope, E in Figure 4. Not adjusted scope represents a crucial meaning to the project performance,
because it is not perceived by managers even though errors may be corrected or considered inevitable at a later time as seen in F and G in Figure 4.
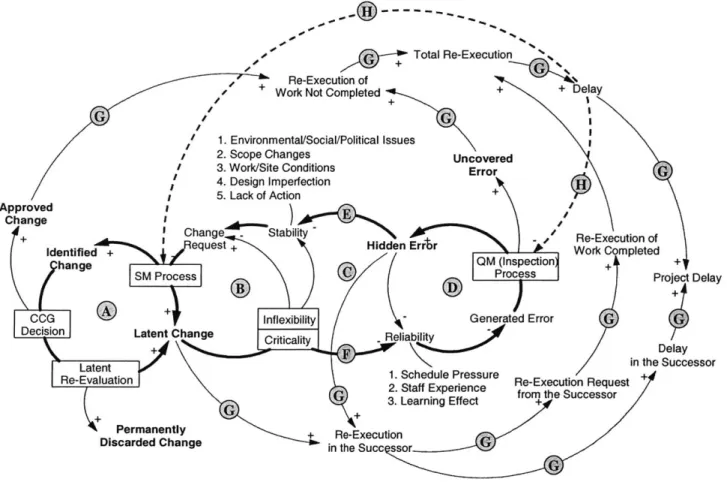
Detailed procedure can be explained using the feedback structure illustrated on Figure 5. First, Loop
A and B show change management mechanism and these loops explain the impact of latent change on the
stability. If latent changes are accumulated in the process, they may make the stability of the system deteriorate and consequently, more change requests are addressed. In the previous excavation work example, assume that the scrape and excavate method is rejected and becomes latent change because the claim and change group decided to suggest the owner persuade the community with additional research on dust and noise issues by commissioning a third authority. However, in order to keep the original plan, they may use significant amount of unplanned budget and time to prepare the meeting with the community and to do additional commissioning. Furthermore, the start of successor activities can be further delayed till they get permission from the community. Though it is less expensive to reject the scrape and excavate method than to approve it, several unplanned effects are derived from this rejected and latent change. Similarly, hidden errors may also deteriorate the reliability of the process as denoted
by Loop C and D in Figure 5. In the piling example, unnoticed wrongly located piles may generate other
quality problems on subsequent column and floor works such as the failure of welding between column and floor.
The important point is the connection between these loops as denoted by E and F in Figure 5. If hidden errors are accumulated through the process, it may affect the stability, which represents the possibility of change generation. In the previous piling example, let's assume that wrongly located piles
were not found in the quality management process and became a hidden error. At that time, the owner requested the change of building purpose from normal office space to another space which can deal with library facilities. Normally, the library requires greater load-bearing capacity than normal office space.
00-00 Total Re-Execution G
Re-Execution of
Work Not Completed + + Delay
GG
1. Environmental/Social/Political Issues
S
2. Scope Changes Uncovered
3. Work/Site Conditions Error
4. Design Imperfection
5. Lack of Action Approved
Change I E
Change Stability
+equest + ide rtr- Re-Execution of
Identified + equest + Hidden Errtor Work Completed
hange
/QM
(Inspection + +SM Process
(
Process Project DelayCCG + Inflexibility Generated Error G
Decision Latent Change Criticlity Reliability
+ F Delay
Latent in the Successor
Re-Evaluation 2Staf Experese Re-Execution Request +
S 3. Learning Effect +
Permanently + Re-Execution
Discarded Change in the Succ ssor
G
Figure 5. Feedback Processes on Quality and Change Management Process
The claim and change group accepted the owner's request because the original structural plan had redundant dead load capacity. However, it can be hazardous to adopt the requested change, because wrongly located piles may reduce the capability to bear planned dead load. When the manager noticed this hidden error, the decision of the claim and change group had been already made and it might generate the subsequent changes to solve this hidden error problem. Therefore, hidden error as well as latent change may deteriorate stability of the process. This phenomenon is also applied to latent change, which can affect reliability of the process as denoted by F in Figure 5.
In addition, these iteration cycles introduce delay through several steps as denoted by G in Figure 5. Finally, delay can deteriorate scope and quality management processes denoted by H in Figure 5 and, consequently, generate more hidden errors and latent changes. If we assume that Activity A is in the critical path and delayed significantly, the manager may decide to reduce scope and quality management thoroughness on purpose in order to drive up the execution speed. However, that action may not catch errors and changes and it has a potential to be just a temporary expedient. Therefore, it may generate more hidden errors and latent changes and the project can suffer at the later stage due to the last-minute syndrome.
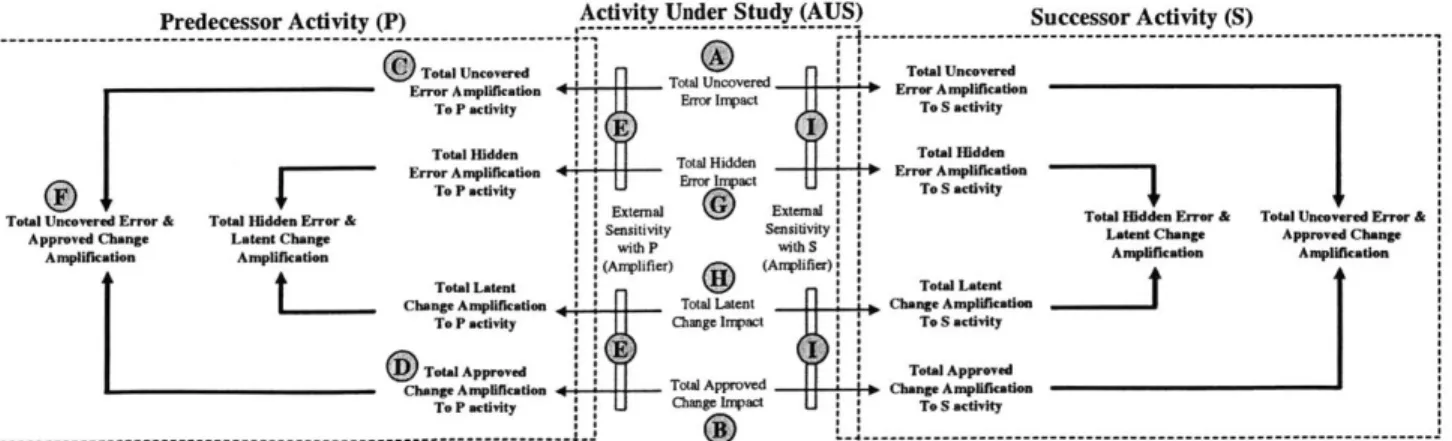
5.4. External Quality and Change Management Mechanism
External sensitivity can make error and change within one activity influence predecessors and successors, which is displayed in Figure 6. For example, total uncovered error impact (A) and total
approved change impact (B) in the activity under study become respective total uncovered error
amplification (C) and total approved change amplification (D) to the predecessor activity through the
predecessor activity's external sensitivity (E). And then total uncovered error amplifcation (C) and total
approved change amplification (D) transfers to total uncovered error and approved change amplification
in the predecessor activity (F). The reason that uncovered error and approved change are combined is because they are perceived by the manager and the scope will be adjusted to incorporate them. In addition, total uncovered error and approved change amplification of the predecessor activity (F) includes the impact of the activity under study (C, D) and its own total uncovered error and change impact. The same flow is also applied to the successor activity.
Predecessor Activity (P) Activity-Under-Stud AUS) Successor Activity (S)
Total Uncovered ToaUnved
Error A mplification Total Uncovered~ Error Amplification
To P activity Error Impact To S activity
Total Hidden al Hidden Total Hidden
Error A mplification T0 Error Amplitlcation
To P activity r pc To S acivity
Total Uncovered Error & Total Hidden Error & External External Total Hidden Error & Total Uncovered Error &
Apprved Change Latent Change Sensitivity Sensitivity Latent Change Approved Change
Anplcation Amplification wA ) (A S I Amplificatien Amplification
Total Latent Total Latent
Change Amplification 0 Total Latent
n
Change AmpliflcationTo P activity Change Impact I To S activity
F Change Amnpflfication Total Approved oa Approved No-I Change AmplificationTotal Approved s
To P activity thage Impac U : To S activity
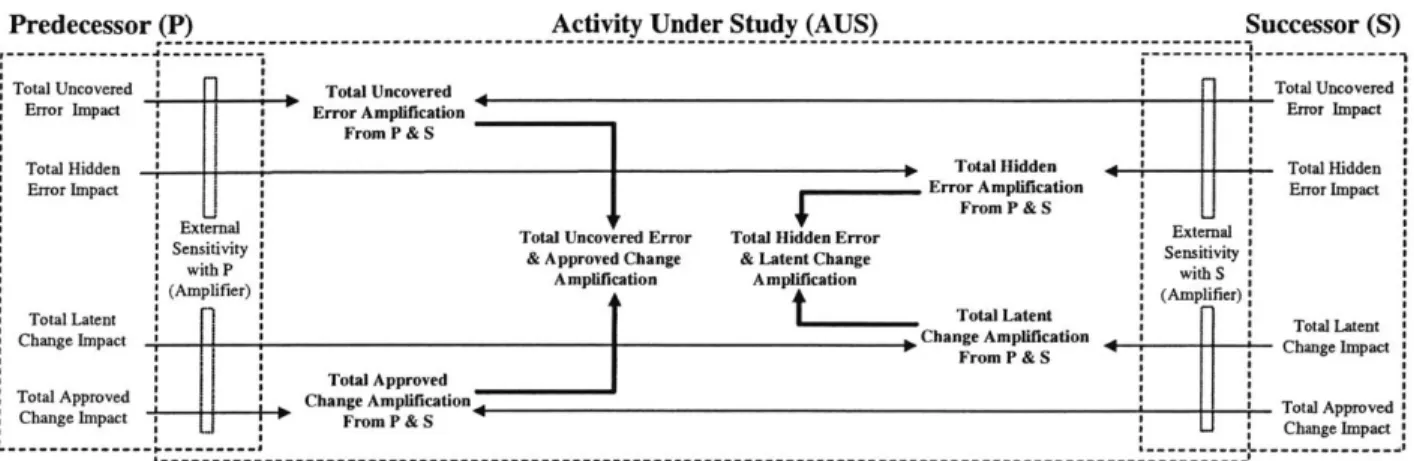
Meanwhile, total hidden error impact (G) and total latent change impact (H) in the activity under study also amplify their effect to the predecessor and the successor activity through corresponding external sensitivity (E, I). After transferred to the predecessor and the successor activity, all amplifications adjust the predecessor and the successor scope. In case of hidden error and latent change, they are accumulated on not adjusted scope of the respective predecessor and successor activity. This process is iterated till the end of the project.
Predecessor (P) Activity Under Study (AUS) Successor (S)
--- - -
---Total Uncovered Total Uncovered Total Uncovered
Error Impact Error Amplification Error Impact
FromP&S
Total Hidde Total Hidden Total Hidden
Error Impact Error Amplification Error Impact
o IFrom P & S
Total Uncovered Error Total Hidden Error External
Sensitivity & Approved Change & Latent Change Sensitivity
a with P :* with S
(Amplifier) Amplification Amplification (Amplfier)
i Total Latent t Total Latent
Change Impact Change Amplification Coal Lat
5 From P & S *ChangeImpact
Total Approved
Tl Apov Change Amplification Total Approved
Change Impact i I From P &SChgeIpc
Change Impact
Figure 7. External Quality & Change Management Impact From Predecessor and Successor Activities
Finally, this interaction between activities can be extended to the whole network of the project as seen in Figure 8. If one error or change is generated at the activity, it may affect the activity itself as well as can propagate to the subsequent activities and even the whole network, particularly, in concurrent design and construction.
This propagation of iterative cycles shows the need for the holistic approach to deal with the impact of uncertain events. Traditional static approach may address the propagation impact on the schedule network, however, it lacks the capability to explain what causes what and the quantification of the propagation impact. In addition, the above propagation impact on the project performance can be
f000091i
'
(-
(N
(i-X
g:ftt
ACHAPTER 6
PERFORANCE
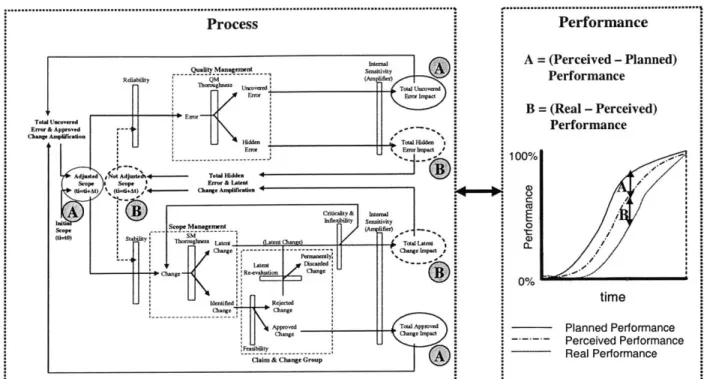
Having the understanding of the impact of iterative cycles allows us to differentiate the project performance as planned, perceived, and real performance. Planned performance is the intended performance determined during the planning stage and it can be expressed as a kind of goal before the actual execution. After a project starts, the manager checks the ongoing performance in several ways, and the monitored performance can be referred to as perceived performance. In other words, the gap between goal and ongoing status can be explained by the effect of uncovered errors and approved changes, as denoted by A in Figure 9.
Usually, the manager changes or corrects the subsequent plan based on this gap. However, this way of comparison may ignore the impact of dynamic relationships on the project. Real performance considers dynamic relationships between the effect of hidden errors and latent changes, and it is what really happens in the project, as denoted by B in Figure 9. The difference between perceived performance and real performance is often disregarded during usual project management. If we can perceive and understand this gap, it would help manage the performance profiles and the reduction of the subsequent ill effects of missing actions, such as sudden work overflow at late stage.
![Figure 2. Feedback Processes throughout the Actual Execution [Modified from MoonSeo Park, 2000]](https://thumb-eu.123doks.com/thumbv2/123doknet/14754460.581822/16.918.235.652.538.959/figure-feedback-processes-actual-execution-modified-moonseo-park.webp)

![Table 2. Example of Error and Change Impact Patterns in Construction [Augmented from MoonSeo Park, 2000]](https://thumb-eu.123doks.com/thumbv2/123doknet/14754460.581822/19.918.87.800.681.1049/table-example-change-impact-patterns-construction-augmented-moonseo.webp)