DEEP STRUCTURE AND GEOPHYSICAL PROCESSES BENEATH ISLAND ARCS
by
NORMAN HARVEY SLEEP
B.S., Michigan State University (1967)
M.S., Massachusetts Institute of Technology (1969)
SUBMITTED IN PARTIAL FULFILLMENT OF THE REQUIREMENTS FOR THE DEGREE OF DOCTOR OF PHILOSOPHY
at the
MASSACHUSETTS INSTITUTE OF TECHNOLOGY November, 1972
C
t, e, Fe 9 3)Signature of Author... Department of Earth and Planetary Sciences, November 20, 1972
Certified
by.,-Thesis Supervisor Accepted by...
Chairman, Departmental Committee on Graduate Students s)
ABSTRACT
Deep Structure and Geophysical Processes Beneath Island Arcs
by
Norman Harvey Sleep
Submitted to the Department of Earth and Planetary Sciences on January 17, 1973
in partial fulfillment of the requirements for the degree of
Doctor of Philosophy
The deep structure and geophysical processes
associated with island arcs were examined as a problem in heat and mass transfer. Particular attention was given to the thermal behavior of lithosphere as it descends into mantle, seismic transmission through descending slabs, the origin of the magmas which erupt on island arcs, and the cause of crustal spreading in intra-arc basins.
The factors affecting the thermal behavior of a lithosphere slab descending into the mantle are so
complicated and numerous that only numerical methods can accurately account for them. A series of finite-difference calculations of the temperature field were made to test the effect of phase changes, the dip of the slab, the thermal
in those parameters and geologically permissible variations in radioactive heating and adiabatic compression did not greatly effect the gross thermal structure calculated for
the slab. Irregularities in slab movement on a time scale of less than 2 million years do not significantly effect the thermal field. Possible factors limiting the maximum depth of seismic zones include thermal assimilation of the slab due to latent heat from phase changes and thermal
conduction, mechanical disruption of the slab, and the lack of stress at great depths due to lower density contrast between the slab and the mantle.
Theoretical ray paths through the numerically calculated thermal models of slabs were computed. The results were in good agreement with observed travel times. First motion amplitudes of P-waves at teleseismic distances were measured from long and short period WWSSN records of intermediate focus earthquakes in the Tonga, Kermadec, and Kurile regions and of nuclear explosions and shallow earthquakes in the Aleutian region. These amplitudes were corrected for source mechanism. The Aleutian data were sufficient to show that intermediate focus earthquakes in that region occur in the colder regions of the slab. At short periods shadowing effects which could be associated with the slab were not very marked, less than a factor of 2 reduction for
more reduction for epicentral distances between 30 and 50 degrees. No systematic effects due to plates were found in the long period data. Some stations in the predicted shadow zone of -a Tonga earthquake recorded low amplitude precursors which probably were greatly defocused waves which ran the full length of the slab. Simple diffraction
is incapable of explaining the short period results. Numerical and analytic models were constructed to examine four hypotheses for the origin of island arc
volcanics: (1) melting at temperature lowered by inclusion of subducted material; (2) frictional heating related to the descent of the slab; (3) upwelling of material from the asthenosphere into the lithosphere of the island arc;
(4) concentration of pre-existing melt in the asthenosphere. Presently available geochemical data is insufficient to
resolve whether a significant portion of subducted material erupts on island arcs. This does not create a difficulty in
evaluating the other hypotheses, as the observed eruption temperature of island arc volcanics is similar to that of basalt. The viscosity of the melt and the geometry of the asthenosphere are not conducive to segregation of melt. At low concentrations of melt, the regions with the highest concentration of melt contribute disproportionately to the magma which segregates. About 4 kb of shear stress is needed to cause melting above the slab. Frictional heating is not
5
likely to cause the widespread high crustal temperature observed beneath island arcs. Hypothesis 3 involves no obvious thermal or mechanical difficulties although the uncertain rheological properties of the region near the base of the lithosphere preclude the computation of a
realistic, detailed model. However, it is both mechanically and thermally reasonable that the slab could entrain
intermediate viscosity material near the base of the
lithosphere. An influx of material from the asthenosphere to replace the entrained material could produce high crustal temperatures and provide a source region for island arc volcanics.
The hypotheses and models studied in relation to island arc volcanism are also relevant to spreading in intra-arc basins. Frictional heating above the slab is probably insufficient to cause this spreading. A numerical study was made to see if the extension could be related to viscous flow of material entrained with the slab. This calculated flow had the correct geometry to cause tension behind the island arc. Intra-arc spreading would be most likely to occur if the flow was induced in the intermediate viscosity region between the lithosphere and the asthenosphere.
ACKNOWLEDGEMENTS
This -work might have proved intractable without the help of others. Especial thanks goes to my adviser, M. Nafi Toksoz, who endured my midwestern conservatism and suggested the topic of study and whose ideas and comments both clarified my thinking and improved this manuscript. I would also like to thank: Drs. John Minear and Bruce Julian for supplying computer programs which were sub-sequently modified; Drs. Jorge Mendiguren, Don Weidner and Professor Sean Solomon for helpful hints on reading seismograms; Dr. D. Joe Andrews for much advice on
numerical and mathematical matters; Al Smith, Professors Richard Naylor, Seiya Uyeda and Sean Solomon for critical comments on various parts of the draft of this manuscript; and the above named people, Kei Aki, Patrick Hurley, Dai Davies, and William Bryan for useful discussions. Al
Taylor provided assistance with using the seismic library. Ms. Sara Brydges typed the manuscript, translating it into standard English.
This work was supported by the Advanced Research Projects Agency and monitored by the Air Force Office of Scientific Research under Contract No. F44620-71-C-0049. The author was supported in part by a National Science Foundation graduate fellowship.
TABLE OF CONTENTS
Page
ABSTRACT . . . . . . . . . . . . . . . . * . .
ACKNOWLEDGEMENTS. . . . . . . . . . . . . . .
1. INTRODUCTION. . . . . . . . . . . . ... 2. TEMPERATURE IN A DOWNGOING SLAB . . . . .
2.1 Physical parameters. . . . . . . . . 2.1.1 Radioactivity . . . . . . . . 2.1.2 Adiabatic heating . . . . . .. 2.1.3 Thermal conductivity. . . . . 2.1.4 Phase changes . . . . . . . . 2.1.5 Unperturbed mantle geotherm . 2.2 Computational results. . . . . . . . 2.3 Geophysical implications... ....
2.3.1 Maximum depth of earthquakes. 2.3.2 Gravity anomalies . . . . . . 2.3.3 Continent-continent collisions 2.4 Conclusions. . . . . . .
Table . . . . . . . . . . . . . . . . . Figures . . . . . . . . . . . . . . . . 3. SEISMIC WAVE TRANSMISSION THROUGH SLABS
3.1 Geology of source regions. . . . . 3.2 Computations of velocity models. . 3.3 Theoretical ray paths. . . . . . . 3.4 Travel time anomalies. . . . . . . 3.5 Amplitude anomalies. . . . . . . . 3.5.1 Aleutian amplitude results. 3.5.2 Long slab amplitude results 3.6 Conclusions. . . . . . . . . . . . Table . . . . . . . . . . . . . . . . . Figures . . . . . . . . . . . . . . . . . . . 6 . . . 10 . 12 . . 13 . . . 13 . . . 14 15 . ..16 17 . . . 19 . . . 22 . ..23 28 29 . . . 31 . . . 33 . 35 . 54 55 . . . 57 59 61 63 . 68 72 . 78 81 . 83 . . . .
Page 4. ISLAND ARC VOLCANISM. . . . . . . . . . . . . .121 4.1 Data and constraints . . . . . . . . . . .123
4.1.1 Geology and petrology of island
arc volcanics . . . . . . . . . . .124 4.1.2 Geochemistry. . . . . . . . . . . .127 4.1.2.1 Daughter isotopes. . . . .130 4.1.2.2 High pressure geochemistry
of calc-alkaline rocks . .132
4.1.3 Geophysical data. . . . . . . . . .133 4.1.4 Geological, geochemical and
geo-physical constraints. . . . . . . .135 4.2 Theoretical modeling and testing of
hypotheses . . . . . . . . . . . . . . . .136 4.2.1 Segregation of melt from mush . . .136
4.2.1.1 Mathematical model of
segregation. . . . . . . .137 4.2.1.2 Discussion of model. . . .140 4.2.2 The fault zone and frictional
heating . . . . . . . . . . . . . .143 4.2.2.1 Frictional heating in the
rigid mantle . . . . . . .144 4.2.2.2 Shear zones in fluid
mantle . . . . . . . . . .148 4.2.3 Intrusions from asthenosphere . . .152
4.2.3.1 Mechanical model for flow in high viscosity upper
asthenosphere. . . . . . .154 4.2.3.2 Thermal considerations on
flow in high viscosity
upper asthenosphere. . . .156
4.3 Summary and conclusions. . ... . . . . . ..158 Figures . . . . . . . . . . . . . . . . . . . .161 5. INTRA-ARC BASINS. . . . . . . . . . . . . . . .173
5.1 Spreading origin of intra-arc basins . . .174 5.2 Mechanism of spreading . . . . . . . . . .176 Figures . . . . . . . . . . . . . . . . . . . .185
Page
6. CONCLUSIONS AND AFTERTHOUGHTS . . . .
REFERENCES. . . . . . . . . . . . . . . .
APPENDICES
A. NUMERICAL METHODS . . . . . . . . A.l Calculation of slab models .
A.l.1 Thermal conductivity.
. . . . .195 . . .... .198
. ... .. .228 ..
... 229 A.l.2 Phase changes . . . . . . .
A.l.3 Convective geotherm . . . .
A.l.4 Accuracy and stability. . A.2 Flow in stratified viscous fluid
Figures . . . . . . . . . . . . . . . . B. MEASURED EARTHQUAKE AMPLITUDES. . . . .
Figures . . . . . . . . . . . . .. . BIOGRAPHICAL NOTE . . . . . . . . . . . . . . . . .231 . .232 . .234 . .236 . .239 . .244 . .247 . .248 . .273 . . .
CHAPTER 1. INTRODUCTION
The downwarping and descent of lithospheric plates intothe mantle, as implied by the plate tectonic hypo-thesis has been widely accepted. Increasing amounts of geological, geochemical, and geophysical data are being explained in terms of descending slabs. In this thesis, the results of a series of analytical and numerical
calculations on the evolution and properties of downgoing lithosphere and adjacent regions are described and compared with relevant observations. Rather than attempting to
solve the convection problem for the entire earth,
attention was given to problems which could be considered using observed plate motions as data. In particular, four areas were covered in detail:
1. Thermal evolution of a slab as it descends into the lithosphere (Chapter 2)
2. Teleseismic P-wave transmission through slabs (Chapter 3)
3. Origin of magmas which erupt on island arcs (Chapter 4)
4. Origin of intra-arc basins (Chapter 5).
The results of the thermal calculations were relevant to the subsequently considered problems. The seismic
studies were concerned mainly with testing the implication of the thermal models to the gross structure of the slab
and with determining the spatial relationship between slabs and intermediate focus earthquakes. Physical models of
several hypotheses on the origin of island arc volcanism and intra-arc basins involve the consideration of
processes secondary to subduction.
The method of approach was well suited to the problems studied as the heat flow equation could be solved once
the kinematics of subduction were known and since the mass transfer equation is most easily solved in regions directly influenced by the descent of the slab. As the kinematics of plate motion are used as input in the mathe-matics in this study, little information will be gained on the ultimate cause of this motion or on the flow and
temperature at great depths far from slabs.
All protracted calculations were relegated to
Appendix A. The physical models were kept simple using only the amount of detail warranted by knowledge of the physical parameters are by quality of the data to which the model was relevant. A better insight into the effect of various parameters was therefore obtained. Thermal and
seismic calculations were generally more detailed; calcu-lations involving viscosity were less detailed.
12 CHAPTER 2. TEMPERATURE IN A DOWNGOING SLAB
Deep earthquake zones beneath island arcs are believed to be related to slabs of subducted oceanic lithosphere
(e.g., Isacks et al., 1968). The relatively simple pattern of motion in these areas makes calculation of the tempera-ture field practical without solving the full convection problem for the earth. Several solutions for the tempera-ture in a slab have been obtained. McKenzie (1969) used a two-dimensional analytic solution which assumed the top and the bottom of the slab were isotherms. Griggs (1972) included the effect of phase changes in a numerical
solution with similar boundary conditions. Turcotte and Oxburgh (1969) obtained a solution using boundary layer
theory. Langseth et al. (1966), Minear and Toks8z (1970a,b), Hasebe et al. (1970), and Toks8z et al. (1971) used two
dimensional numerical models in which the mantle surrounding the slab was explicitly included so energy was conserved.
The purpose of this chapter is to use improved numer-ical calculations similar to those used by Toksoz et al.
(1971) to test the effect of various physical parameters on the evolution of the slab. Questions unanswered by previous studies include: the effect of slab geometry on
slab evolution; the factors which limit the length of the slab; the sensitivity of the slab to thermal conductivity, phase changes, and the initial geotherm, and the effect of
constant slab motion. The numerical methods used in this chapter are described in Appendix A.
2.1 .Physical parameters
Certain physical constants such as mantle radioactivity, adiabatic gradient, density, and specific heat, can be shown to be well enough constrained from a knowledge of observa-tional geophysics, solid state physics, and geochemistry that they can be considered known for purposes of construc-ting a model. The uncertainty in the value of other param-eters, such as thermal conductivity and phase change
relations, are large enough that these effects should be modeled. In addition, systematic parameters which
them-selves depend on the local physical constants, such as the unperturbed mantle geotherm, must be determined. The
effect of frictional heating and its relation to volcanism are considered in Chapter 4.
The average density profile of oceanic crust (Press, 1970) and a specific heat of 1.3 x 10⁷ erg/g-*C are
sufficiently accurate for purposes of modeling the thermal structure of the slab (Minear and Toks8z, 1970a,b).
2.1.1 Radioactivity
The average radioactivity of the oceanic lithosphere is probably about equal to the radioactivity of the upper mantle, because differentiation at mid-oceanic ridges occurs
OMMMMOMMIMMMOMM.-mainly above 30 km depth (Kay et al., 1970). Some radio-activity is added to a plate by sediments and mid-plate volcanism. It is not known to what extent this material is subducted.
Radioactive heating in the upper mantle of the earth is too low to effect the evolution of the slab. Estimates of the quantity include 2.3 x 10~ erg/gm-sec (MacDonald,
1959, 1963), 5.4 x 10⁻⁸ erg/gm-sec (Armstrong, 1968), and 1.5 x 10⁻⁸ erg/gm-sec (Hurley, 1968a,b). The larger radiactivity of MacDonald would increase the temperature only 6*C in the 10 my descent of the slab. A more
important effect of radioactive heating is on the unperturbed geotherm of the upper mantle.
The amount of radioactive heating in the upper mantle is constrained by the abundance of Ar40 in the atmosphere and the abundances of radiogenic and radioactive elements in sampled rocks to the low values of Hurley (1968a,b)
and Armstrong (1968). The MacDonald radioactivity is based on chondritic element abundances and calculated by distrib-uting the radioactivity to obtain conductive equilibrium.
2.1.2 Adiabatic heating
The amount of heating due to adiabatic compression in a downgoing slab can be calculated by pgaTvz (Hanks and
Whitcomb, 1971). Other than a, all the parameters are known at the start of any time step. As in Toksoz et al. (1971),
MONNOWINIVS00-15
a (in units of 10- 6 oC ) was calculated by
exp(3.58-0.0072z), where z is depth in kilometers. The increase in slab temperature due to adiabatic heating is about 0.3 *C/km. Considering that the uncertainty in the unperturbed mantle geotherm is greater than this amount, adiabatic heat
generation is known well enough for purposes of this chapter.
2.1.3 Thermal conductivity
Two possible schemes for calculating thermal conduc-tivity in the interior of the earth were used in constructing models. The MacDonald (1959) formulation was used for most
of the models calculated. Some models were calculated using an empirical formulation (Schatz, 1971). These formulae are given in Appendix A. The MacDonald conductivity is generally larger than the Schatz conductivity.
The conductivity change associated with the phase change at 400 km is probably not very large since ferrous
iron, which increases opacity and reduces radiative conduc-tivity, enters the common phases on both sides of the
transition zone (Ringwood, 1970). If iron-free oxides such as MgO, Al203 or SiO2 exist as minerals below the 600
km discontinuity, the radiative conductivity would be extremely high. Without direct experimental evidence at the phase relations of mantle materials at these pressures, no further speculation is warranted.
16 2.1.4 Phase changes
Several phase changes may occur in the upper mantle. Some such as slight partial melting in the low velocity
zone do not effect bulk properties because only a minor portion of the material is involved. Other phase changes
involving most of the material in the slab must be con-sidered explicitly in a thermal model. If the vertical velocity through a phase change is fast enough, a few tenths of a centimeter per year for mantle material, the phase boundary will be moved from its normal position
(Schubert and Turcotte, 1971). Except in a very rapidly convecting fluid the thermal gradient is locally sub-adiabatic near a major phase change (Verhoogen, 1965;
Schubert and Turcotte, 1971; Ringwood, 1972). This inhibits small scale flow in this region, although large scale flow is enhanced by the density difference associated with the phase change.
An improved method was used to calculate the effects of phase changes in this paper. All points in the model, rather than just those points in the slab, were examined
for phase changes at the end of each translation step and the change in the amount of each phase from the previous step recorded. Latent heat was calculated from this change and included as a heat source in the model. The translation routine for translating temperature was also used to translate the amount of each phase with the slab.
MONOMMINOMMUMMOA-This calculation scheme works for phase changes going both ways whether or not the slab is assumed to move (Appendix A).
Three phase changes were considered in the models.
Many of the models include a basalt-eclogite or equivalently a plagioclase peridotite-garnet peridotite reaction. The heating from this reaction was insignificant. Heat
gener-ation from the phase changes at 400 and 600 km is probably quite large. The, 400 km transition has been studied
experimentally (Ringwood, 1970). The slope of both phase changes is likely to be 20 to 30 bar/*C (Ringwood, 1972). For the models in which these changes were considered the phase diagram used by Toksoz et al. (1971) was used. One model was run with a seismically constrained phase diagram
for the 400 km phase change; the effect was not greatly different.
2.1.5 Unperturbed mantle geotherm
In earlier papers the unperturbed geotherm of the mantle was either assumed to be adiabatic (McKenzie, 1969), the
conductivity geotherm (Minear and Toksoz, 1970a,b; Toksoz et al., 1971), or to be controlled by the solidus temperature of peridotite (Griggs, 1972). In this study a crude approxi-mation to the average geotherm in a convecting earth was
obtained so that the importance of the unperturbed geotherm on the final results could be tested. For purposes of
18 calculation it is assumed that the downwelling parts of the
flow do not interact thermally with a significant volume of the mantle, and that the upwelling flow can be approximated with a uniform, steady-state upward flow necessary to
conserve mass. The latter assumption is reasonable since the migration of ridges with respect to trenches precludes a steady-state cell with a trapped flow in its core. At some depth heat must be added to the convection pattern to heat material which has sunk from the surface. In this region, which could conceivably include the lower part of the upper mantle, a conductive geotherm would exist.
Once these assumptions have been made, a "convective" geotherm can be calculated in a straightforward manner
(Appendix A), if the surface heat flux, the average age of oceanic crust, and the dependence of conductivity on
temperature and pressure are known. The results of the cal-culations are shown in Figure 2.1. Below 160 km the average thermal gradient is adiabatic. The gradient is increased in the region of the phase change due to the increased amount of heat generation there. Within the phase change region. the gradient is locally subadiabatic since the latent heat of the phase change is conducted to the surrounding regions. The choice of conductivity does not greatly effect the
geotherm. The conductive geotherm did not grossly differ from the convective geotherm as the effects of ignoring convection and placing all the heat sources in the upper
19 mantle have opposite signs.
2.2 Computational results
Due to the increased efficiency of the improved numerical scheme, it was possible to calculate several models with small time and space increments (Table 2.1). Adiabatic heat 'generation, density, pressure, and specific heat were not varied between models. To facilitate com-parison with earlier calculations, most of the models used
the MacDonald (1959) radioactivity and temperature distri-bution and the phase boundaries by Minear and Toksoz (1970a, b). Models were calculated to test the importance of the depth of the slab, the unperturbed geotherm, and the
conductivity. Frictional heating and its relevance to intra-arc basins and island arc volcanism is considered in Chapters 4 and 5.
A model similar to those calculated by Toks8z et al. (1971) is used as a base model with which to appraise the effects of changes in the parameters (Figures 2.2 and 2.3). The temperature field in this model is in good agreement with
the most similar earlier model (Toksoz et al., 1971, Figure 8). Upward migration of the phase boundaries into the
coldest part of the slab should be noted. The second phase change produced a kink in the isotherms, but did not cause the slab to assimilate. Latent heat from the lower phase change heated the slab to the ambient mantle temperature.
Below the depth of the lower phase change this slab would no longer be detectable by geophysical means.
The temperature field of a slab dipping 29 degrees was computed using the physical parameters of the base
model (Figures 2.4 and 2.5). Although 16 my, as opposed to 11 my for the base model, was required for this slab to penetrate to 650 km, the maximum depth of penetration of both slabs is controlled by the lower phase change. The maximum penetration of isotherms into the mantle is about
30 to 100 km less in the shallower dipping model.
The modeled slab remains cooler to a greater depth if the Schatz conductivity formulation is used (Figures 2.6 and 2.7). The thermal gradients are steep along the bound-aries of this slab, since the minimum conductivity is at intermediate temperatures. This slab persists to some extent below the lower phase change.
Use of the "convective" geotherm does not greatly alter the temperature field (Figure 2.8). The lower phase change was not included in constructing the geotherm of the model. Unlike the models using the strongly superadiabatic MacDonald
(1959) geotherm, the temperature field is not greatly influenced by the kinematics assumed for the slab, since motions in the nearly adiabatic regions of the mantle effect temperatures only slightly. It should also be noted that the effect of 400 km phase change is evident, although this
21 It is conceivable that for a period of time a slab
may become hung up at a trench such that no subduction occurs. Contraction of the lithosphere would presumably occur
else-where. The numerical method used in this chapter corresponds to such a periodic stop-start case. In some of the less
detailed models the translation distance was about 80 km and the translation time-step about 1 my. The effect on the temperature contours is barely noticeable (Figure 2.9). The geological record might contain evidence relating to
irregularities in subduction rate. The observed irregular-ities in the seismic zone are thus more likely due to dis-ruption of the slab than non-uniform descent rate.
Once subduction ceases it is most likely that the slab will detach and sink as it did in South America or the New Hebrides. Tension near the top of the slab would permit
fracture and separation. Detachment would occur if new
material was being subducted more slowly than the separation rate. The maximum amount of time a slab may remain beneath a locked subduction zone may be calculated by assuming that no motion of the slab occurs. Several such numerical models were calculated. It was found that after 3.6 my the slab was not greatly effected (Figures 2.8 and 2.10). After 16 my, the slab was still evident but the temperature anomaly was spread over a larger region. After 50 my only a very broad temperature anomaly remained (Figure 2.11). It is not likely that a seismic zone will remain active for much
22 more than 10 my after subduction ceases. Once the slab is partially heated, detachment would be easier. The velocities of plate motions are great entough that the former site of a subduction zone could be rapidly separated from the material produced by the assimilation of the slab.
2.3 Geophysical implications
The models computed by varying thermal conductivity, ambient geothermal gradient, and dip differed only in fine structure which would not be resolved by most geophysical methods. This gives some confidence in the earlier
con-clusions drawn from earlier calculations (Toksoz et al., 1971).
1. Significant contributions to heating the interior of the slab are in order of importance: (a) Conduc-tive and radiaConduc-tive transfer of heat from the
surrounding mantle; -(b) Adiabatic compression of the slab material, including the latent heat of
phase changes; (c) Frictional heating. Heating from radioactive decay is insignificant on a 10 my time. scale.
2. The slab penetrates to at least the level of the 600 km transition zone in the mantle. The 400 km transition causes only fine structure.
3. Conductive heat transfer cannot explain high heat flow behind island arcs.
23 4. The slab models may be used as a basis from which
to compute the gravity, seismic velocity, and stress fields.
Conversely, the insensitivity of the models to reasonable variations in physical parameters makes the use of data on
slabs an inefficient way to determine these parameters. Further discussion of the relevance of the models to the maximum depth of earthquakes, the gravity anomalies associated with island arcs, and of subducted continental material is in order. Seismic transmission through slabs is
discussed in Chapter 3 and the island arc volcanism in Chapter 4.
2.3.1 Maximum depth of earthquakes
No earthquakes have ever been observed below a depth of-650 to 700 km, although several seismic zones terminate at shallower depth (Isacks et al., 1968). The absence of well defined travel time anomalies for deep focus earthquakes indicates that a well defined slab does not exist for a sig-nificant distance below the earthquakes (Toksoz et al., 1971; Mitronovas and Isacks, 1971; Sen Gupta and Julian, in prep-aration). A broad region of somewhat reduced temperature or a weak continuation of the slab below the depth of maximum earthquakes cannot be excluded by the data.
This limited depth of earthquakes may be explained by
or by the absence of material which would undergo brittle failure. Hypotheses postulating the absence of brittle material below 650 km include:
1. Subduction has been active for only 10 my and the slabs have not had time to penetrate deeper
(Isacks et al., 1968).
2. Thermal conductivity is high enough that the slab assimilates with the adjacent mantle (McKenzie, 1969).
3. A local subadiabatic gradient related to the latent heat of the phase change precludes convection
below 650 km or adds heat to the slab. (Verhoogen, 1965; Toksoz et al., 1971).
4. Metastable minerals are necessary for deep earth-quakes to occur and do not exist below 650 km
(Ringwood, 1972).
5. High viscosity or iron content precludes convection below 650 km (McKenzie, 1966).
Possible causes of the absence of stress below 650 km include: 6. The 650 km phase change occurs at shallower depths
in the slab and produces the stress for deep focus earthquakes; below 650 km there is less density contrast and, therefore, less stress (Smith and Toksbz, 1972).
7. The slab below 650 km is sufficiently fragmented to not act as a stress guide.
25 These hypotheses are not mutually exclusive, as
several factors may contribute to the absence of deep earthquakes below 650 km. The models calculated above, except for 1, 4, and 5, have some relevance to these
hypotheses. Hypothesis 4 is difficult to test; hypothesis 5 can be excluded since glacial rebound studies indicate that a major barrier to convection such as a subadiabatic gradient or an increase in iron content with depth does not exist around 650 km (Cathles, 1971). Hypothesis 1 is
unlikely since there is little evidence for a major start-up of sea-floor spreading 10 my ago. Magnetic lineation
correlation (e.g., Heirtzler et al., 1968), deep sea drilling (e.g., Menard, 1972) and the relationship between
topo-graphic elevation and the age of the sea floor (Sclater et al., 1971) tend to preclude this hypothesis.
To accurately model the assimilation of the slab as in hypotheses 2 and 3 it is necessary to have a geotherm consistent with the physical parameters and motion assumed
for the mantle. For example, a conductive geotherm must exist below the depth where convection ceases since much of the heat which flows at the surface must originate in the deep interior of the earth (Hurley, 1968a,b). A lower geothermal gradient may exist since convection could con-tinue into the lower mantle after the thermal deficiency in the slab has spread out over a broad region.
26 to be the sole cause of a maximum depth for earthquakes as earthquakes in some seismic zone, such as Tonga, do not become progressively rarer with depth (Isacks et al., 1968). The age differs by a factor of 2, from the nearly vertical Mariana slab to the 30 degree dipping Japanese slab.
Thermal conductivity would have to increase with temperature as in the models for the slab to heat up in 10 my since the thermal time constant for oceanic lithosphere is about 35 to 50 my (Sleep, 1969; Sclater and Francheteau, 1970).
Several modeled slabs were heated to above the normal mantle temperature after penetrating the 600 km phase change
(Figures 2.3, 2.5, and 2.9). These higher than normal temperatures are a result of the artificial nature of the assumed motion. In the physical situation the material would move away laterally as soon as it became buoyant with
respect to the mantle. However, the excess temperature at the base of the slab is not large and not found in all the
models including the 600 km phase change (Figure 2.7). Whether a broad cool region can exist where the slab penetrates into the lower mantle depends sensitively on the geothermal
gradient and on the latent heat of the 600 km phase change. The geothermal gradient, however, depends whether mantle-wide convection occurs. Models which assume the kinematics
of the motion and the geotherm are, therefore, unlikely to resolve this problem.
about 10%, is much larger than the 2% or 3% density con-trast due to ordinary thermal contraction. If the phase transition occurred at shallower depths in the slab, considerable stress would be generated in the lower part of the slab. This probably explains the high seismicity of small detached segments of slab in Tonga and the New Hebrides (Smith and Toksoz, 1972). Below the depth of the phase transition in the mantle, where this density could not exist, the stress might be insufficient to cause earthquakes.
A small detached fragment of a slab is not likely to have enough stress for earthquakes although it may be
sufficiently cool for faulting. Sufficiently low subduction rates cannot supply material to the slab as fast as a
detached block would sink on its own. Successive blocks would not interact and no seismic zone would form. If the empirical relation between dip and subduction rate
(Luyendyk, 1970) gives the minimum sinking rate, no slabs should form from subduction below 2 or 3 cm/yr. This is consistent with the observed absence of seismic zones near poles of plate rotation.
A mechanical condition, such as a moderate increase in viscosity around 650 km, might disrupt the slab without interfering with mantle-wide convection or the response to glacial rebound. The process of disruption is probably active in the deeper part of the Tonga slab. Locally vertical and horizontal dips are present in the highly
contorted region (Isacks et al., 1969). The stress patterns of deep earthquakes are compressional along the dip of the
slab, indicating that the descent is being resisted from below (Isacks and Molnar, 1971; Smith and Toksoz, 1972). The horizontal dip of detached slabs in the New Hebrides
and South America and the horizontal portion of the Tonga slab also indicate that the slab has mechanical difficulty penetrating below 650 km. Once the slab is disrupted the
smaller fragments are easily thermally assimilated and unlikely to accumulate enough stress to cause earthquakes.
2.3.2 Gravity anomalies
The gravity anomaly due to the slab can be calculated in a straightforward manner if the coefficient of thermal expansion is approximately known (Appendix A). The gravity anomaly is relatively independent of the detailed structure of the slab. Thermal conductivity can redistribute heat over short distances, but the total amount of heat and
therefore the density anomaly is conserved. Thermal models which consider the slab alone (McKenzie, 1969; Griggs, 1972)
cannot be used to calculate gravity, because heat is not conserved at the artificial boundary with the surrounding mantle.
Gravity anomalies which were calculated for six slabs (Figures 2.12 and 2.13) are much larger than observed,
The effects of the slab on the free surface of the earth and perhaps the region near 650 km may compensate the
gravity anomaly. Hydrodynamic pressure will move a stably stratified boundary in a slowly moving viscous fluid relative to the pressure creating a density anomaly. Oceanic trenches are a feature of this type (Elsasser, 1967; Morgan, 1965). Stress equilibrium requires that the excess weight of the slab be balanced by either hydrodynamic forces or rigid support. The viscosity of the lower mantle determined from glacial rebound is too low for that region to rigidly
support the slab (Cathles, 1971). The lithosphere is too thin to have any great effect over regions larger than its thickness.
Consideration of the dynamics as well as the kinematics of convection is necessary to understand the small observed amplitude of gravity anomalies near island arcs. Any
complete convection model must satisfy this data. Without additional, more difficult calculations, all that can be concluded is that the weight of the slab is supported by hydrodynamic forces rather than the static strength of the mantle.
2.3.3 Continent-continent collisions
Continents connected to oceanic plates may drift into a trench causing a continent-continent collision. An
since less dense continental crust cannot penetrate the mantle. Numerical slabs of an intra-continental subduction zone were constructed to obtain predictions on their
behavior.
The large scale structure in the region of a continent-continent collision is in part inherited from the pre-existing active continental margin and in part due to the subducted continental crust. The qualitative effect of most subduction parameters can be easily determined. At normal subduction rates, the material in the slab cools the surrounding region. High geothermal gradients above the slab could result from frictional heating on the fault plane (e.g., McKenzie and Sclater, 1968) or from mass transfer with material from below. At subduction rates of a few centimeters per year frictional heating in the seismic zone cannot cause high geothermal gradients near the surface without convective heat transfer (Hasebe et al., 1970). For continental crust to have much effect on temperature during its subduction, the subduction rate would have to be low since the average radioactive heat production of continental crust, 4.1 x 10⁻⁶ erg/gm-sec (Hurley, 1968a,b; Armstrong, 1968), can cause a maximum temperature increase of 10*C/my.
A numerical model using extreme value of parameters was constructed showing that frictional heating along the
fault plane, alone, could not produce extremely high geo-thermal gradients above a subducted continent (Figure 2.14).
After about 50 my the temperature returns to steady state (Figure 2.15). We may conclude that orogeny is most likely to occur during the collision or after about 50 my when the subducted continental material has become heated. In the former case the heat of the orogeny would be related to volcanic activity along the active margin prior to the collision. In the latter it would be radioactive decay in the subducted material.
Mass transport of heat, probably necessary if high geothermal gradients occur in the crust above the slab, can be caused by igneous intrusions from the mantle, folding of deep strata upward during the collision, and partial melting and intrusion of continental crust. To determine the
extent to which these processes operated during a continent-continent collision, the duration of igneous activity and folding associated with the orogeny and the relative temporal order of folding, metamorphism, and igneous activity must be deduced from observed geology.
2.4 Conclusions
Numerical models of the temperature regime in a
downgoing slab were constructed using a more flexible version of the numerical scheme used by Toksoz et al..(1971). The results were not greatly dependent upon the reasonable changes in the thermal conductivity, the unperturbed geotherm, and
32 results of the calculation.
The observed maximum depth of earthquakes is probably related to lack of cool brittle material due to increased thermal conductivity at high temperatures and the latent heat of the 600 km phase change; and to the lack of stress due to mechanical disruption of the slab and a smaller density contrast below the phase transition. A kinematic model which assumes the ambient mantle temperature cannot be expected to give a reliable answer on the maximum depth of convection in the mantle. Gravity anomalies are effected by hydrodynamic forces in the mantle and can be calculated only from a model which considers the response of the mantle to the slab. The ambient state of the mantle, which depends
on the extent of convection, is needed to determine this response.
Models were also constructed which showed that: short term irregularities in slab motion would not significantly perturb the thermal state of the slab; once a slab has halted, it is not likely to remain seismically active for much greater than 10 my; and, about 50 my is needed for subducted continental crust to heat up due to its radio-activity.
33 TABLE 2.1: A summary of parameters used for temperature
field calculations for different models. Phase changes are listed in Appendix A. "M" refers to MacDonald (1959) conductivity; "S" to
Schatz (1970) conductivity; and "ML" to Mac-Donald conductivity below 30 km and lattice conductivity above 30 km. "A35" refers to value of parameter above 35 km; "B35" refers to value below 35 km. Geotherms I and 3 are shown in Figure 2.1. Geotherm 4 is in con-ductive equilibrium with a flux of 45 erg/cm 2
0L 41 Table 2.1 Figure Subduction velocity cm/yr 2.2 8 2.3 8 2.4 8 2.5 8 2.6 8 2.7 8 2.8 8 2.9 8 2.10 0 2.11 0 2.14 1 2.15 1 Phase Conductivity changes 1,2a,3 M 1,2a,3 M 1,2a,3 M 1,2a,3 M 1,2a,3 S 1,2a,3 S 2b M 1,2a,3 M 1,2a,3 M 1,2a,3 M - HM - ML Ax km IAz km I 10 18 18 10 10 10 10 10 10 12 16
Shear heating Geotherm 10- erg/cm2 sec 16 16 16 16 16 16 16 16 0 0 1 A35 16 B35 16
Dip Radioactive heat 10-8 erg/gm sec 23 A465 1.7 B465 23 A465 1.7 B465 23 A465 1.7 B465 23 A465 1.7 B465 23 A465 1.7 B465 23 A465 1.7 B465 1.5 23 A465 1.7 B465 23 A465 1.7 B465 23 A465 1.7 B465 410 A30 1.5 B30 410 A30 1.5 B30 Points translated per step Temperature iterations per step w z I I
FIGURE CAPTIONS Figure 2.1
Figure 2.2
Figure 2.3
Figure 2.4
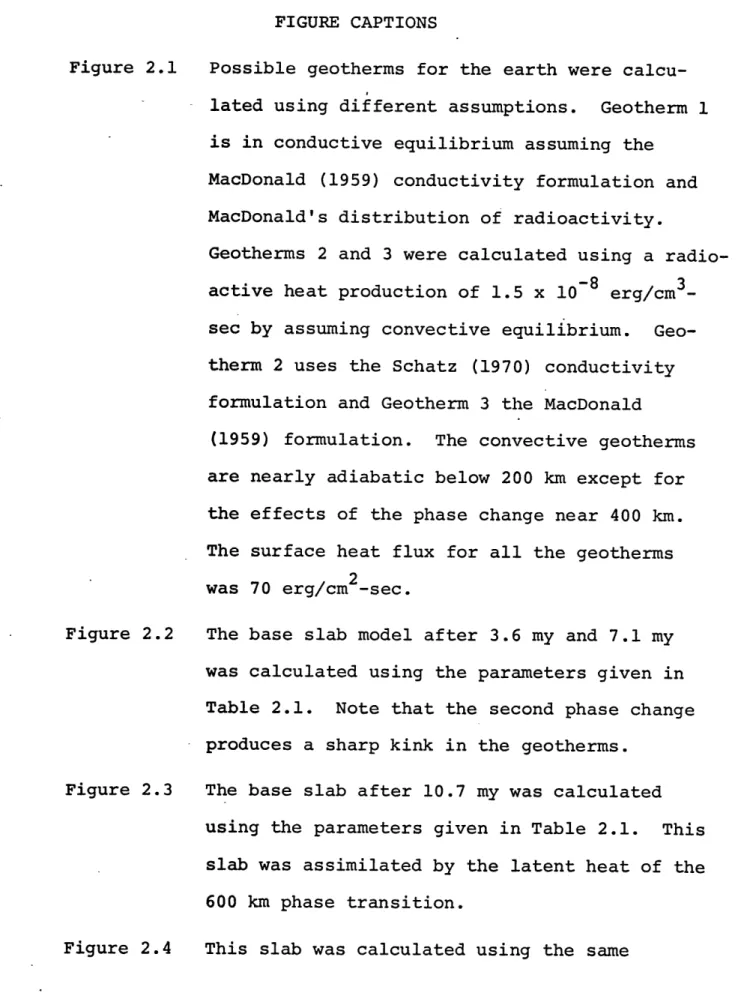
Possible geotherms for the earth were calcu-lated using different assumptions. Geotherm 1 is in conductive equilibrium assuming the
MacDonald (1959) conductivity formulation and MacDonald's distribution of radioactivity.
Geotherms 2 and 3 were calculated using a radio-active heat production of 1.5 x 10⁻⁸ erg/cm 3_ sec by assuming convective equilibrium. Geo-therm 2 uses the Schatz (1970) conductivity
formulation and Geotherm 3 the MacDonald
(1959) formulation. The convective geotherms are nearly adiabatic below 200 km except for the effects of the phase change near 400 km. The surface heat flux for all the geotherms was 70 erg/cm 2-sec.
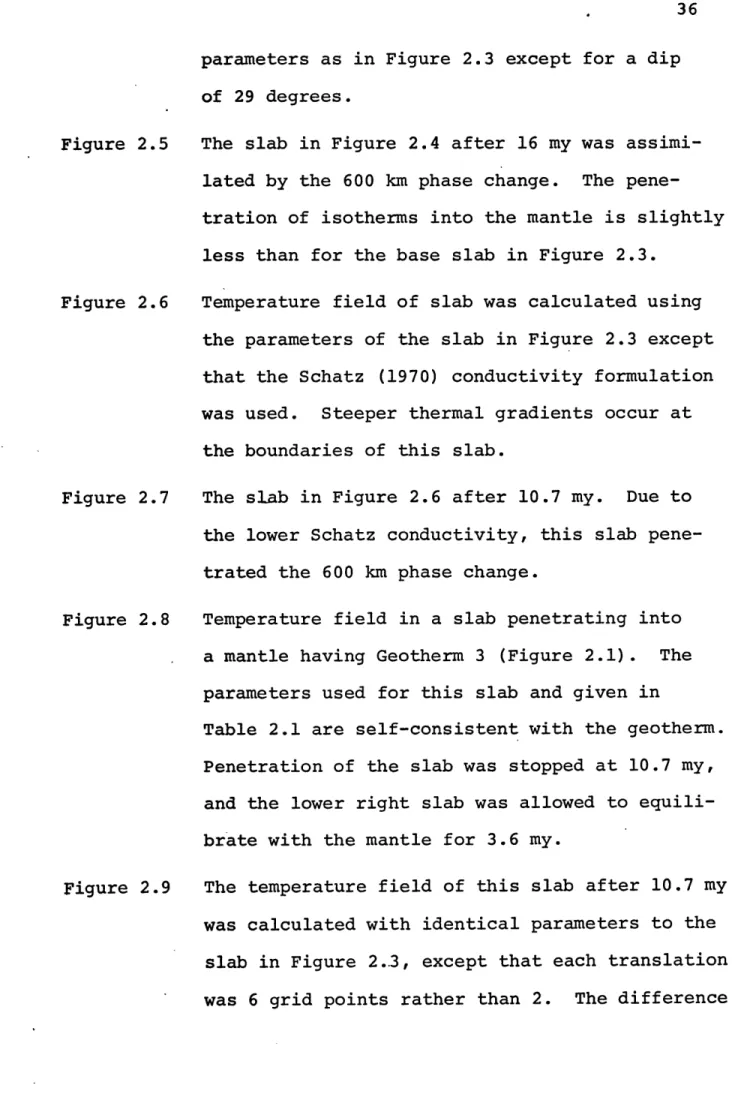
The base slab model after 3.6 my and 7.1 my was calculated using the parameters given in
Table 2.1. Note that the second phase change produces a sharp kink in the geotherms.
The base slab after 10.7 my was calculated using the parameters given in Table 2.1. This
slab was assimilated by the latent heat of the 600 km phase transition.
36 Figure 2.5 Figure 2.6 Figure 2.7 Figure 2.8 Figure 2.9
parameters as in Figure 2.3 except for a dip of 29 degrees.
The slab in Figure 2.4 after 16 my was assimi-lated by the 600 km phase change. The pene-tration of isotherms into the mantle is slightly less than for the base slab in Figure 2.3.
Temperature field of slab was calculated using the parameters of the slab in Figure 2.3 except that the Schatz (1970) conductivity formulation was used. Steeper thermal gradients occur at the boundaries of this slab.
The slab in Figure 2.6 after 10.7 my. Due to the lower Schatz conductivity, this slab pene-trated the 600 km phase change.
Temperature field in a slab penetrating into a mantle having Geotherm 3 (Figure 2.1). The parameters used for this slab and given in
Table 2.1 are self-consistent with the geotherm. Penetration of the slab was stopped at 10.7 my, and the lower right slab was allowed to equili-brate with the mantle for 3.6 my.
The temperature field of this slab after 10.7 my was calculated with identical parameters to the
slab in Figure 2..3, except that each translation was 6 grid points rather than 2. The difference
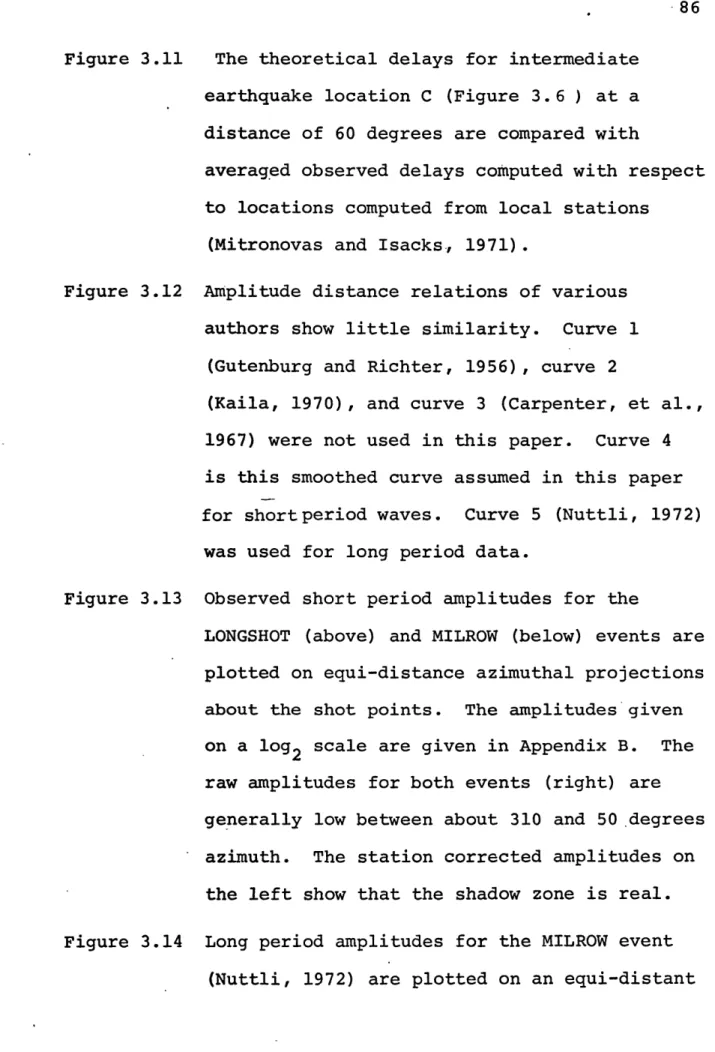
Figure 2.10
Figure 2.11
Figure 2.12
Figure 2.13
between the two slabs is barely noticeable. This confirms that the numerical scheme used to translate the slab is a small source of
error in the calculations and that irregularities in slab motion on a time scale of a million
years would have little effect on the thermal regime.
The thermal field of the lower slab in Figure 2.2 after the slab was left at rest for an additional 3.6 my. Note that equilibration is retarded in the vicinity of the phase boundary on the bottom part of the slab.
The thermal field of the slab in Figure 2.5 was left at rest for an additional period of
48 my. The temperature anomaly becomes pro-gressively broader with time. It is unlikely that the upper slab would be seismically active. Gravity field calculated for the base slab
model in Figure 2.3 (1), and the upper (3)
and lower (2) parts of Figure 2.2. This gravity anomaly is much larger than observed. 'The
horizontal zero point in Figures 2.2 and 2.3 is at 770 km.
The gravity field.calculated for the slab in Figure 2.8, upper left (1), upper right (2),
Figure 2.14
Figure 2.15
and lower left (3). The horizontal zero point in Figure 2.8 is at 770 km. These anomalies are also much larger than observed.
The temperature in a subducted continent is shown after 7.7 my (above). The base of the crust is indicated by M. After remaining
stationary for an additional 47 my, a thermal maximum has formed in the subducted crust
(be-low).
Temperature field in subducted continent after 10 my was effected by extreme frictional heating along the fault plane. The highly radioactive continent crust is indicated by hatching.
V~t toI
2
03
0
uO
0-w
0
200
400
600
DEPTH, KM
FIGURE 2.1 V 040
500
-1500
200--
PHASE BOUNDARY
t 3.6 my
E
S0
-500
I
-1000
F-
1500
a-0
-1500
200-
400--2000
2000
t.=
7.1 my
0
200
400
600
DISTANCE,
Km
FIGURE 2.2 owmw41 0
-
500
1000
0-500-500
0C
-2000
2000
PHASE BOUNDARY
w0o
CDt110.7
my
0
200
400
600
DISTANCE, KM
FIGURE 2.3V 0 u* % U
0
750
1500
20
OF-a.
9.5 My
w
0
200
400
600
800
1000
DISTANCE, KM
FIGURE 2.4 tj 0 to V tj0* 500 1000 - 1500 0 0-E PHASE BOUNDARY C- 0 W 0- 16 My 2000 0 2250 0 200 400 600 800 1000 1200 DISTANCE, Km RA FIGURE 2.5
w 0
0
-1500
O1-cuj w ~5.2
M y
co
0
0
200
400
600
DISTANCE, KM
FIGURE 2.6o
--
500
1000
1500 00-PHASE BOUNDARY
0 00.7 My2000
w
00
200
400
600
DISTANCE, KM
FIGURE 2.7I0 -500 - 1500 - -0
g
3.6 My 7.1 My to - -- 500 500-- 1500 ' -- - -1500. -10.7 My 14.2 My 0 0 400 800 0 400 800 DISTANCE, KM FIGURE 2.80 0 v
a,
0 0----
750
1500
No I-sw
0 0-0 0-00
200
400
DISTANCE,
KM
FIGURE 2.9o
-
500
1000
1500-0
0
C'J
0
-0
10.7
M y
O
-- 2000
0
O
0
200
400
600
-DISTANCE, KM
FIGURE 2.10DISTANCE, KM FIGURE 2.11 49 = I~O 0.0 0
FREE
AIR
GRAVITY,
MGAL
0
100
200
300
0
C/)Z
-00
O
.
O
o-
0 0
O
Os0 0.
0
0-C\l
~J.. o
DISTANCE,
KM
L FIGURE 2.13 u to000 3E1000 aO
o
10 my 0 00
200
400
DISTANCE, KM
L, FIGURE 2.1453 500 t=7.7my 0-0 500 -1000 0 ~ t=55 my O100 200 300 400
DISTANCE, KM
FIGURE 2.15CHAPTER 3. SEISMIC WAVE TRANSMISSION THROUGH SLABS
Slabs of oceanic lithosphere subducted beneath island arcs at oceanic trenches are now believed to be the site of intermediate deep focus earthquakes and anomalous seismic transmission (e.g., Isacks et al., 1968; Utsu, 1971). Velocity and amplitude anomalies have been used to
demon-strate the existence of the slab (Davies and McKenzie, 1969; Sorrells et al., 1971; Mitronovas and Isacks, 1971; Toksoz et al., 1971; Jacob, 1970, 1972; Abe, 1972a,b; Davies and Julian, 1972). Ray theory calculations have been made for only ad hoc, grossly simplified, or analytic models. Davies
and Julian's model is probably the most realistic so far used. The purpose of this chapter is to use the thermal models of slabs calculated in the previous chapter to
con-struct seismic models and to use ray theory to predict effects which can be compared with observations of P-waves
at teleseismic distances. Local observations are too
difficult to interpret since the upper mantle may vary region-ally. Travel times and amplitudes of teleseismic phases
other than P are too poorly known to confidently look for slab effects. Modeling of the attenuation of high frequency P and S-waves is beyond the scope of this chapter.
A numerical approach is necessary to model the trans-mission of P-waves through slabs, as analytic solutions cannot give sufficient resolution. A ray tracing method
55 (Julian, 1970) was used in preference to more complete
solution. Even this simplified calculation proved so pro-tracted that an exhaustive development of models would have been uneconomical. Although direct calculation of amplitude was not practical by the numerical method used, the amplitude
could be quantitatively estimated from the spacing of emerged rays. Models were constructed mainly to test the sensitivity of travel time and amplitude to the location of a source
with respect to the slab. The velocity distribution through which rays were traced was obtained from numerically
calculated thermal models (Chapter 2).
3.1 Geology of source regions
The Tonga and Aleutian slabs were selected for study, since data from suitable seismic events are available and since the geometric parameters relevant for constructing a thermal model are reasonably known. An event from the Kurile area was also used for data. A short review of the geology and geometry used in constructing the thermal and velocity models is in order.
The activities of the nuclear testing range on Amchitka island (Figure 3.1) have included the passive location of earthquakes by a local network of seismometers (Engdahl,
1971). Reliable epicentral locations also exist for a region near Adak island (Murdock, 1969a,b). The seismic zone dips
about 60 degrees to the north and extends to about 200 km depth in those regions. Geological evidence indicates that the short length of the Aleutian slab is due to recently
commenced subduction. The initiation of island arc volcanism in the Aleutians has been dated at 1.8 my from studies of the distribution of volcanic ash in deep-sea cores (Hays and Ninkovich, 1970). This upper Pliocene age is consistent with the geology on land (Burk, 1965). Several deep-sea sedimentary fans were beheaded from their source region when subduction began in the Pliocene (Mammerickx, 1970).
A thermal model was calculated using the subduction rate normal to the arc at Amchitka island, 4.5 cm/yr (Figure
3.2) (Morgan, 19687-LePichon, 1968). The arc in this region has a radius of curvature of 12 degrees and extends suffi-ciently far from Amchitka that no teleseismic rays would emerge from the ends of the slab.
Deep earthquakes occur down to about 650 km depth in the Tonga-Kermadec region (Sykes, 1966). As the date of initiation of subduction has not been determined from
geology, the thermal model for the Tonga slab was calculated to obtain the observed length of the slab. A subduction rate of 8 cm/yr and a dip of 45 degrees were assumed in the model. The actual subduction rate decreases southward from 9 cm/yr to 5 cm/yr (Morgan, 1968; LePichon, 1968). The subduction rate of the Kurile slab is about 8 cm/yr (Morgan, 1968;
57 to the Tonga slab. One thermal model (Figure 2.3) was used to model both long slabs.
3.2 Computations of velocity models
These velocity models were constructed from numerical thermal models calculated for parameters relevant to the Aleutian, Tonga, and Kurile slabs using a linear relation, including phase changes, as given by
v(x,z) = v0 (z)+av/aT(T0 (z)-T(x,z))+m av/am(m0(z)-m(xz)) (3.1) where
V = seismic velocity
T = calculated temperature
0 (subscript) = unperturbed quantity
x,z = horizontal and vertical coordinates m = amount of phase present
Model CIT 204 (Julian and Anderson, 1968) was used as a base from which to calculate anomalous velocities and delays.
The low velocity zone below 80 km and the rapid velocity gradients at 400 and 600 km are probably caused by phase
changes (e.g., Anderson and Sammis, 1970; Ringwood, 1970, 1972). The amount of seismic velocity increase and the position of the phase change were adjusted such that the
58 and seismic velocity profiles (Figure 3.3). A linear slope of the 400 km phase transition curve of 9*C/km was used
(Ringwood, 1970), and the width of the phase change adjusted to give self-consistency. Partial melting was assumed to cause a variation of 0.5 km/sec over a temperature range of
300*C. The solidus curve, adjusted to give self-consistency, was in reasonable agreement with high pressure experiments
(Lambert and Wyllie, 1970). The 600 km phase change was not included in the calculations.
A trade off exists between the thermal coefficient of velocity (3v/3T) and the assumed unperturbed geotherm in the mantle. It is also not clear that the laboratory value of
the parameter is relevant to the mantle. A coefficient of -0.5 x 10⁻³ km/sec*C has been measured in short term
experiments on several possible materials (Anderson et al., 1968). However, several strongly multivariant phase transi-tions which cannot be calibrated directly from the dependence of seismic velocity on depth may occur in the mantle.
Possible reactions include the formation of garnet, olivine, and jadeite at the expense of aluminous pyroxene, spinel,
and plagioclase (Green and Ringwood, 1967b; O'Hara et al., 1971). There is insufficient experimental data to correct directly for these reactions and for partial melting in a velocity model. The gross geometry of the slab is well
enough determined from the location of deep earthquakes that it is better to calibrate the coefficient of velocity with
observed travel time anomalies to a predetermined slab geom-etry than it is to adjust the slab shape to use a
precon-ceived velocity coefficient.'
Travel times from the LONGSHOT event and the Aleutian slab model were used to obtain the value of the thermal
coefficient of seismic velocity used to calculate theoretical ray paths. The observed advance for rays down dip of the slab is slightly over 2 sec (Jacob, 1972; Abe, 1972a). This value, relatively independent of shot location, was given by a coefficient, which does not include the effect of partial melting, of -9 x 10~ km/sec*C (Figure 3.4). In agreement with Jacob (1972) a velocity contrast of about 10% is
re-quired. The resulting velocity models are shown in Figure 3.5 and Figure 3.6.
3.3 Theoretical ray paths
Theoretical travel times and ray paths were calculated for 6 surface locations on the Aleutian velocity model, 4 surface locations on the long slab model, and 7 intermediate depth locations on the long slab model. The computed travel times and assumed take-off parameters are plotted as a func-tion of the emergence point of the rays on Figures 3.7, 3.8, and 3.9. The models are symmetric with respect to the dip of the slab.
The Aleutian locations were spaced at 0.1 degree [11 km] intervals (Figure 3.2). The travel time anomalies were found