Carbon isotope discrimination during litter decomposition can be explained by selective use of substrate with differing δ13C
33
0
0
Texte intégral
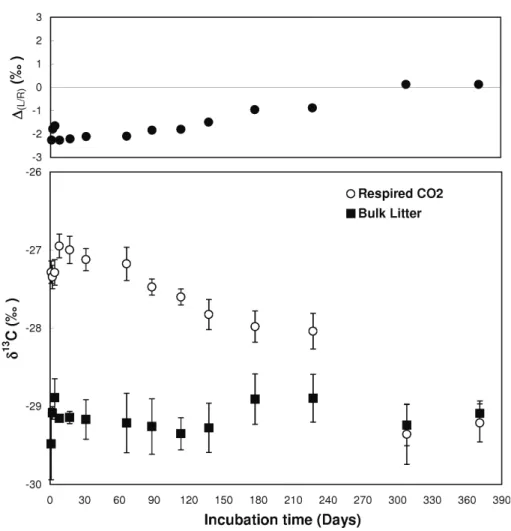
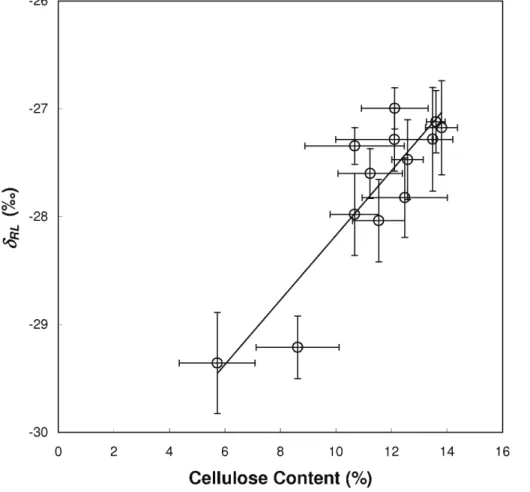
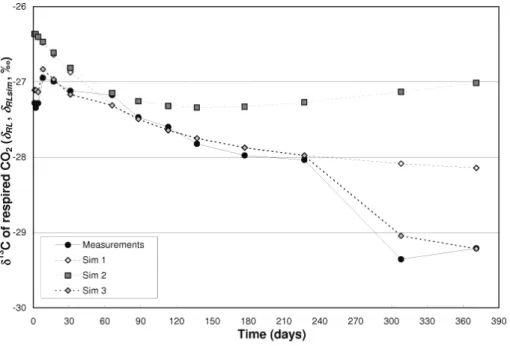
Figure

+5
Documents relatifs