O R I G I N A L A R T I C L E
Molecular and biochemical alterations in tubular
epithelial cells of patients with isolated
methylmalonic aciduria
T. Ruppert
1
, A. Schumann
1,2,3,4
, H.J. Gröne
5
, J.G. Okun
1
, S. Kölker
1
, M.A. Morath
1
and S.W. Sauer
1,
*
1
Department of General Pediatrics, Division of Neuropediatrics and Metabolic Medicine, University Children’s
Hospital Heidelberg, D-69120 Heidelberg, Germany,
2Division of Metabolism and Children
’s Research Center,
University Children’s Hospital, Zurich, Switzerland,
3Institute of Physiology,
4Center for Integrative Human
Physiology, University of Zurich, Zurich, Switzerland and
5Department of Cellular and Molecular Pathology,
German Cancer Research Center (DKFZ), Heidelberg, Germany
*To whom correspondence should be addressed. Tel: +49 62215637399; Fax: +49 6221566391; Email: [email protected]
Abstract
Methylmalonic acidurias (MMAurias) are a group of inherited disorders in the catabolism of branched-chain amino acids, odd-chain fatty acids and cholesterol caused by complete or partial deficiency of methylmalonyl-CoA mutase (mut0and mut-subtype
respectively) and by defects in the metabolism of its cofactor 5′-deoxyadenosylcobalamin (cblA, cblB or cblD variant 2 type). A long-term complication found in patients with mut0and cblB variant is chronic tubulointerstitial nephritis. The underlying
pathomechanism has remained unknown. We established an in vitro model of tubular epithelial cells from patient urine (hTEC; 9 controls, 5 mut0, 1 cblB). In all human tubular epithelial cell (hTEC) lines we found specific tubular markers (AQP1, UMOD,
AQP2). Patient cells showed disturbance of energy metabolism in glycolysis, mitochondrial respiratory chain and Krebs cycle in concert with increased reactive oxygen species (ROS) formation. Electron micrographs indicated increased autophagosome production and endoplasmic reticulum stress, which was supported by positive acridine orange staining and elevated levels of LC3 II, P62 and pIRE1. Screening mTOR signaling revealed a release of inhibition of autophagy. Patient hTEC produced and secreted elevated amounts of the pro-inflammatory cytokine IL8, which was highly correlated with the acridine orange staining. Summarizing, hTEC of MMAuria patients are characterized by disturbed energy metabolism and ROS production that lead to increased autophagy and IL8 secretion.
Introduction
Methylmalonic acidurias (MMAurias) are an etiologically heterogeneous group of inherited disorders in the catabolism of L-isoleucine, L-valine, L-methionine and L-threonine as well as odd-chain fatty acids and cholesterol with an cumulative preva-lence of 1:50 000–1: 100 000 newborns (1). Isolated MMAurias are caused by complete or partial deficiency of the mitochondrial enzyme methylmalonyl-CoA mutase catalyzing the conversion
of methylmalonyl-CoA to succinyl-CoA (MCM; EC 5.4.99.2; mut0
enzymatic subtype or mut-subtype, respectively), or by defects
in the uptake, transport or synthesis of its cofactor 5′-deoxyade-nosylcobalamin (cblA, cblB or cblD variant 2 type). Affected indivi-duals display elevated levels of methylmalonic acid (MMA), propionate, 3-hydroxypropionate and 2-methylcitrate in tissues and bodyfluids (2). Neonatal sepsis-like metabolic crisis after a short symptom-free period may be thefirst and life-threatening
Received: June 3, 2015. Revised and Accepted: September 22, 2015
© The Author 2015. Published by Oxford University Press. All rights reserved. For Permissions, please email: [email protected]
Human Molecular Genetics, 2015, Vol. 24, No. 24 7049–7059
doi: 10.1093/hmg/ddv405
Advance Access Publication Date: 29 September 2015 Original Article
manifestation of MMAurias (2). Recurrent acute metabolic crises are often triggered by catabolic state, e.g. due to febrile illness. Major long-term complications are neurological impairment (3,4) and chronic tubulointerstitial nephritis (cTIN) with progres-sive impairment of renal function (5). Patients with mut0and cblB
defects bear the highest risk to develop cTIN (5). Severe disturb-ance of mitochondrial energy metabolism due to synergistic action of accumulating toxic metabolites, in particular propio-nyl-CoA, has been suggested to underlie neurodegenerative changes (6). Little is known about the pathomechanism of renal disease. Mcm−/−mice only survive 48 h after birth limiting inves-tigation of long-term complications (7). Stable expression of Mcm in the liver of Mcm−/−mice has recently been shown to rescue neonatal lethality but does not prevent renal dysfunction (8). Proximal tubular cells of these mice displayed enlarged mito-chondria with disorganized cristae indicating mitomito-chondrial dys-function, decreased glomerularfiltration rate, but no clear signs of inflammation or cTIN were reported. Similar morphological changes have been described in patients (9), however combined with infiltration of immune cells. Therefore, the renal phenotype of the existing mouse models rather resembles tubular atrophy. Interestingly, it has been found that the pattern of excreted cells in the urine correlates with the progression nephritis (10). To gain further insight in the renal pathogenesis we therefore es-tablished and characterized an in vitro model of tubular epithelial cells gained from urine of affected patients. As additional con-trols we used tubular epithelial cells from propionic aciduria (PAuria) patients. This disease is caused by deficiency of the en-zyme propionyl-CoA carboxylase catalyzing the decarboxylation of propionyl-CoA to methylmalonyl-CoA and, therefore, lying one enzymatic step before MCM. Importantly, PAuria patients display neurological disease and myopathies but do not typically develop cTIN.
Results
Characterization of human proximal tubule cells
We purified human tubular epithelial cells (hTEC) from 9 healthy controls (Co_1–9), 3 PAuria patients (PA_1–3), 5 mut0patients
(mut0_1–5) and one cblB patient (cblB_1). Since cblB patients
have the same risk to develop cTIN (5) and hTEC of the latter pa-tient did not differ from hTEC of mut0in any of the performed
ex-periments, we combined both disease subtype under MMAuria patients for data analysis in the text and refer to‘mut’ in figures due to space limitations. All included mut0patients showed
in-creased creatinine clearance as well as elevated MMA concentra-tions in urine and plasma (data not shown). Age range of controls was between 3 and 37 years, mut0patients ranged between 11–40
years and PA patients between 1 and 7 years (Table1).
Next, hTEC were tested for expression of specific marker pro-teins for different kidney segments. Supplementary Material, Figure S1 shows representative immunoblots for these markers (AQP1, UMOD, AQP2) and MCM. hTEC from control and patients with MMAurias express markers of the proximal and distal tubule as well as of the thick ascending limb. A high expression of Mcm is observed in control cells. In mut0_1, 2 we could not
detect MCM, whereas mut0_3, 5 and cblB_1 show reduced
expres-sion. This is probably due to the fact that the anti-MCM antibody recognizes the whole enzyme, thus may interact with parts of non-functional enzyme present in these cells. The cells derived from healthy controls and MMAuria patients were investigated for MCM activity using 14C incorporation assay confirming
the enzymatic defect (data not shown). Stimulation with
adenosylcobalamin showed that all mut0cell lines are
unrespon-sive to cofactor stimulation (data not shown). Consistently, MMAuria patient hTEC showed increased MMA secretion (Fig.1). Summarizing, hTEC lines gained from human urine express characteristic markers of tubular epithelial cells. Further, MMAuria patient cell lines display the corresponding enzymatic and metabolic phenotype.
Profiling energy metabolism
As disturbance of energy metabolism is thought to play a major role in the pathogenesis of MMAurias, we assessed cellular en-ergy homeostasis in hTEC on various levels. First, we determined mitochondrial respiration in DMEM+10% FCS and Krebs Ringer buffer (KRB) pyruvate (5 m) to directly stimulate mitochondrial respiration. hTEC of PA and MMAuria patients displayed de-creased mitochondrial respiration in standard medium, whereas only cells of MMAuria patients revealed a diminished ability to respire on pyruvate (Fig.2A). It has been previously shown that the metabolite propionyl-CoA accumulating in PA and MMAuria inhibits pyruvate and 2-oxoglutarate dehydrogenase complex (11). Therefore we measured the mitochondrial pyruvate and 2-oxoglutarate catabolism by radiometric analysis. hTEC of PA pa-tients showed a decreased14C-CO
2production from pyruvate,
whereas 2-oxoglutarate catabolism was slowed in cells from MMAuria patients (Fig.2B). Next, we analyzed energy metabol-ism on the level of single enzymes, i.e. respiratory chain and gly-colysis. Of note, phosphofructokinase (PFK1) activity was specifically reduced in hTEC of MMAuria patients (Fig.2C). Lac-tate dehydrogenase activity was increased in these cells. Next we aimed to determine activity of respiratory chain complexes,
Table 1. Included MMAuria patients
hTEC Age Mutation MMA in plasma (μM)
mut0_1 22 T862C, T862C 4112 (±1430)
mut0_2 23 C982T, C982T 4239 (±2845)
mut0_3 18 G607A, G607A 1230 (±414)
mut0_4 11 G607A, C1105Ts 3278 (±1527)
mut0_5 16 T862C, A1157G 4579 (±1527)
cblB_1 40 C556T, Arg186W 3143 (±453)
Figure 1. Characterization of hTEC. In line with their genotype, hTEC of MMAuria patients displayed elevated MMA production compared with control cells. Data are presented as dot plots, ctrl n = 9, mut n = 6 *P < 0.05.
but we failed to gain mitochondrial preparations from hTEC of MMAuria patients. We tested different systems for cell homogen-ization (disruption with needles of different gauges, various Potter-Elvehjem homogenizers) and subcellular fractionation techniques (differential centrifugation versus density gradient
centrifugation), but we were not able to achieve a sufficient qual-ity and quantqual-ity of mitochondrial enrichment. To circumvent the need of mitochondrial fraction, we used digitonin permeabilized cells to record respiratory chain complex activities (12). In line with the notion of decreased mitochondrial respiration due to
Figure 2. Dysfunction of energy metabolism. To assess energy metabolism in hTEC we performed metabolicflux experiments and recorded single enzyme activities of major pathways in control cells as well as hTEC of MMAuria and PAuria patients. (A) First, we analyzed mitochondrial respiration standard DMEM and KRB+4 mM pyruvate. hTEC of MMAuria and PAuria patients displayed reduced mitochondrial respiration in DMEM, whereas only MMAuria patient hTEC had a lower oxygen consumption on the substrate pyruvate. In line with thisfinding, (B) both patient cell lines revealed a reduced14CO production on the substrate14C-2-oxoglutarate,
but break down of14C-pyruvate was only altered in PAuria hTEC. (C) Analysis of single enzymes of glycolysis (HK: hexokinase; PFK: phosphofructokinase; TPI: triose
phosphate isomerase; GAPDH: glyceraldehydphosphat-dehydrogenase; PGM: phosphoglycerate mutase; E: enolase; PK HA: pyruvate kinase M2 tetramer; PK LA: pyruvate kinase M2 dimer; LDH: lactate dehydrogenase) showed a strongly diminished PFK and an increase of LDH activity in hTEC of MMAuria patients. Adding to thefinding of disturbed mitochondrial energy metabolism in these cell lines, we found a reduction of cytochrome c oxidase (D) and aconitase (E; CS, citrate synthase; MDH, malate dehydrogenase, FUM, fumarase; IDH, isocitrate dehydrogenase; ACO, aconitase). Data are presented as dot plots (A, B and D) or box plots (C and E), ctrl n = 5, PA n = 3, mut n = 6 * P < 0.05.
disturbed integrity of mitochondrial membranes, cytochrome c oxidase activity was diminished in hTEC of MMAuria patients (Fig.2D).
Using this approach we also determined activity of citrate cycle enzymes. In hTEC of MMAuria patients we found decreased activity of aconitase (Fig.2E). Other investigated proteins of citrate cycle were unchanged in their activity.
Generation of reactive oxygen species
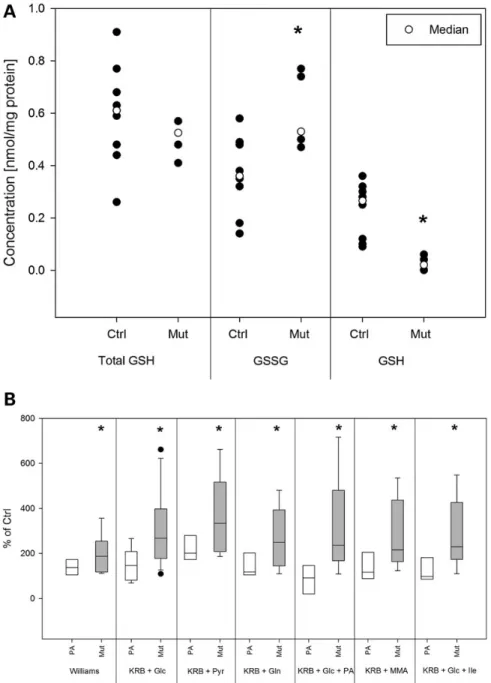
Oxidative stress is commonly found in conditions of disturbed energy metabolism, particularly involving the respiratory chain. First, we evaluated glutathione status as a general marker
of increased reactive oxygen species (ROS) generation. hTEC of MMAuria patients indeed showed decreased levels of reduced and increased levels of oxidized glutathione (Fig.3A). Next, we used H2DCFDA staining and FACS analysis to measure the actual
ROS generation (Fig.3B). Cells were cultivated in KRB and energy substrates (glucose, pyruvate or glutamine) in the presence or absence of PA, MMA and isoleucine. Regardless of the supplied substrate, hTEC of MMAuria patients generated more ROS than control cells or PA patient cells. Incubation of MMAuria cells in Williams′ medium E which is enriched with anti-oxidative agents (i.e. glutathione, ascorbic acid) did reduce ROS production compared with the condition KRB + pyruvate stimulating mito-chondrial activity (P = 0.03).
Figure 3. Oxidative stress in hTEC of MMAuria patients. Oxidative stress and ROS production were investigated by analyzing glutathione status (A) as well as by the ROS sensitive dye H2DCFDA (10 μM, (B). Total glutathione content was unchanged in hTEC of MMAuria patients, but the amount of oxidized glutathione (GSSG) was increased
and the level of reduced glutathione (GSH) diminished in these cells. FACS analyses with H2DCFDA stained cells showed increased formation of ROS in hTEC of MMAuria
patients in all tested conditions, i.e. Williams E medium, KRB supplemented with glucose (Glc), pyruvate (Pyr), glutamine (Gln), propionic acid (PA), MMA or isoleucine (Ile; each 5 mM). Data are presented as dot plots (A) or box plots (B), ctrl n = 5, PA n = 3, mut n = 6 *P < 0.05*.
Induction of autophagy
Electron micrographs of hTECs showed lamellar bodies and di-lated endoplasmic reticulum (ER) indicative of autophagic changes and ER stress respectively (Fig.4). To this end we stained hTEC with acridine orange and analyzed the amount of green fluorescing cells (staining of autophagosomes) by FACS analysis. MMAuria patient cells displayed elevated green staining indicat-ing enhanced autophagic processes (Fig.5A). Moreover, increased levels of the autophagy marker proteins LC3 II and p62 in these cells corroborate the rise in autophagosomes (Fig.5B) which was not found in hTEC of PA patients (Fig.5C). Application of ra-pamycin as control experiment led to strong induction of autop-hagy and increased levels of LC3 II and p62.
mTOR complex is a master regulator of autophagy and itself tightly regulated by the energetic state of the cell and nutrient availability, most importantly branched-chain amino acids (13). Of note, thefinal degradation pathway of the latter is interrupted in MMAuria due to the defect of MCM. To stimulate the mTOR pathway and its response to nutritional signals we cultivated hTEC under low protein conditions, i.e. 0.5 and 1% FCS, and high protein conditions, i.e. 20% FCS. In MMAuria patients the recommended therapeutic regiment aims to reduce the daily protein intake which is a major risk factor for metabolic decom-pensation. We studied the levels of mTOR, Phospho-mTOR (Ser2448), Phospho-Raptor (Ser792) PRAS40, Phospho-PRAS40 (Thr246), RagC in hTEC of MMAuria as well as PA patients relative to control cells used in the same experiments. Phospho-Raptor and RagC levels remained unchanged in hTEC of MMAuria and PAuria patients (data not shown), whereas MUT-deficient cells responded to an increasing protein load with decreasing ratios of Phospho-mTOR to mTOR as well as of Phospho-PRAS40 to PRAS40 (Fig.5D). Decreasing phosphorylation level of these pro-teins reverses the inhibition of autophagy by mTOR complex. Neither hTEC of healthy donors nor of PAuria patients (Fig.5E) showed this pattern of mTOR regulation. Next, we examined whether the pro-autophagic modulation of mTOR complex by protein loading is associated with increased LC3 II und p62 levels. hTEC of MMAuria patients were indeed characterized by elevated levels of these proteins when media were supplemented with 20% FCS (Fig.5B). Decreasing FCS concentrations to 1 and 0.5%
abolished this effect and MCM-deficient cells were undistin-guishable from control cells. Again, hTEC of PAuria patients responded to this treatment like control cells confirming the spe-cificity of our results (Fig.5C). AMPK is a key sensor for the cellular energetic state and modulates mTOR activation. However, we could notfind increased phosphorylation of AMPK in hTEC of MMAuria or PAuria patients (data not shown).
As a sensor of ER stress we studied the ER transmembrane protein phosphorylated inositol requiring enzyme 1α (pIRE1) again under different FCS conditions (0.5, 1, 20%) revealing an in-crease in pIRE1 (Fig.5B) in MUT-deficient cells but not in hTEC of PAuria patients (Fig.5E).
Inflammatory phenotype
Disturbance of renal tubular energy metabolism is commonly as-sociated with Fanconi syndrome due to lack of energy for tubular transporter. Interestingly, MMAuria patients directly develop cTIN despite impaired energy homeostasis. To gain more insight in the underlying mechanism, we aimed to describe inflamma-tory molecules generated by patient hTEC. We used a Mix-N-Match ELISArray Kits (SABiosciences) for major cytokines released by the proximal tubule, i.e. IL8, MCP1, MIP-1a, MIP-1b, RANTES, TGF-ß. In addition, we analyzed the expression of sev-eral receptors of the complement system CD55, CD46, CD59, CD88 by FACS. Whereas the latter receptors remained unchanged, the Mix-N-Match ELISArray indicated elevated production and secre-tion of IL8 in hTEC of MMAuria patients (data not shown). Using a quantitative IL8 ELISA (Eli-pair Kit, abcam) we determined the amount of this cytokine secreted to the apical and basolateral site of 12-well Transwell plate as well as its intracellular concen-tration. Our experiments confirmed that MMAuria hTEC pro-duced and secreted more IL8 than control or PAuria patient hTECs (Fig.6).
Discussion
To investigate the molecular mechanisms of cTIN in MMAurias, we established tubular epithelial cell lines (hTEC) from affected patients as well as control cell lines from healthy donors and PAuria patients. Molecular characterization of these cells
Figure 4. Alterations in ultrastructure. Electron micrographs of all mut0hTEC provided indication of increased autophagy and ER stress. Figure4shows representative
electron micrographs of mut0_1. Patient hTEC display an increased number of lamellar bodies (A) as well as bloated and disarranged ER structures (B) indicative of
autophagic processes and ER stress respectively.
revealed expression of specific marker proteins of the proximal and distal tubules as well as thick ascending limb to a similar degree in all cell lines. It has previously been shown that the pat-tern of excreted cells in the urine correlates with the progression nephritis (10). Therefore, our hTEC model disease state and damaged area of tubule of the corresponding patients.
Dysfunction of energy metabolism and ROS production
It has previously been shown that in MMAuria and PAuria accu-mulating metabolites can directly inhibit energy metabolism (11,14,15). To evaluate overall energy metabolism in hTEC, we measured mitochondrial oxygen consumption in standard
Figure 5. Autophagy and regulation of mTOR. Specifically hTEC of MMAuria patients showed an increased staining with acridine orange indicating elevated autophagy (A). Since autophagy and mTOR are regulated by the energetic status of the cell, we cultured hPTEC in DMEM supplemented with 0.5, 1 or 20% to simulate low and high protein/ nutritional energy levels. Elevation of FCS content in medium resulted in an up-regulation of LC3 II and p62 levels (B) as well as in a down-regulation of the ratios of phosphorylated to unphosphorylated mTOR and phosphorylated to unphosphorylated PRAS40 (D) in hTEC of MMAuria patients. Moreover, increased pIRE1 levels under high FCS conditions indicated ER stress (B). Similar patterns for alterations in autophagy and ER stress response (C) as well as mTOR signaling (D) were not found in hTEC from PAuria patients. Data are presented as dot plots (A) or mean (B–E), ctrl n = 5, PA n = 3, mut n = 6 *P < 0.05.
DMEM and KRB including pyruvate. hTEC of PAuria and MMAuria patients showed a strong decrease of mitochondrial respiration in DMEM, whereas this decrease was only found for hTEC of MMAuria patients in KRB including pyruvate. Further enzymatic analysis showed decreased activity of PFK1, mitochondrial aconi-tase, OGDHc and cytochrome c-oxidase. PFK1 is a rate limiting enzyme of glycolysis highly regulated by ATP, ADP, AMP, citrate and fructose 2,6-bisphosphate. Of note, we found that 2-methyl-citrate is a strong PFK inhibitor (1 mM∼80% reduction of enzyme activity). Since citrate allosterically inhibits PFK, the observed decrease of PFK activity can be caused by accumulating 2-methylcitrate in hTEC. Alternatively, Tp53-induced glycolysis and apoptosis regulator (TIGAR) has been shown to block PFK ac-tivity in ischemic proximal tubules to protect these from energy depletion and apoptotic cell death (16).
The reduction of mitochondrial respiration as well as cyto-chrome c-oxidase activity in concert with the observed fragility of mitochondria strongly hints to a defect in mitochondrial mem-brane composition. Of note, the same phenomenon was observed in the attempt to purify mitochondria from Mut-deficient mice (17). Reduced activity of cytochrome c-oxidase (18) or even of all re-spiratory chain complexes (9) has been found in kidney biopsies from MMAuria. Taken together thesefindings suggest that mito-chondrial integrity is altered in MMAuria.
The mitochondrial enzymes aconitase bears metal ions in its catalytic center making it highly sensitive to ROS (19) and, conse-quently, its reduced activity in hTEC of MMAuria patients was in-dicating increased ROS production. In line with this notion hTEC of MMAuria patients showed increased levels of glutathione disulfide and a diminished content of reduced glutathione. More-over, using the ROS sensitive dye H2DCFDA (20) we could show
that hTEC generate indeed more free oxygen radicals.
Increased autophagy in hTEC of MMAuria patients
In electron micrographs of mut-deficient hTEC lamellar bodies indi-cated increased production of autophagosomes and autolysosomes. Induction of autophagy has been shown to be a cellular response
to chronic, metabolic mitochondrial stress in kidney cells (21). In-deed, specifically hTEC of MMAuria patients displayed increased levels of LC3 II and p62 under metabolic stress, i.e. high FCS con-tent. Both proteins play a central role in the maturation of the au-tophagosomes (22). Elevation of AO positive stained cells further supports the notion of increased autophagy. mTORC1 is a master regulator of macro-autophagy and a central energy sensor of the cell. Moreover, maintenance and physiological functions of the kidney are critically dependent on mTOR-modulated autophagy (23). To investigate activation status and response of mTORC1 to nutritional signals, we cultured hTEC in DMEM supplemented with 0.5, 1 or 20% FCS. Elevation of FCS content in medium re-sulted in a down-regulation of the ratios of phosphorylated to un-phosphorylated mTOR and un-phosphorylated to unun-phosphorylated PRAS40 in hTEC of MMAuria patients causing an inactivation of mTORC1 and, thereby, of its inhibition of autophagy (24–27).
Interestingly, electron micrographs also displayed bloated ER structures in hTEC of MMAuria patients indicating elevated ER stress. There is growing evidence that mTORC1 and ER stress are linked via the IRE1-JNK pathway (28) and that the crosstalk of this two signaling axis may even orchestrate IL8 secretion (29). Further, autophagy can be activated by IRE1 and eIF-2a with PERK (30). In line with this notion, we found increased con-tent of phosphorylated IRE1a hTEC of MMAuria patients.
Cytokine secretion
Recruitment of immune cells to inflamed tissue and communica-tion at the site of inflammacommunica-tion occurs via cytokines and recep-tors. Screening for the production and release of relevant cytokines in our hTEC lines, we found elevated IL8 levels in and secretion from cells of MMAuria patients. IL8 plays a central role in chronic kidney disease including different forms of neph-ritis and has been shown to be released by tubular epithelial cells (31). Since cytokine secretion and, thereby, activation of immune cells plays a pivotal role in the development of cTIN, we tested whether mitochondrial dysfunction using cytochrome c oxidase as indicator, ROS indicated by H2DCFDA staining, or autophagy
Figure 6. Production and secretion of IL-8. We detected intracellular content as well as secretion to the apical and basolateral compartment of IL8. Only hTEC of MMAuria patients showed increased production and release of this cytokine. Data are presented as box plot, ctrl n = 5, PA n = 3, mut n = 6 *P < 0.05*.
indicated by acridine orange staining would predict the extent of IL8 production and secretion. Indeed, we found a high correlation between acridine orange staining and the amount of IL8 pro-duced and secreted by hTEC of MMAuria patients (Fig.7; IL8 ver-sus ROS production, R² = 0.47; IL8 verver-sus cytochrome c oxidase, R² = 0.55).
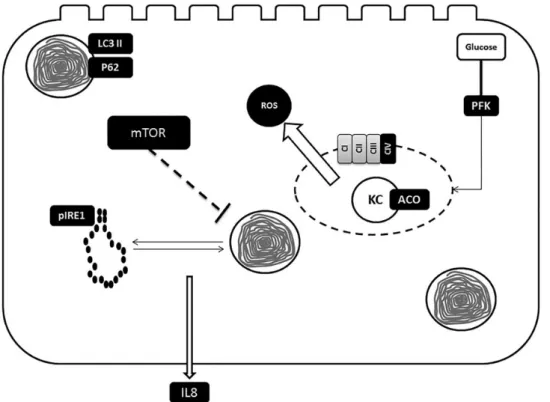
Figure8shows a synopsis of the postulated pathomechanism. Deficiency of MCM leads through a yet unknown mechanism to mitochondrial dysfunction characterized by impaired energy production, ROS generation and loss of mitochondrial integrity. These factors are sufficient to trigger autophagy to clear defect organelles and maintain cellular energy levels. A recent study of Wrobel and colleagues has shown that decreased import of mitochondrial proteins and their subsequent increased cytosolic levels induce unfolded protein response (32). Disturbance of mitochondrial integrity in hTEC of MMAuria patients will result in impaired import of mitochondrial proteins which should ac-cordingly lead via stimulation of unfolded protein response to ER stress. In parallel, dysfunction of cellular energy production releases mTOR-mediated inhibition of autophagy. The interplay of autophagy and ER stress induce production and secretion of IL8.
In summary, our study describes a new in vitro model to study the pathomechanism of cTIN in MMAuria consisting of immorta-lized human, tubular epithelial cells. These cells express specific markers of the proximal and distal tubules as well as the thick as-cending limb. We found in hTEC of MMAuria patients severe dys-function of cellular energy metabolism as well as increased ROS generation and autophagic processes that may lead to increased cytokine (IL8) secretion and development of cTIN.
Materials and Methods
Patient material
The study was performed in accordance with the declaration of Helsinki and was approved by the Institutional Ethics Committee
Figure 7. Correlation of IL8 secretion and acridine orange staining. To link the molecular and metabolic alteration, we tested whether there is a correlation between the mainfindings of our study, i.e. mitochondrial dysfunction, ROS production, autophagy and IL8 secretion. Indeed we found a very high correlation between acridine orange positive stained cells and the extent of secreted IL8.
Figure 8. Synopsis of postulated pathomechanism. hTEC of MMuria patients display reduced activities of cytochrome c oxidase (CIV) and aconitase (ACO) as well as elevated ROS production. These alterations are most likely due to a loss of mitochondrial integrity. Cellular energy depletion and defect mitochondria elicit autophagy. In parallel mitochondrial dysfunction induces ER stress via activation of unfolded protein response. The disturbance of cellular energy generating pathways [mitochondrial (KC, Krebs cycle) and glycolytic ( phosphofructokinase, PFK)] inhibits mTOR activity and, thereby, enhances autophagy. The interplay of ER stress and autophagy activates IL8 release.
of the University of Heidelberg. We received written informed consent for all cell lines included in this study.
Cell culture
Cells were prepared from urine of healthy donors (n = 9) and pa-tients with mut0(n = 5) and cblB (n = 1) defects as well as patients
affected with PAuria (n = 3) and purified tubular epithelial cells (hTEC). Primary epithelial cells of human proximal tubule were cultured in a selective medium containing Dulbecco’s Modified Eagle Medium and Ham’s F12 medium. It was supplemented with fetal calf serum, insuline, hydrocortisone, selenite, transfer-rin, hEGF, NAD and tri-iodo-thyronine. Confluent cells were sub-cultivated until 3rdpassage and, subsequently, immortalized
using pRSVneo vector containing SV40 DNA ( pRNS1). Afterwards, immortalized tubular epithelial cells (hTEC) were characterized regarding morphology and protein expression.
Antibodies
The following antibodies were used for immunoblotting: rabbit polyclonal anit p-AMPK (sc-4778, Santa Cruz); mouse polyclonal anti-methylmalonylcoenzyme A mutase (#ab67869; Abcam, Ca-mebridge, UK); rabbit polyclonal anti-aquaporin 1 (#AB2219; Millipore, Billerica, USA); rabbit polyclonal anti-aquaporin 2 (#A7310; Sigma, St. Louis, USA); sheep polyclonal anti-uromodu-lin (#K90071C; Meridian Life Science, Kampenhout, Belgium); mouse monoclonal anti-beta actin (#A5441; Sigma); rabbit poly-clonal anti-sheep HRP (P0163; Dako, Glostrup, Denmark); goat polyclonal rabbit HRP (P0488; Dako); goat polyclonal anti-mouse HRP (P0447; Dako); rabbit monoclonal anti p-IRE1 (#ab124945; Abcam); rabbit polyclonal anti LC3 (#L7543; Sigma, St Louis, USA); rabbit polyclonal anti p62 (#sc25575; Santa Cruz).
Immunoblotting
Immunoblotting was performed as previously described (33). Cells were cultivated until 80% confluence. Monolayers were col-lected in lysis buffer composed of 1 m EDTA (Merck, Darmstadt, Germany), 20 m imidazole (AppliChem GmbH, Darmstadt, Ger-many), 250 m sucrose (VWR, Leuven, Belgium) containing pro-tease inhibitors (Roche Diagnostics, Mannheim, Germany). Protein concentration was determined using Pierce BCA Protein Assay Kit (ThermoScientific, Rockford, USA). Samples [20 μg pro-tein/lane] were diluted in Laemmli sample buffer (Bio-Rad, Her-cules, CA, USA) and heated to 95°C for 6 min followed by sodium dodecyl sulfate (SDS) polyacrylamide gel electrophoresis (PAGE) and blotting on nitrocellulose membranes (Bio-Rad, Mun-ich, Germany). Membranes were blocked 2 h at room temperature in non-fat dry milk (Bio-Rad, Hercules, CA, USA) followed by over-night incubation at 4°C with primary antibodies. After washing blots were incubated with peroxidase-conjugated secondary antibodies, washed again and visualized by Immun-Star en-hanced chemiluminescence (Bio-Rad, Hempstead, UK). For quantitative analyses of western blots a FusionExpress system from peqlab was applied.
Mcm activity
Cells derived from human urine were classified as having mut0
and cblB mutations by the assay of MCM activity. MCM activity was assayed in crude cell homogenates with (total MCM) and without (apo-MCM) the cofactor AdoCbl (50 mol/l) as described before (34).
Oxygen electrode
By using computer-supported high-resolution Oroboros 1 oxy-graph system (Paar, Graz, Austria) mitochondrial respiratory rate was determined according to a previously described protocol (35). hTEC of controls and patients were placed in each electrode chamber.‘Mitochondrial respiratory rate (respiration-dependent ATP production)’ was calculated by subtracting ‘Background oxy-gen consumption rate ( proton leak)’ (recorded with a reference electrode in a presence of 10 μ NaCN) from ‘Total oxygen con-sumption rate’.
Enzymes of cellular energy production
Activity of single enzyme complexes of electron transport chain, glycolysis and citrate cycle were recorded according to previously published protocols (12,36). A computer-tuneable spectropho-tometer (Spectramax Plus Microplate Reader, Molecular Devices; Sunny Vale, CA, USA) operating in the dual wavelength mode was used. Measurement of the samples was performed in tempera-ture-controlled 96-well plates in afinal volume of 300 ml.
Radiometric analysis
Studies on the metabolism of14C-pyruvate and14
C-2-oxogluta-rate were performed according to previously published protocols (14).
Determination of ROS
Reactive oxygen species were measured by H2DCFDA staining.
Cells were stained with H2DCFDA (10μ) for 30 min. Then ROS
generation was determined by FACS analysis (Canto II, Becton Dickinson).
Acridine orange staining
Cells were cultured in 6 cm petri dishes for 48 h in and, after-wards, incubated with acridine orange (1 μg/ml) colorless DMEM at 37°C for 20 min. Detection of green and redfluorescent cells was performed using a FACS system (Canto II, Becton Dickinson).
mTOR regulation
Regulation of mTOR signaling was analyzed using mTOR Regula-tion Antibody Sampler Kit (#9864; Cell Signaling) according to the manufacturer’s protocol.
Determination of cytokines
To screen for changes in expression and secretion cytokines we used a Mix-N-Match ELISArray (SA Bioscience including IL8, MCP1, MIP-1a, MIP-1b, RANTES, TGF-ß) according to the manu-facturer’s protocol. IL-8 concentration was measured by en-zyme-linked immunosorbent assay (ELISA) (Gen-probe, Eli-pair IL-8) again according to the manufacturer’s protocol. For these experiments, hTEC were grown on 12-well TransWellfilter plates for 48 h in standard medium. Thereafter, cells were washed twice with PBS and cultured in medium without FCS for 24 h. Then me-dium from the basolateral and apical site of well was collected, cells were harvested and medium and cell lysates were analyzed.
Electron micrographs
Cells werefixed with 1:1:1 (v/v) mixture of 0.05% ruthenium red (AppliChem; Darmstadt, Germany), 2.5% glutaraldehyde
(SERVA; Heidelberg, Germany) and cacodylate buffer, 2 h at RT. After washing with 0.2 M cacodylate buffer, cells were post-fixed with with 1:1:1 (v/v) of 0.05% ruthenium red, 0.2 M cacodylate buffer and 2% osmium tetroxide (Chempur; Karls-ruhe, Germany) for 2 h at RT. Next, cells were washed with caco-dylate buffer and dehydrated with serial ethanol concentrations (50, 80, 96 and 100%). Samples were embedded in Araldite (SERVA), contrasted with uranylacetate and lead citrate and sec-tioned with Ultracut 70 nm (Leica; Solms, Germany). Images were captured using EM 910 (Zeiss; Oberkochen, Germany).
Statistical analysis
Experiments were performed at least in triplicates. Data are ana-lyzed using Mann–Whitney U tests for pairwise comparison and Kruskal–Wallis H test with subsequent Mann–Whitney U tests for multiple comparison (SPSS for Windows 16.0 Software).
Supplementary Material
Supplementary Material is available at HMG online.
Acknowledgements
We are grateful to Professor Dr Michael Kirschfink, Institut für Im-munologie, University Heidelberg for the analysis of the comple-ment system in hTEC, to Professor Dr Matthias Baumgartner, University Children’s Hospital Zurich and Professor Dr Olivier De-vuyst University of Zurich for critical discussion of the project and manuscript.
Conflict of Interest statement. None declared.
Funding
A.S. is supported by the Clinical Research Priority Program‘Rare Diseases Initiative Zurich (radiz)’ of the University of Zurich.
References
1. Sniderman, L.C., Lambert, M., Giguere, R., Auray-Blais, C., Le-mieux, B., Laframboise, R., Rosenblatt, D.S. and Treacy, E.P. (1999) Outcome of individuals with low-moderate methylma-lonic aciduria detected through a neonatal screening pro-gram. J. Pediatr., 134, 675–680.
2. Fenton, W.A., Gravel, R.A. and Rosenblatt, D.S. (2001) Disor-ders of propionate and methylmalonate metabolism. In Scri-ver, C.R., Beaudet, A.L. and Valle, A.D. (eds) The Metabolic and Molecular Bases of Inherited Disease. McGraw-Hill, New York, pp. 2165–2193.
3. Brismar, J. and Ozand, P.T. (1994) CT and MR of the brain in disorders of the propionate and methylmalonate metabol-ism. AJNR Am. J. Neuroradiol., 15, 1459–1473.
4. Radmanesh, A., Zaman, T., Ghanaati, H., Molaei, S., Robert-son, R.L. and Zamani, A.A. (2008) Methylmalonic acidemia: brain imagingfindings in 52 children and a review of the literature. Pediatr. Radiol., 38, 1054–1061.
5. Hörster, F., Baumgartner, M.R., Viardot, C., Suormala, T., Bur-gard, P., Fowler, B., Hoffmann, G.F., Garbade, S.F., Kölker, S. and Baumgartner, E.R. (2007) Long-term outcome in methyl-malonic acidurias is influenced by the underlying defect (mut0, mut-, cblA, cblB). Pediatr. Res., 62, 225–230.
6. Morath, M.A., Okun, J.G., Muller, I.B., Sauer, S.W., Horster, F., Hoffmann, G.F. and Kölker, S. (2008) Neurodegeneration and
chronic renal failure in methylmalonic aciduria–a patho-physiological approach. J. Inherit. Metab. Dis., 31, 35–43. 7. Peters, H., Nefedov, M., Sarsero, J., Pitt, J., Fowler, K.J., Gazeas,
S., Kahler, S.G. and Ioannou, P.A. (2003) A knock-out mouse model for methylmalonic aciduria resulting in neonatal le-thality. J. Biol. Chem., 278, 52909–52913.
8. Manoli, I., Sysol, J.R., Li, L., Houillier, P., Garone, C., Wang, C., Zerfas, P.M., Cusmano-Ozog, K., Young, S., Trivedi, N.S. et al. (2013) Targeting proximal tubule mitochondrial dysfunction attenuates the renal disease of methylmalonic acidemia. Proc. Natl. Acad. Sci. U. S. A., 110, 13552–13557.
9. de Keyzer, Y., Valayannopoulos, V., Benoist, J.F., Batteux, F., Lacaille, F., Hubert, L., Chretien, D., Chadefeaux-Vekemans, B., Niaudet, P., Touati, G. et al. (2009) Multiple OXPHOS defi-ciency in the liver, kidney, heart, and skeletal muscle of pa-tients with methylmalonic aciduria and propionic aciduria. Pediatr. Res., 66, 91–95.
10. Kimura, J., Ichii, O., Otsuka, S., Kanazawa, T., Namiki, Y., Hashimoto, Y. and Kon, Y. (2011) Quantitative and qualitative urinary cellular patterns correlate with progression of mur-ine glomerulonephritis. PLoS One, 6, e16472.
11. Schwab, M.A., Sauer, S.W., Okun, J.G., Nijtmans, L.G., Roden-burg, R.J., van den Heuvel, L.P., Drose, S., Brandt, U., Hoffmann, G.F., Ter Laak, H. et al. (2006) Secondary mitochondrial dysfunc-tion in propionic aciduria: a pathogenic role for endogenous mitochondrial toxins. Biochem. J., 398, 107–112.
12. Kaminski, M.M., Sauer, S.W., Kaminski, M., Opp, S., Ruppert, T., Grigaravicius, P., Grudnik, P., Grone, H.J., Krammer, P.H. and Gulow, K. (2012) T cell activation is driven by an ADP-depend-ent glucokinase linking enhanced glycolysis with mitochon-drial reactive oxygen species generation. Cell Rep, 2, 1300–1315. 13. Nakano, M., Nakashima, A., Nagano, T., Ishikawa, S., Kikka-wa, U. and Kamada, S. (2013) Branched-chain amino acids en-hance premature senescence through mammalian target of rapamycin complex I-mediated upregulation of p21 protein. PLoS One, 8, e80411.
14. Okun, J.G., Hörster, F., Farkas, L.M., Feyh, P., Hinz, A., Sauer, S., Hoffmann, G.F., Unsicker, K., Mayatepek, E. and Kölker, S. (2002) Neurodegeneration in methylmalonic aciduria in-volves inhibition of complex II and the tricarboxylic acid cycle, and synergistically acting excitotoxicity. J. Biol. Chem., 277, 14674–14680.
15. Kölker, S., Schwab, M., Horster, F., Sauer, S., Hinz, A., Wolf, N. I., Mayatepek, E., Hoffmann, G.F., Smeitink, J.A. and Okun, J.G. (2003) Methylmalonic acid, a biochemical hallmark of methylmalonic acidurias but no inhibitor of mitochondrial respiratory chain. J. Biol. Chem., 278, 47388–47393.
16. Kim, J., Devalaraja-Narashimha, K. and Padanilam, B.J. (2015) TIGAR regulates glycolysis in ischemic kidney proximal tu-bules. Am. J. Physiol. Renal Physiol., 308, F298–F308.
17. Chandler, R.J., Zerfas, P.M., Shanske, S., Sloan, J., Hoffmann, V., DiMauro, S. and Venditti, C.P. (2009) Mitochondrial dys-function in mut methylmalonic acidemia. FASEB J., 23, 1252–1261.
18. Zsengeller, Z.K., Aljinovic, N., Teot, L.A., Korson, M., Rodig, N., Sloan, J.L., Venditti, C.P., Berry, G.T. and Rosen, S. (2014) Methylmalonic acidemia: a megamitochondrial disorder af-fecting the kidney. Pediatr. Nephrol., 29, 2139–2146.
19. Nulton-Persson, A.C. and Szweda, L.I. (2001) Modulation of mitochondrial function by hydrogen peroxide. J. Biol. Chem., 276, 23357–23361.
20. Kalyanaraman, B., Darley-Usmar, V., Davies, K.J., Dennery, P. A., Forman, H.J., Grisham, M.B., Mann, G.E., Moore, K., Rob-erts, L.J. 2nd. and Ischiropoulos, H. (2012) Measuring reactive
oxygen and nitrogen species withfluorescent probes: chal-lenges and limitations. Free Radic. Biol. Med., 52, 1–6. 21. Kimura, T., Takahashi, A., Takabatake, Y., Namba, T.,
Yama-moto, T., Kaimori, J.Y., Matsui, I., Kitamura, H., Niimura, F., Matsusaka, T. et al. (2013) Autophagy protects kidney prox-imal tubule epithelial cells from mitochondrial metabolic stress. Autophagy, 9, 1876–1886.
22. Rogov, V., Dotsch, V., Johansen, T. and Kirkin, V. (2014) Inter-actions between autophagy receptors and ubiquitin-like pro-teins form the molecular basis for selective autophagy. Mol. Cell, 53, 167–178.
23. Inoki, K. (2014) mTOR signaling in autophagy regulation in the kidney. Semin. Nephrol., 34, 2–8.
24. Parrales, A., Lopez, E., Lee-Rivera, I. and Lopez-Colome, A.M. (2013) ERK1/2-dependent activation of mTOR/mTORC1/ p70S6K regulates thrombin-induced RPE cell proliferation. Cellular Signalling, 25, 829–838.
25. Copp, J., Manning, G. and Hunter, T. (2009) TORC-specific phosphorylation of mammalian target of rapamycin (mTOR): phospho-Ser2481 is a marker for intact mTOR sig-naling complex 2. Cancer Res., 69, 1821–1827.
26. Jung, C.H., Jun, C.B., Ro, S.H., Kim, Y.M., Otto, N.M., Cao, J., Kundu, M. and Kim, D.H. (2009) ULK-Atg13-FIP200 complexes mediate mTOR signaling to the autophagy machinery. Mol. Biol. Cell, 20, 1992–2003.
27. Ganley, I.G., Lam du, H., Wang, J., Ding, X., Chen, S. and Jiang, X. (2009) ULK1.ATG13.FIP200 complex mediates mTOR signaling and is essential for autophagy. J. Biol. Chem., 284, 12297–12305. 28. Kato, H., Nakajima, S., Saito, Y., Takahashi, S., Katoh, R. and Kitamura, M. (2012) mTORC1 serves ER stress-triggered apop-tosis via selective activation of the IRE1-JNK pathway. Cell Death Differ., 19, 310–320.
29. Shanware, N.P., Bray, K., Eng, C.H., Wang, F., Follettie, M., Myers, J., Fantin, V.R. and Abraham, R.T. (2014) Glutamine
deprivation stimulates mTOR-JNK-dependent chemokine secretion. Nat. Commun., 5, 4900.
30. Benbrook, D.M. and Long, A. (2012) Integration of autophagy, proteasomal degradation, unfolded protein response and apoptosis. Exp. Oncol., 34, 286–297.
31. Segerer, S., Henger, A., Schmid, H., Kretzler, M., Draganovici, D., Brandt, U., Noessner, E., Nelson, P.J., Kerjaschki, D., Schlondorff, D. et al. (2006) Expression of the chemokine re-ceptor CXCR1 in human glomerular diseases. Kidney Int., 69, 1765–1773.
32. Wrobel, L., Topf, U., Bragoszewski, P., Wiese, S., Sztolsztener, M.E., Oeljeklaus, S., Varabyova, A., Lirski, M., Chroscicki, P., Mroczek, S. et al. (2015) Mistargeted mitochondrial proteins activate a proteostatic response in the cytosol. Nature, 524, 485–488.
33. Wang, S.S., Devuyst, O., Courtoy, P.J., Wang, X.T., Wang, H., Wang, Y., Thakker, R.V., Guggino, S. and Guggino, W.B. (2000) Mice lacking renal chloride channel, CLC-5, are a model for Dent’s disease, a nephrolithiasis disorder asso-ciated with defective receptor-mediated endocytosis. Hum. Mol. Genet., 9, 2937–2945.
34. Baumgartner, E.R. (1983) Activity of the cobalamin-depend-ent methylmalonyl-CoA mutase. In Hall, C.A. (ed), The Cobala-mins, Methods in Hematology, Churchill Livingston, Edinburgh, New York, 10, pp. 181–195.
35. Heerlein, K., Schulze, A., Hotz, L., Bartsch, P. and Mairbaurl, H. (2005) Hypoxia decreases cellular ATP demand and inhibits mitochondrial respiration of a549 cells. Am. J. Respir. Cell Mol. Biol., 32, 44–51.
36. Sauer, S.W., Okun, J.G., Schwab, M.A., Crnic, L.R., Hoffmann, G.F., Goodman, S.I., Koeller, D.M. and Kölker, S. (2005) Bioenergetics in glutaryl-coenzyme A dehydrogenase deficiency: a role for glutaryl-coenzyme A. J. Biol. Chem., 280, 21830–21836.