Publisher’s version / Version de l'éditeur:
Cement, Concrete and Aggregates, 17, 1, pp. 92-97, 1995
READ THESE TERMS AND CONDITIONS CAREFULLY BEFORE USING THIS WEBSITE. https://nrc-publications.canada.ca/eng/copyright
Vous avez des questions? Nous pouvons vous aider. Pour communiquer directement avec un auteur, consultez la première page de la revue dans laquelle son article a été publié afin de trouver ses coordonnées. Si vous n’arrivez pas à les repérer, communiquez avec nous à PublicationsArchive-ArchivesPublications@nrc-cnrc.gc.ca.
Questions? Contact the NRC Publications Archive team at
PublicationsArchive-ArchivesPublications@nrc-cnrc.gc.ca. If you wish to email the authors directly, please see the first page of the publication for their contact information.
NRC Publications Archive
Archives des publications du CNRC
This publication could be one of several versions: author’s original, accepted manuscript or the publisher’s version. / La version de cette publication peut être l’une des suivantes : la version prépublication de l’auteur, la version acceptée du manuscrit ou la version de l’éditeur.
Access and use of this website and the material on it are subject to the Terms and Conditions set forth at
Determination of silica-fume content in hardened concrete by AC
impedance spectroscopy
Gu, P.; Xie, P.; Beaudoin, J. J.
https://publications-cnrc.canada.ca/fra/droits
L’accès à ce site Web et l’utilisation de son contenu sont assujettis aux conditions présentées dans le site LISEZ CES CONDITIONS ATTENTIVEMENT AVANT D’UTILISER CE SITE WEB.
NRC Publications Record / Notice d'Archives des publications de CNRC:
https://nrc-publications.canada.ca/eng/view/object/?id=f5bca01f-4a59-4056-a748-b48b0fe4e426
https://publications-cnrc.canada.ca/fra/voir/objet/?id=f5bca01f-4a59-4056-a748-b48b0fe4e426
http://www.nrc-cnrc.gc.ca/irc
De t e rm ina t ion of silic a -fum e c ont e nt in ha rde ne d c onc re t e by AC
im pe da nc e spe c t rosc opy
N R C C - 3 7 0 2 5
G u , P . ; X i e , P . ; B e a u d o i n , J . J .
J a n u a r y 1 9 9 5
A version of this document is published in / Une version de ce document se trouve dans:
Cement, Concrete and Aggregates, 17, (1), pp. 92-97, 1995
The material in this document is covered by the provisions of the Copyright Act, by Canadian laws, policies, regulations and international agreements. Such provisions serve to identify the information source and, in specific instances, to prohibit reproduction of materials without written permission. For more information visit http://laws.justice.gc.ca/en/showtdm/cs/C-42
Les renseignements dans ce document sont protégés par la Loi sur le droit d'auteur, par les lois, les politiques et les règlements du Canada et des accords internationaux. Ces dispositions permettent d'identifier la source de l'information et, dans certains cas, d'interdire la copie de documents sans permission écrite. Pour obtenir de plus amples renseignements : http://lois.justice.gc.ca/fr/showtdm/cs/C-42
Ping
GU,IPing Xie,
2and
J. J.
Beaudoin
1Determination of Silica-Fume Content in Hardened Concrete by
AC Impedance Spectroscopy
REFERENCE: Gu, P.. Xie, P., and Beaudoin, I. I.. "Determination
of Silica-Fume Content in Hardened Concrete by AC Impedance Spectroscopy," Cement, Concrete, and Aggregates, CCAGDP. Vol.
17, No. I, Iune 1995, pp. 92-97.
ABSTRACT: Anondestructive method based on AC impedance spec-troscopy was applied to studies of the electrical behavior of hydrated portland cement concrete containing silica fume. Silica fume content significantly influenced the impedance behavior of hydrated portland cement concrete. Correlations between the high frequency arc (HFA) diameter and the silica-fume content in concrete were obtained. Empiri-cal relationships for concrete binders at early and more advanced hydration can be expressed as
DHFA= kッセウヲ
+
Cforearly hydration times (1)and
DHFA = C(Ko')13sjfor advanced hydration times (2)
whereDHFAis the highfrequency arcdiameter, Ila/is the silica-fume content,
K", kセL C. and C' are constants related to hydration times and
W-Cratio, and so forth.
KEYWORDS: concrete, portland cement, silica fume, AC impedance spectroscopy
The quality of concrete materials is important as it affects the
service life of concrete structures. Cement and aggregate content
and
wセcratio of the original concrete mixture are important factors
affecting quality. ASTM standards C 457, C 856, C 823, C 295, C 1078, and C 1084' all provide guidance for the determination of cement content and
w-e
ratio. Sampling and analytical methodsto be used to determine the cement content, aggregate content,
aggregate grading,
w-e
ralio, type of cement and aggregate,chlo-ride, sulphate and alkali contents are described in a recent revision
IInstitute for Research in Construction, Materials Laboratory, Ottawa, Ontario, Canada, KIAOR6.
2University of Ottawa, Department of Civil Engineering, Ottawa, Ontario, Canada KIN 6N5.
3C 457-Test Method for Microscopical Detennination of Parameters of the Air-Void System in Hardened Concrete.
C 856-Practice for Petrographic Examination of Hardened Concrete. C 823-Practice for Examination and Sampling of Hardened Concrete in Constructions.
C 295-Guide for Petrographic Examination of Aggregates for Con-crete.
C 1078-Test Methods for Determining Cement Content of Freshly Mixed Concrete,
C 1084-Test Method for Portland-Cement Content of Hardened Hydraulic-Cement Concrete.
of a 1988 British Standard.' The determinalion is more difficult
in concretes containing various chemical and mineral admixtures
such as fly ash, silica fume, and slag.
In previous work, it was demonstrated thai AC impedance spec-troscopy is a useful tool for investigating changes of both
micro-structure and ionic concentration of pore solution in a hydrating
cement paste system (Gu et al. 1992, 1993a, 1993b). The
imped-ance behavior of hydrating
」・ュ・ョエセウゥャゥ」。fume mixtures was
ウゥァョゥセficantly different from that of pure cement paste. An early appearance of a high frequency arc and rapid growth of HFA
diameter
with hydration time occurs in pastes containing silica
fume. This behavior is due to the combined effect of accelerating hydration reactions through consumption of calcium hydroxide and microstructural changes in the matrix. In this paper. an AC impedance method to detennine silica-fume content in hardened
concrete is described.
Concepts and Principles of AC Impedance Spectroscopy in Cement and Concrete Systems
Impedance spectra are recorded over awide range of frequencies
(from MHz 10 Hz). They provide infonnation on the evaluation
of cement paste and concrete microstructure and hydration. A
typical impedance spectrum for a cement system (two- or three-point measurement) is plotted in the real versus imaginary plane in Fig.
1a.
A singlearc
in the high frequency range and a small part of a secondarc
in a relatively low frequency region is illus-trated. The HFA is attributed to the bulk pasle impedance behavior,and the second arc is due to the cement-electrode surface
capaci-tance contribution. The intercepts
R,
(at the high frequency end, in the range 10 to 32 MHz) andR,
+
R,
(at the minimum between the electrode arc and bulk are, at frequency circa 100 KHz)are
important parameters providing information related to the cementpaste and concrete microstructure profile. The HFA diameter is
detennined from equivalent circuit modeling (Fig.Ib).Ideally, the value ofR, should be equivalent to DHFA if the HFA is a perfect
semicircle. An ideal response however is rarely observed. Most
materials exhibit an inclined semicircle with the center depressed
below lhe real axis by an angle B, (Fig. Ie). The value ofDHFA is
then equal toR,Icos(B).
From previous investigations (Xie et al. 1993; Gu et al. 1993c; Xu et al. 1993) it is noted that: (I)the high frequency resistance
R.
is an inverse function of both porosity and ionic concentration
4Methods for Analysis of Hardened Concrete,
as
1881, Part 124,Testing Concrete, British Standards Institute, London. 1988.GU ET AL. ON DETERMINATION OF SILICA-FUME CONTENT 93
J
Bulk cement paste effect
electrode effect
Real(ohms)
Bulkcementpasteefftct efectrodeeffect
C2 Cdl Rl R2
(1
a)
(1 b)
Q)Increase Real(ohms) electrode effect R1+R2 Bulk cement paste effectDHFA=R2/COS(9)
(1C)
FIG. l-(a)Schematic plot ofaィゥァィセヲイ・アオ・ョ」ケ arc in the impedance complex plane obtainedfor cement paste or concrete systems,'(b)the corresponding
electrical equivalent circuit; and(c)an inclined semicircle whose center is depressed below the real axis by an angle 6.
in the pore solution; (2) the high frequency arc diameter DHFAor
R2 is an inverse function of porosity, mean pore size and ionic
concentration of the pore solution. An increase ofR2orDHFAvalue
is due to the change of porosity and mean pore size as the hydration time increases ifthe concentration teon remains unchanged; (3) hoth R, and R, or DHFA are affected by ionic additives. Increase of
additive concentration leads to lowerR1andR2orDHFA values.R2
or DHFA is more sensitive to the microstructure and concentration
changes and is relatively easy to obtain experimentally. In tbis paper, it will be used as a descriptor to characterize the ウゥャゥ」。セ fume content in concrete.
Experimental Materials
Type 10 portland cement was used. The chemical composition (wt%) is as follows: 19.83% SiO,. 61.21 % CaO, 3.20% Fe,O,. 4.18% AhO,. 4.09% MgO, 3.93% SO" 0.45% Na,O. and 0.82% K,O. Siiica fume was supplied by the SKW Company. Montreal Quebec. Its composition is as follows: 95.17% SiO" 0.23% CaO. 0.13% Fe,O,. 0.21% AI,03. 0.15% MgO. 0.12% SO,. 0.10% Na,O, and 0.27% K,O.
Specimen Preparation
Twenty different concretes were prepared. Four different cement:sand:aggregate weight ratios(I:1: 1. I: 1.5: 1.5, I:2:2. and I:2.5:2.5) and five different silica-fume contents (0. 5, 10. 15. and 20% cement replacement) were made. Fresh concrete mixtures were mixed in a conventional mixer at awセc ratio--O.50 and cast
in cylindrical molds 76 em diameter by 75 em. The samples were cured in a 100% relative humidity environment for 24 h and subsequently immersed in saturated lime solution.
Instrumentation and Data Extraction
A 1260 Impedance Gain-Phase Analyzer from Schlumberger Technologies was used for impedance measurements. A two-point measurement set-up was applied by connecting the IH(high current lead) with VH (high voltage lead) and
h
(low current lead) withVL(low voltage lead). However, to eliminate the electrode effects a four-point measurement set-up is recommended (Method for Field Measurement of Soil Resistivity Using the Wenner Four-Electrode Method, ASTM G 57). Data was collected using a fre-quency scan from 20 MHz to 1 Hz with 10 readings per decade. DHFAis extracted by fitting the experimental data with tbe equivalent
circuit (Fig. Ib) until the best fit is obtained.
Results and Discussion
High Frequency An;dゥ。ュ・エ・イセhケ、イ。エゥッョ Time
Figures 2a through2dare plots of HFA diameterDHFA versus hydration time for plain concrete and concrete containing smca fume at the early hydration ages. The inserted figures are those for more advanced hydration times ranging from 71 to 81 days. The cement-sand-aggregate ratios are indicated in the Figs. 2 through 5. Silica fume changes the impedance behavior of the hydrating concrete significantly.
At the early hydration times, the HFA diameter DHFA increases with time. This is the result of the hydration process in which
...oセウヲ
...Uセウヲ
BQPセヲ
- - lSXlIf - ... 20"sl
'94 CEMENT, CONCRETE, AND AGGREGATES
20
r::o:---,---,
1
-
16::r
i;:
I
HセQZQZQ
JQ セ1'8
2
4
a ...a
6 0 7 0 8 0 9 0セ lセセセセ
::c
0o
4 8 12 16 20result in a large increase of the HFA diameter. This indicates formation of a denser matrix. Rapid hydration, better particle pack•
ing, and lower calcium ion concentration in the pore solution are
factors attributed to the increase of HFA diameter.
Concretes made with high cement-sand-aggregate ratio have large HFA diameters when other conditions remain the same. The difference due to the aggregate volume fraction is small compared to that of silica fume.
ッセM[[`セ]]][ZZZセセ
o
4 8 12 16 20(3)
(4)
where DHFA is the HFA diameter, セGヲ is the silica fume content inpercentage,
K
ooand C are constants related to hydration rate andW-C ratio, and so forth. The correlation coefficients are in the range
0.94
to1.0.
It is also noted that the constantsK"
andC
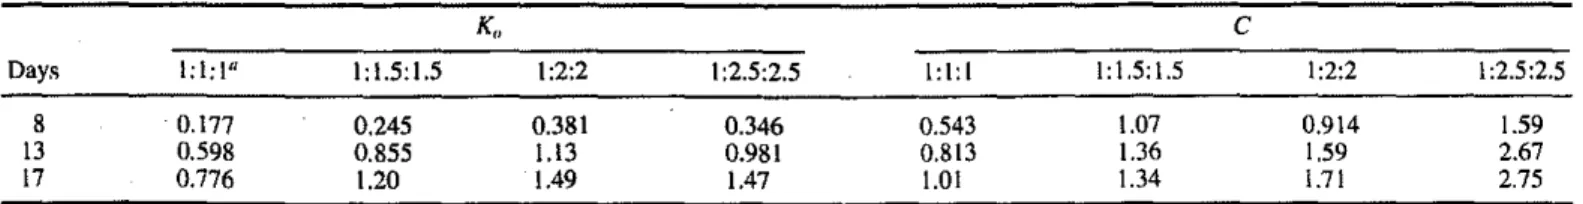
change with hydration time. A list of the regression constants Ko
andCis given in Table I for comparison.
The values of constants
K
o and C increase as the hydration time increases. This suggests that determination of the silica-fume content in young concrete would be more difficult as both cement:aggregate ratio and the hydration time have to be known. Advanced Hydration Times-Atadvanced hydration times, the
HFA diameter reaches a relatively constant value as indicated in
Fig. 2. The HFA diameter is then affected mainly by the silica·
fume content. The effect of hydration time becomes insignificant (assuming the ionic concentration of the pore solution is relatively
constant). The plots of HFA diameter (kG) versus silica-fume content at advanced hydration times (71 to 81 days) are given in Figs. 4a through 4c, respectively. An exponential relatinn is obtained. The correlation coefficients range from
0.97
to0.99.
Theempirical equation has the general form
High Frequency Arc Diameter-Silica Fume Content
Examination of the relation between HFA diameter and silica
fume content was carried out at two different hydration periods. Early HydrationTImes-Figures 3a through 3d are plots of HFA diameter (kG) versus percentage of silica fume at various hydration times from 3 to 17 days, respectively. There is no clear relation between HFA diameter and silica fume content at 3 days. Linear relationships are obtained at 8, 13, and 17 days. The empirical relationships for concrete binders at early hydration times can be generally expressed as ... OXsf ....UセDヲ ... IOXsf - - IS"s! - .... 20Xs! ... 01(51 ... 5",,$1 ... 10X91 - - 15Xsf -+-20'1:,1 20 20 16 16 12 (d)1:2.5:2.5 (c)1:2:2 8 4
o'----"""
o
40イ[[Z[[MZ]ZMMZMMMMMMMMMMMMMNMMセf
30:::[iiJ"
1
5 0 - - - - -...-.-eJ
20 0'0 70 ao 90 10セ ッセMM
....
セ[ᄃセᄃᄃセセセセセセセMj
o
4 8 12 _ 30イNZ[ZMMMMLMMMMMMMMセMNLMM⦅⦅⦅Lt :::[ Ii;
I
(b)1:1.5:1.5 :::セZZ
g,
20 ... lOX" 50 ...--- __ 15'l.slJ
a -'-20'.,
60 70 SO 90 10 Hydration11m.(days)FIG.2-Plots ofHFA diameter versus hydration time for plain concrete and concrete containing silicafume at early hydration. The insertedfigures correspond to more advanced hydration limes. The」・ュ・ョエセウ。ョ、ᄋ。ァァイ・ァ。エ・
ratios are indicated in Figs, (aJ through(d). (a) 1:1:1. (b) 1:1.5:1.5, (c) 1:2:2, and (d) 1:2.5:2.5. 40
r.;:;:---___,r---,
I
30;;:t : -
f5:
セ
.lei
20 60 70 80 90 10セ
::c
A straight line is obtained in a plot of logDHFA versus セLゥヲ (Fig. 5).
The regression constants K;I and
C
are listed in Table 2.consumption of free water and reduction of capillary porosity are taking place. However, the rate of hydration decreases significantly as ahout 85% of the cement is hydrated after 28 days. The HFA
diameter appears to reach a relatively constant value at advanced
hydration times as indicated in Fig. 2. High silica-fume contents or
logDHFA
=
logC'
+
QPァHkセIセゥヲ (5)TABLE l-Regression constants
Ko
andCin Eq3for various hydration times.K" C Day.l> 1:1:1" 1: 1.5: 1.5 1:2:2 1:2.5:2.5 1:1:1 1: 1.5: 1.5 1:2:2 1:2.5:2.5 8 0.177 0.245 0.381 0.346 0.543 1.07 0.914 1.59 13 0.598 0.855 1.13 0.981 0.813 1.36 1.59 2.67 17 0.776 1.20 1.49 1.47 1.01 1.34 1.71 2,75 \ャc・ュ・ョエセウ。ョ、M。ァァイ・ァ。エ・ ratio.
GU ET AL. ON DETERMINATION OF SILICA-FUME CONTENT 95
4 8 12 16 20
Silica Fume Content,
セ... '"
(b) 8days
...
.:..
セNLN.
ZZZZセNセNセNセNBN
.
'.' .'
:
:
セZN BNセ
'. '.'...
:
...
:.
... 1:1:1 .,., 1:1.5:1.5 .,. 1:2:2 1:2.5:2.5 2 101
1 6 -+- 1:1:1I
... 1:1.5:1.5 (a) 3days-a
8 セ_ 1.2 .... 1:2:26
- 1:2.5:2.5 _, 6S
J'
4セPX
セ
is
Q 2 <0.4...-it
u.; :I: 0 :I: 0 0 4 8 12 16 20 0Silica Fume Content,
セGB'"
(d) 17days
4 8 12 16 20
Silica Fume Content,
セGB'"
40イZMMMZMMZMZMMLNMMMMMMセ
I
...
,:1:,-S
30 • 1:1,5:1.5 セ ·.··1:2:2 . '- • '-2<:"2' . : : ..
BセBセ.
a;
20 . , ' .Ii
'i"
.'.
is
10 . , ' '.'.-. . . ' '.'<
.,,'.•...•..
セ 0i"··
·Ko
20...
.
'..
(e) 13days 4 8 12 16Silica Fume Content,
セ... '"
... 1;1:1 It 1:1.5:1.5 ." 1:2:2 1:2.5:2.5
j
10 30I I , 120 " セN.
.
it
•.
,,:i'
:
..
:I: 0 0 ;'::''-'-'I
FIG. 3-P10lS of HFA diameter (kO) versusウゥャゥ」。セヲオュ・ content at early hydration limes.(a)3. (b) 8, (c) 1$, and (d) 17 days.
4 8 12 16 20
Silica Fume Content,
セGB'"
t'::: ...
NエZZセセGZZH
I!!!f::::···
1S0 _1 SO-..
..- 1:1:\ (a) 71 days1
20,g
120 • 1:1.5:1.5j
• 1:2:2 ':" 90·
1:2.5:2.5,
Ii
90S
1
60.1
60.
セNt' '.'.
·.··t··
Q 30 Q 30it
セ
! ; :t : : : :
GセZ
", ..
it
:r
:I: 0 0 0 4 8 12 16 20 0Silica Fume Content,
!lot, '"
....- 1;1:1 •.. 1:1.5:1.5 ..•.. 1:2:2 • 1:2.5:2.5 (b) 75 days .'
.
.,
..
(e) 81 dayst· -
•
£:::
t ;
..
-.- 1:1:1 • 1:\.5:1.5 • 1:2:2 1:2.5:2.5 4 8 12 16 20Silica Fume
COntent,
/lol, '"
_ 150
セ
.<: 120 ).l
-
90l
セ
60it
30 :I: 0 096
CEMENT. CONCRETE. AND AGGREGATESTABLE 2-Regression constants K; and C' of Eq 4 for various hydration times.
K' C'
"
Days 1:1:1 I: 1.5: 1.5 1:2:2 1:2.5:2.5 1: I: 1 1:1.5:1.5 1:2:2 1:2.5:2.5 71 1.163 1.153 1.159 1.153 4.160 6.432 7.261 8.057 75 1.149 1.155 1.163 1.140 4.349 6.151 6.738 8.337 81 1.157 1.160 1.164 1.154 4.066 5.993 6.892 8.047 "Cement-sand-aggregate ratio.A comparison of the values of
K;,
and C' indicates that there are no significant changes of these constants with hydration time. This means that the silica fume content in an old concrete can be quite easily determined by using the AC impedance technique if the cement-aggregate ratio is known.other mineral and chemical additives in well hydrated concrete.
However, it is apparent that caution must be taken to consider
the effect of ionic concentration of pore solution, hydration time, aggregate volume,
w-e
ratio, and other porosity-related factors. ConclusionsThe HFA diameter increases with hydration time, aggregate volume, and silica-fume content at the early hydration times. The HFA diameter varies directly with silica-fume content at constant time and aggregate volume.
The HFA diameter increases with aggregate volume and silica-fume content at advanced hydration times. The effect of hydration time becomes insignificant. An exponential relation between the
HFA diameter and silica-fume content is obtained at a constant
aggregate volume.
0.2
0.4
0.6
0.8
Aggregate Volume Fraction
' " +. '+ ••' . ' •
•
. • . o'g.o
.
'.
(0)
17doys
• '+'. :.0'
セLᆪ £' ,:,' . . £.---
0 or.5r.•
lOr.•
15r. -+- 20r.40
I
.J::.30
j
セ..
セ
20
Nセ
0
10
ut;
::r:
0
0
Effect of Aggregate Volume on High Frequency Arc Diameter
Plots of HFA diameter (kil) versus aggregate volume fraction are made to illustrate the effect of aggregate volume on HFA diameter. Figures 6a through 6b are typical plots at 17 and 71 days hydration, respectively. Sets of straight lines are obtained. The HFA diameter increases linearly wilh increasing aggregate volume.It is clear that the slope of the straight line increases with (I) hydration time and (2) silica-fume content. The conductive path wouldbemainly attributed to the volume fraction of cement paste since aggregate has a very high resistivity. High aggregate volume fraction or low cement paste volume fraction yields high resistivity values for concrete. Change of slope is a result of the change of cement paste conductivity that is affected by hydration time and silica-fume content. Therefore, the effect due to the
aggregate volume fraction can be taken into account in the detenni-nation of silica-fume content in a concrete.
DHFAas previously stated is a function of pore ion concentration, porosity, and mean pore size. Factors that have an impact on these
three parameters such as hatching errors. W-C ratio, mineral and chemical additives, air content, and so forth, will significantly affect the results. Application of the AC impedance technique to detennine the content of various chemical or mineral additives, although potentially very difficult, is possible if the influencing factors are isolated. AC impedance spectroscopy appears to be a
potential tool for determining silica-fume content in concrete. This
method also has potential for the determination of the content of
,
..
'+(b) 71days
[Nセ +. ' 0 (>.•••
, .''O 0.",..e-O
GMMセBMBMG
GセGGGMLGLLLLLNGMLG
セN セLQBLMGMLLMLG
£""". •",'",.:--'-,'_'_'_'-lo
1SO
r - - - r - - - ,
Ui"
....-
0%,g
120
0 5r.l
•
lOr... 90
15r.!
60
\---+-
__
20_r._,o
30
ut;
::r:
0.2
0.4
0.6
0.8
Aggregate Volume Fraction
FIG.6--Plots of HFA diameter (kO) versus aggregate volume fraction for hydrated concrete containing silica fume at hydration times. (a) 17
and(b) 71days.
20
o 1;1:1 1:1.5:1.5 • 1:2:2 1:2.5:2.51
o
10
1000
r ,
-I
::. 100
Qj
Qj.
セ
o
ut;
::r:
4
8
12
16
Silica Fume Content, j3et.
%
FIG. 5-A sample plot of log DHFA ver,vus (l,'(/'for hydrated concrete
Larger values of HFA diameter are obtained at high·aggregate , volume. The HFA diameter increases linearly with increasing aggregate volume in the range studied. The slope increases rapidly
as the silica-fume content increases. The difference due to the
aggregate volume is relatively small compared with the effect of silica fume.
AC impedance spectroscopy appears to be a potential tool for
the determination of mineral and chemical additive content in a
hydrated concrete.
Acknowledgments
The financial support of NSERC and the Network of Centers of Excellence on High Performance Concrete is gratefully acknowledged. Thanks are due Misters B. Myers, Gordon Chan, G. B. Pye, William Lei, and Ed Quinn for their help with the
experimental apparatus.
References
Gu, P., Xie, P.• Beaudoin,1. 1.,and Brousseau, R't1992, "AC. Impedance
Spectroscopy(I): A New Equivalent Circuit Model for Hydrated
Port-GU ET AL. ON DETERMINATION OF SILICA·FUME CONTENT 97
land Cement Paste," Cement Concrete Research, Vol. 22. No.5, pp. 833-840.
Gu, P., Xie, P., Beaudoin,J. J.tand Brousseau. R.t1993a, "A.C.iュー・、セ
ance Spectroscopy (II): Microstructural Characterizationof Hydrated
Cement·Silica Fume Systems,"Cement Concrete Research. Vol. 23,
No.1, pp. 157-168.
Gu, P., Xie, P., and Beaudoin, J. J., 1993, "Microstructural Characterization of the Transition Zone in Cement Systems by Means of A.C. Impedance Spectroscopy," Cement Concrete Research, Vol. 23, No.3, pp. 581-591.
Gu, P., Xu, Z., Xie, P.• and Beaudoin. J. J., 1993c, "Application of A.C. Impedance Techniques in Studies of Porous Cementitious Materials (I): Influence of Solid Phase and Pore Solution on High Frequency Resistance,"Cement Concrete Research, Vol. 23, No.3, pp. 531-540.
Xie, P., Gu, P.• Xu, Z., and Beaudoin, J. J., 1993, "A Rationalized A.C. Impedance Model for Microstructural Characterization of Hydrating Cement Systems,"Cement Concrete Research, Vol. 23, No.2, pp.
359-367.
Xu, Z.. Gu, P.. Xie,p..and Beaudoin, J. J.. 1993, "Application of A.C.
Impedance Techniques in Studies of Porous Cementitious Materials (I): Relationship Between ACIS Behaviour and Porous Microstructure," Cement Concrete Research, Vol. 23, No.4, pp. 853-862.