Publisher’s version / Version de l'éditeur:
Journal of the ASTM International (JAI), 6, 9, pp. 1-12, 2009-10-01
READ THESE TERMS AND CONDITIONS CAREFULLY BEFORE USING THIS WEBSITE. https://nrc-publications.canada.ca/eng/copyright
Vous avez des questions? Nous pouvons vous aider. Pour communiquer directement avec un auteur, consultez la première page de la revue dans laquelle son article a été publié afin de trouver ses coordonnées. Si vous n’arrivez pas à les repérer, communiquez avec nous à PublicationsArchive-ArchivesPublications@nrc-cnrc.gc.ca.
Questions? Contact the NRC Publications Archive team at
PublicationsArchive-ArchivesPublications@nrc-cnrc.gc.ca. If you wish to email the authors directly, please see the first page of the publication for their contact information.
NRC Publications Archive
Archives des publications du CNRC
This publication could be one of several versions: author’s original, accepted manuscript or the publisher’s version. / La version de cette publication peut être l’une des suivantes : la version prépublication de l’auteur, la version acceptée du manuscrit ou la version de l’éditeur.
For the publisher’s version, please access the DOI link below./ Pour consulter la version de l’éditeur, utilisez le lien DOI ci-dessous.
https://doi.org/10.1520/JAI102043
Access and use of this website and the material on it are subject to the Terms and Conditions set forth at
Assessment of energy rating of polyurethane spray foam walls:
procedure and interim results
Maref. W.; Elmahdy, A. H.; Swinton, M. C.; Tariku, F.
https://publications-cnrc.canada.ca/fra/droits
L’accès à ce site Web et l’utilisation de son contenu sont assujettis aux conditions présentées dans le site LISEZ CES CONDITIONS ATTENTIVEMENT AVANT D’UTILISER CE SITE WEB.
NRC Publications Record / Notice d'Archives des publications de CNRC:
https://nrc-publications.canada.ca/eng/view/object/?id=49ddfd98-387c-42aa-a717-326021744760 https://publications-cnrc.canada.ca/fra/voir/objet/?id=49ddfd98-387c-42aa-a717-326021744760http://www.nrc-cnrc.gc.ca/irc
Asse ssm e nt of e ne rgy rat ing of polyure t ha ne spra y
foa m w a lls: proc e dure a nd int e rim re sult s
N R C C - 5 0 8 4 7
M a r e f . W . ; E l m a h d y , A . H . ; S w i n t o n , M . C . ;
T a r i k u , F .
O c t o b e r 2 0 0 9
A version of this document is published in / Une version de ce document se trouve dans:
Journal of the ASTM International (JAI), 6, (9), pp. 1-12, DOI:
10.1520/JAI102043The material in this document is covered by the provisions of the Copyright Act, by Canadian laws, policies, regulations and international agreements. Such provisions serve to identify the information source and, in specific instances, to prohibit reproduction of materials without written permission. For more information visit http://laws.justice.gc.ca/en/showtdm/cs/C-42
Les renseignements dans ce document sont protégés par la Loi sur le droit d'auteur, par les lois, les politiques et les règlements du Canada et des accords internationaux. Ces dispositions permettent d'identifier la source de l'information et, dans certains cas, d'interdire la copie de documents sans permission écrite. Pour obtenir de plus amples renseignements : http://lois.justice.gc.ca/fr/showtdm/cs/C-42
--- 1-National Research Council Canada-Institute for Research in Construction (NRCC-IRC), 1200 Montreal Road Campus, Ottawa, ON, K1A 0R6, Canada.
W. Maref
1, H. Elmahdy
1, M.C. Swinton
1, and F. Tariku
1Assessment of Energy Rating of Polyurethane Spray Foam Walls:
Procedure and Interim Results
ABSTRACT: The application of polyurethane spray foam (SPF) insulation in buildings provides a durable and efficient thermal barrier. The industry is also promoting the SPF as an effective air barrier system in addition to its thermal insulation characteristics. In an effort to address these issues, a consortium of SPF manufacturers and contractors, jointly with the National Research Council of Canada’s Institute for Research in Construction, (NRC-IRC) conducted an extensive research project to assess the thermal and air leakage characteristics of SPF walls as well as conventional wall assemblies. The objective is to develop analytical and experimental procedures to determine a wall energy rating (WER) that captures both the thermal and Airleakage performance of a wall assembly. The experimental part included two streams of testing: 1) to determine the wall air leakage rate at different conditions and 2) their thermal resistance, R-value, at different temperature differences. An analytical procedure was also developed to calculate WER by combining the heat loss due to thermal transmission and that due to air leakage with the aim of arriving at WER. Six conventional full scale wood frame wall assemblies were built: two with glass fibre batts, and of four with medium density SPF. Some walls were constructed without penetrations and others were built with penetrations. The testing regime included: i- initial testing of air leakage and thermal resistance; ii- Conditioning in the Dynamic Wall Test Facility (DWTF) according to an established routine; iii- Retesting for air leakage and thermal resistance. This paper presents the results of six walls included in this project. The focus of this paper will be on presenting a brief summary of the project objective, testing protocol and the theoretical approach to determine the WER number for the six walls.
KEYWORDS: Polyurethane, Insulation, Energy rating, Testing, Modeling, Laboratory, Experiment.
Introduction
The spray polyurethane foam (SPF) insulation is facing increasing challenges to meet the global demands to eliminate the use of hydrochlorofluorocarbon (HCFC) in the manufacturing process. More than a decade ago, Canadian and American SPF industry worked to develop better procedures enabling the transfer of technology developed with the chlorofluorocarbon (CFC) blown foams to the second generation of blowing agents, namely HCFC. The research was performed jointly between the SPF industry and the National Research Council of Canada (NRC) using an arbitrarily developed foam system ―Base 88‖ [1, 2].
Today’s marketplace, however, is focused on the system performance rather than a ―drop in‖ blowing agent replacement, as it was over a decade ago. This implies that a decision on the SPF cost is made in relation to its total performance that includes SPF contribution to heat, air and moisture aspects not only on the basis of steady state ―R-value‖. Therefore, it is important to evaluate total performance walls built with SPF (2 foams by supplier were tested and 4 in total) with the third generation of blowing agents as well as meeting air barrier criteria as required by building codes.
The current paper is presenting preliminary results of a joint research project between the National Research
Council’s Institute for Research in Construction (NRC-IRC) and SPF producers and contractors. The main focus of the project is on the development of analytical and experimental procedures to determine the energy rating of SPF insulated walls. This would take into account the effect of air leakage and thermal transmission characteristics of SPF walls.
In an earlier paper [3], a detailed project outline and limited test and analytical results of two reference walls (one with glass fiber batts and another with medium density SPF) were presented. This paper will provide a brief summary of the project outline, a summary of the test procedures and interim results of six walls. Four of these walls are built with medium density SPF insulation and the remaining walls were built with glass fiber insulation, and this is with 2 manufacturers (1 opaque wall and 1 with penetration and windows for each manufacturer).
Project Objectives
The main project objective is to develop experimental and analytical procedures to determine the energy rating of SPF walls (WER). In addition, the foam producers and applicators desired to demonstrate that the use of polyurethane spray foam (when applied with certified foamers to ensure the intended thickness and at the right temperature and relative humidity ) could also provide an air barrier system that could meet the Canadian Construction Material Centre Guide 07272 [4]. Therefore, the
project is aimed at demonstrating these features, both analytically and experimentally. To see as well the effect of air leakage on the overall thermal performance of the wall system insulated with SPF and a glass fiber. This project also aims to develop a calculation tool to help practitioners to design their insulated walls taking into account the effect of the air leakage to assess their thermal performance. For example calculate the apparent R-value at 75 Pa for a given wall knowing the R-value at no air leakage.
Experimental Approach
The experimental part of this project included laboratory air leakage tests, thermal transmission (R-value) tests (using guarded hot box apparatus), material characterization (only for the different foams) and wall specimen conditioning. The conditioning (beating up and shaking walls by subjecting the walls to cycles of pressure difference) can open pores and gaps. The conditioning simulates wind loading and gust according to the test protocol outlined in the CCMC Air Barrier Guide [4]. The air leakage and R-value tests were performed before and after the sample conditioning to see if the conditioning had an effect on the air leakage performance of those wall systems and therefore the overall thermal performance. Figure 1 is a schematic illustrating the test sequence as performed on all walls.
FIG. 1
—Illustration of the test sequence
Brief Description of the Test Procedures and Apparatus
In this section, a brief description of the test procedures and apparatus are reported. More details can be found in [4].
Air Leakage Tests
Air leakage tests were performed on all wall samples. The test procedure used is in accordance with ASTM E-283 standard (ASTM 1997) [5]. An air leakage test apparatus was designed to test the wall sample (2.4 m by 2.4 m in size). Figure 2 is a schematic illustrating the mounting of the wall sample on the air leakage test apparatus.
Thermal Resistance Test (R-value)
The thermal resistance test was performed in the NRC-IRC guarded hot box (Figure3). The test method followed is a well-established procedure developed at NRC-IRC and formed the basis of ASTM guarded hot box standards (ASTM 1998[6] and ASTM 1998-a [7]).
FIG. 3
—NRC-IRC Guarded Hot Box
Material Characterizations
The characterization of SPF Thermal properties was performed using heat flow meter according to ASTM C-518-98 standard [8] on all foams used in this project. The test specimens were placed horizontally in a 60 cm x 60 cm Heat Flow Meter apparatus. Heat flowed vertically upwards through the specimens during the tests. The thermal conductivity was determined at three different mean temperatures:
Tmean = 0◦C (non standard test, but done for the purpose of the modeling to be close to full-scale test (-20◦C
and +20◦C))
Tmean = 24◦C (Standard test according to ASTM C-518-98 standard [8]
Tmean = 20◦C (Non standard test, but for purpose of simulation)
However, only the foam thermal properties reported in this paper apply at mean temperature of around 24 ± 1°C. Table 1 provides a summary of the results of foams used in WER-2, WER-3a, WER-3b and WER-4.
The thermal properties of glass fiber used in constructing WER-1 and WER-5 were obtained from published thermal properties of insulation materials databases [9].
TABLE 1
— Summary of the material characterization of foams (WER-2, 3a, 3b and 4) according to
ASTM standard C 518-98.
Wall
Parameter
Mean
temperature of
the ASTM test
T
m°C
24.3
24.1
24.1
24.2
Material density
ρ
Kg/m
334.9
46.3
43.9
34.3
Thermal
conductivity, SI
units
λ
W/(m.K)
0.019
0.0224
0.0214
0.0187
WER-3b WER-4
Sample Conditioning
Following an initial air leakage and R-value tests (performed on each wall), each wall specimen was conditioned to simulate wind loading and gust, according to the test protocol outlined in the CCMC Air Barrier Guide (NRC-CCMC, 1996). Figure 4 presents the pressure cycle applied to the samples. In summary, the wall sample was subjected to the following cycles:
- A positive pressure rise from 0 to +800 Pa in 1 second remains constant for 3 seconds, down to 0 Pa in one second and remains at 0 Pa for 3 seconds. This cycle is repeated 800 times
- A negative pressure is applied from 0 to – 800 Pa in one second, remains at – 800 Pa for 3 seconds, increases to 0 Pa in 1 second, and remains at 0 Pa for 3 seconds. This cycle is repeated 800 times.
- Gust wind: two cycles from 0 to + 1200 Pa (and another to – 1200 Pa) in a similar cycle. The total estimated time to complete the sample conditioning is about 5 h and 30 minutes.
FIG. 4
—Pressure cycle during the sample conditioning
Sample Description and Instrumentation
There are six walls included in this paper. Table 2 provides a summary of the six walls and their designations, which will be referred to throughout the rest of this document.
TABLE 2
—Description and designation of the six walls included in this paper.
Pressure cycle for conditioning
-1600 -800 0 800 1600
Time, s
P
re
s
s
u
re
d
if
fe
re
n
c
e
,
P
a
P
2P'
2P
3P'
3 Repeated positive pressure n times. Repeated negative pressure n times.Cyclic loads Gust loads
3s 1s 1s
Wall #
Wall Description
WER-1
Reference wall, glass fiber, indoor and outdoor electric
boxes and no penetration
WER-2
Reference wall, SPF medium density foam, indoor and
outdoor electric boxes and no penetration
WER-3a
Foamed wall, medium density foam, indoor and outdoor
electric boxes and no penetration
WER-3b
Foamed wall, medium density foam, indoor and outdoor
electric boxes and with penetration
WER-4
Foamed wall, medium density foam, indoor and outdoor
electric boxes and with penetration
WER-5
Reference wall, glass fiber, indoor and outdoor electric
boxes and with penetration
All walls included in this project were built using the conventional 2‖ by 6‖ wood stud frame construction. There were reference walls (filled with glass fiber batts (WER-1) and SPF (medium density foam) insulation (WER-2)) and others included variations of penetrations to simulate windows, electric boxes (indoor and outdoor), air vents and plastic pipes, as per the CCMC Air Barrier Guide. Figure 5 is a schematic of a cross section of the two reference walls: glass fiber and SPF insulations without penetration. Figure 6 is a schematic of a wall sample with penetration
FIG. 5
—A schematic showing cross sections of WER1 and WER2
FIG. 6
—Details of sample dimensions of a wall with penetration
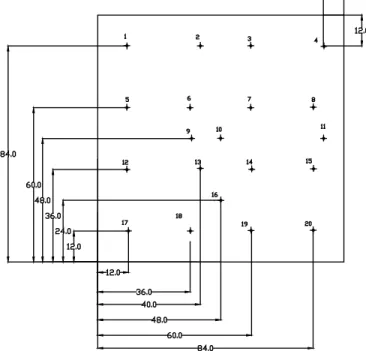
Each wall sample was instrumented to measure the surface temperature of internal and external surfaces as well as interstitial points. Figure 7 shows the locations of the surface thermocouples on one side, and Figure 8 shows the locations of interstitial thermocouple for a wall with penetrations.
96.00
96.00
2X6 in Economy Grade SPF Studs, 16 in on Center
Hexagonal and rectangular external junction boxes installed in accordance with construction practice
0.50 in gap (12.5 mm) Typical gap 1/4 - 1/2 in (6.35 - 12.5 mm) Double Top Header Stud Fastening: 3 1/2 in Spiral Nails, 2 minimum per stud-plate interface
Top Header Fastening; 3 in spiral nails on 16 in centers, 2 minimum per spacing
49.75
3/4 in hole bored 2 1/2 in from weatherside surface for 14-2 electrical wire
22.00 1.5 in PVC (38 mm) Galvanized duct 3.94 in (100 mm) window 47.2 x 23.6 in (600 x 1200 mm) 5.91 19.51
FIG. 7
—Surface thermocouple locations on a blank wall without penetration
FIG. 8
—Interstitial thermocouple locations (wall with a window frame)
Results
Air Leakage Tests Results
Figure 9 provides a summary plot of the air leakage test results of the ―un-conditioned‖ six walls. Also shown in that figure is the maximum allowable air leakage to qualify as an air barrier according (shown in red circle) to the CCMC Air Barrier Guide (set at 0.05 l/(s.m2) at ΔP=75). The air leakage tests were performed at several pressure differentials from ΔP=50 to 150 Pa, and all values were normalized to the standard temperature and pressure conditions (101.325 Pa and 20 °C).
B303 B 302B 301 B 309B308 B 307 B306B305 B 304 B220 B 219B218 B 217 B 216B 215 B 214 B 213B212 B211 B 203 B 202 B 201 B206B205 B204 B 209 B 208 B207 B 313 B312 B 311 B 316 B 315 B314 B 319 B 318 B317 C103 C102 C101 C106C105 C104 C109 C108C107 B210 B320 B 310 23-7/8" 47"
FIG. 9
—Summary of the air leakage rates of the six walls before conditioning
Figure 9 also shows that, with the exception of WER-1 and WER-5, all wall samples showed air leakage rate below the maximum allowable value to qualify as an air barrier at ΔP=75. The blank glass fiber insulated reference wall without penetration (WER-1) showed less air leakage rate than the reference glass fiber wall with penetration (WER-5).
It should be noted that WER-1 and WER-5 were built with a 6-mil polyethylene air barrier which was installed in a fashion that was considered representative of field practices, (as opposed to a meticulous lab installation e.g. poly lapped at joints but not sealed). Also, all SPF walls (i.e., WER-2, 3a, 3b and 4) featured additional sealing at seam of the double top plates. These practices will be recommended to achieve such level of air tightness in SPF walls.
Following the wall conditioning, an air leakage test was performed again on all samples. Figure 10 provides a summary of the air leakage of all the walls after conditioning. Comparing the air leakage rates in Figures 9 and 10, it could be observed that WER-1 and WER-5 showed a considerable increase in the air leakage rate as a result of the conditioning. On the other hand, all foamed walls showed a slight increase in the air leakage after conditioning, but almost all SPF walls still meet the CCMC allowable air leakage value and could meet the air barrier guide requirements.
FIG. 10
—Summary of the air leakage rates of the six walls after wall conditioning
WER, Air Leakage Test, Net Infiltration, Walls Unconditioned
0.0 0.1 0.2 0.3 0.4 0.5 0.6 0.7 0.8 0 25 50 75 100 125 150 175 Pressure (Pa) F lo w R a te ( L /( s *m ^ 2 )) CCMC Limit
WER-1 Glass fiber, no penetration WER-2 SPF, no penetration WER-3A SPF, no penetration WER-3B SPF, penetration WER-4 SPF, penetration WER-5 Glass fiber, penetration
WER, Air Leakage Test, Net Infiltration, Walls Conditioned
0.0 0.1 0.2 0.3 0.4 0.5 0.6 0.7 0.8 0 25 50 75 100 125 150 175 Pressure (Pa) F lo w R a te ( L /( s *m ^ 2 )) CCMC Limit
WER-1 Glass Fiber, no penetration WER-2 SPF, no penetration WER-3A SPF, no penetration WER-3B SPF, penetration WER-4 SPF, penetration WER-5 Glass Fiber, penetration
Thermal Resistance Tests Results
As indicated earlier, the value of each wall was determined before and after sample conditioning. Also, the R-values were determined at a warm side temperature of 20 1 C while the cold side was maintained at -20 1 C and -35 1 C.
Table 3 provides a summary of the R-values (in SI and Imperial units) of the six walls before and after sample conditioning, as determined at the two test conditions, and Figure 11 is a graphical presentation of the results. The hot box R-value are accurate within ±6%, which is an acceptable level of uncertainty associated with hot box measurements [10].
TABLE 3
—Summary of the R-values of the six walls.
FIG. 11
—Comparison of the walls R-values before and after conditioning
Analytical Approach
The advanced NRC-IRC hygrothermal model, hygIRC-2D [11, 12, 13, 14, 15and 16] was used for the thermal analysis of all wall assemblies. The model is capable to analyze transient heat, air and moisture transfer through building envelope components. However, in this research project its applicability is restricted to heat and airflow aspects only. In this paper, a limited amount of information about modelling is presented. A complete account of the analytical method and the computer simulation of the six walls will be presented in a separate publication in the near future.
Weather-side temperature
m2.K/ F.ft2.hr/ m2.K/ F.ft2.hr/ m2.K/ F.ft2.hr/ m2.K/ F.ft2.hr/
W BTU W BTU W BTU W BTU
WER-1 3.24 18.4 3.38 19.2 3.25 18.5 3.44 19.5
WER-2 3.6 20.4 3.57 20.3 3.53 20 3.5 19.9
WER-3a 3.89 22.1 3.82 21.7 3.85 21.9 3.82 21.7
WER-3b 3 17 3.12 17.7 2.86 16.2 2.99 17
WER-4 3.48 19.7 N/A N/A 3.3 18.7 3.31 18.8
WER-5 2.52 14.3 N/A N/A 2.78 15.8 2.84 16.1
-20 C -35 C -20 C -35 C
Unconditioned R-value Conditioned R-value m2.K/W
Wall #
WER Project Measured RSI @ -20 & -35 C
0 0.5 1 1.5 2 2.5 3 3.5 4 4.5
WER 1 WER 2 WER 3a WER 3b WER 4 WER 5
R
S
I Unconditionned (-20)Conditionned (-20)
Unconditionned (-35) Conditionned (-35)
Comparison of Experimental and Analytical Results
A comparison of the experimental R-values of the all walls was compared with those predicted by the hygIRC-2D model results at the same test conditions to ensure the accuracy of the results before proceeding to more general application of the methodology. As indicated earlier, only a limited comparison of experimental and computer simulation is presented here. Table 4 provides a summary of the experimental (hot box measurements) and analytical (hygIRC-2D model) R-values for WER-1 and WER-2. Table 4 also shows the predicted R-value of the two walls at 75 Pa pressure differential as determined by the 2D model. These predicted R-values by the model will be referred to as ―apparent R-values‖, since they include the impact of the air leakage through walls. This differentiation is necessary because the conventional R-value is determined with no air leakage present.
TABLE 4
—A summary comparison of the experimental and analytical R-values.
Calculation of the Wall Energy Rating (WER)
WER is a combined energy loss due to conduction and air leakage. The interaction between these two components of heat loss was discussed by Morrison, I.D. et al. [17] and Vertanen, M. [18]. The detailed calculation of WER is given in Elmahdy, et al, 2009. In this paper a summary of WER is presented to show the final results of the six walls.
In order to determine WER, the apparent R-value (Rwer) is determined from the following relationship:
wer
cond air i air
T
RSI
A
Q
Q
f
Q
(1)where:
RSIwer = Apparent RSI accounting for conduction and air leakage at
T
= 40 Kand
P
=75 Pa, (m2.K/W)cond
Q
= measured conduction heat loss through the specimen atT
= 40ºC, (W)air
Q
= measured heat loss due to air leakage through the specimen at 75 Pa pressure difference, (W)i
f
= factor of interaction (expressed as a fraction, ranging from 0 for no interaction, to an increasing fraction towards 1 for greater interaction between the heat loss terms)Substituting the appropriate quantities in the above equation, it can be simplified as:
(2)
where:
40
ghb
RSI
= measured RSI of the conditioned wall specimen using the guarded hot box test result atP
0 Pa andT
= 40 K75
p
q
= air leakage rate from the air tightness test, evaluated at 75 Pa, l/(s.m2)i
f
= factor of interactionThe factor of interaction,
f
i, is detrained from the simulation results by calculating the apparent R-valued atP
0 and 75 Pa from Table 4.Finally, WER is expressed as follows:
50
werT
WER
RSI
(3) where:WER wall energy rating, W/m2
Experiment P, Pa 0 0 75 WER 1
3.24
3.29
1.99
WER 23.6
3.58
3.4
Modelling (apparent R-value) P, Pa WALL ID RSI, m2.K/W @ T= 40KT
proposed standard temperature difference for evaluating WER, 40 K.To be consistent with CSA Standard A440.2 [19] for windows, an expression was sought to evaluate a heat loss density term expressed in Watts per unit area (W/m2) and results in a term that increases for better wall performance. In Equation 3, an apparent heat loss term was derived and an arbitrary positive number was added (50 W/m2 in this case) to make the final result positive. This was necessary because the two components of heat loss have a negative sign. The resulting WER increases with improved performance. This leads to the final WER formula as expressed in Equation 3. Table 5 is a summary of the derived factor of interaction,
f
i, and WER for all six walls.TABLE 5
—A summary of the derived factor of interaction and wall energy rating
Discussion
From Table 5, it is noted that the results for
f
i suggest little or no interaction between the conduction and air leakages streams for WER-2 (the tightest SPF specimen with no penetration), whereas there is apparent interaction obtained for the glass fibre specimens (WER-1 and WER-5) results, withf
i over 0.40 for both walls. The single SPF specimen with anf
iover 0.40 had wall penetrations, a signal that the increased air leakage associated with these are interacting with the conduction heat loss, possibly in the air space between the SPF and the gypsum. Since it is ongoing project, further analysis of
f
i and its relationship with wall construction and details will be presented in future papers.In order to generalize the application of this procedure, a larger sample of walls will be tested and evaluated. Four more walls of light density foam are being prepared for testing and evaluation using the procedure outlined in this paper.
Closing Remarks
A new and innovative procedure to determine the wall energy rating of polyurethane foam walls is presented. The procedure allows combining the heat loss due to conduction and air leakage to arrive at a value that could be used to rate insulated walls (SPF and glass fiber) for energy performance. The results showed that SPF insulated walls could provide air barrier layer without adding polyethylene sheets. The tested SPF wall samples met the requirements of CCMC Air Barrier Guide as a requirement of the Canadian Building Code.
More walls built with light density foams will be tested to provide conclusive results on the application of this procedure.
Acknowledgement
The authors wish to acknowledge the contribution from: Canadian Urethane Foam Contractors Association (CUFCA), Honeywell, BASF Canada and Demilec.
The authors would like to thank Mike Nicholls and Tim Aubin for fabricating the specimens. Thanks are extended to Mr. Rock Glazer, Robert Berzins, Ganapathy Gnanamurugan, Khaled Abdulghani and Stacey Nunes for having assembled the apparatus, set-up and carried out the experiments.