
HAL Id: hal-00301866
https://hal.archives-ouvertes.fr/hal-00301866
Submitted on 24 Oct 2005HAL is a multi-disciplinary open access
archive for the deposit and dissemination of sci-entific research documents, whether they are pub-lished or not. The documents may come from teaching and research institutions in France or abroad, or from public or private research centers.
L’archive ouverte pluridisciplinaire HAL, est destinée au dépôt et à la diffusion de documents scientifiques de niveau recherche, publiés ou non, émanant des établissements d’enseignement et de recherche français ou étrangers, des laboratoires publics ou privés.
Global impact of road traffic emissions on tropospheric
ozone
S. Matthes, V. Grewe, R. Sausen, G.-J. Roelofs
To cite this version:
S. Matthes, V. Grewe, R. Sausen, G.-J. Roelofs. Global impact of road traffic emissions on tropospheric ozone. Atmospheric Chemistry and Physics Discussions, European Geosciences Union, 2005, 5 (5), pp.10339-10367. �hal-00301866�
ACPD
5, 10339–10367, 2005
Impact of road traffic on tropospheric ozone S. Matthes et al. Title Page Abstract Introduction Conclusions References Tables Figures J I J I Back Close
Full Screen / Esc
Print Version Interactive Discussion
EGU
Atmos. Chem. Phys. Discuss., 5, 10339–10367, 2005 www.atmos-chem-phys.org/acpd/5/10339/
SRef-ID: 1680-7375/acpd/2005-5-10339 European Geosciences Union
Atmospheric Chemistry and Physics Discussions
Global impact of road tra
ffic emissions on
tropospheric ozone
S. Matthes1, V. Grewe1, R. Sausen1, and G.-J. Roelofs2
1
Institut f ¨ur Physik der Atmosph ¨are, DLR-Oberpfaffenhofen, Wessling, Germany
2
Institut for Marine Research, University of Utrecht, Utrecht, The Netherlands
Received: 15 August 2005 – Accepted: 8 September 2005 – Published: 24 October 2005 Correspondence to: S. Matthes ([email protected])
© 2005 Author(s). This work is licensed under a Creative Commons License.
ACPD
5, 10339–10367, 2005
Impact of road traffic on tropospheric ozone S. Matthes et al. Title Page Abstract Introduction Conclusions References Tables Figures J I J I Back Close
Full Screen / Esc
Print Version Interactive Discussion
EGU
Abstract
Road traffic is one of the major anthropogenic emission sectors for NOx, CO and NMHCs (non-methane hydrocarbons). We applied ECHAM4/CBM, a general circu-lation model coupled to a chemistry module, which includes higher hydrocarbons, to investigate the global impact of road traffic emissions on the atmosphere. Improving
5
over previous global modelling studies, which concentrated on road traffic NOx and CO-emissions only, we assess the impact of NMHC-emissions from road traffic. It is revealed that NMHC-emissions from road traffic play a key role for the impact on ozone. They are responsible for (indirect) long-range transport of NOx from road traffic via the formation of PAN, which is not found in a simulation without NMHC emissions
10
from road traffic. Long-range transport of NMHC-induced PAN impacts on the ozone distribution in northern hemisphere regions far away from the sources, especially in Arctic and remote maritime regions. There, during subsidence, PAN acts as a source for NOx, caused by thermal decay. Hence, ozone is produced. In July total road traffic emissions (NOx, CO and NMHCs) contribute to the zonally averaged ozone distribution
15
by more than 12% near the surface in the northern hemisphere midlatitudes and arctic latitudes. In January road traffic emissions contribute near the surface in northern and southern extratropics more than 8%. Sensitivity studies for regional emission show that effective transport of road traffic emissions occurs mainly in the free troposphere. In tropical latitudes of America up to an altitude of 200 hPa, global road traffic emissions
20
contribute about 4% to the ozone concentration.
1. Introduction
Ozone plays an important role in the troposphere due to its impact on the oxidizing capacity of the atmosphere, on air quality, and its contribution to the greenhouse effect. In the atmosphere NOx, CO and NMHCs act as ozone precursors, by forming radicals
25
ACPD
5, 10339–10367, 2005
Impact of road traffic on tropospheric ozone S. Matthes et al. Title Page Abstract Introduction Conclusions References Tables Figures J I J I Back Close
Full Screen / Esc
Print Version Interactive Discussion
EGU
oxidized by OH while nitric oxide determines oxidation pathways possibly leading to ozone production. The relevant NO2related reactions are:
NO+ O3→ NO2+ O2 (R1)
NO2+ O2→ O3+ NO (R2)
NO+ HO2→ NO2+ OH (R3)
5
O3+ HO2→ 2O2+ OH (R4)
Reaction (R2) is a net reaction of the photolysis of NO2 and subsequent ozone for-mation. Reactions (R1) and (R2) describe a photostationary equilibrium of NO/NO2 and O3 without net ozone production. Only if ozone is substituted in NO2-formation (Reaction R3) a net ozone production takes place. These conditions apply above a
10
threshold in the NO mass mixing ratio (typically above 10–30 ppt) when HO2 reacts preferably with NO (R3) and not with O3 (R4). As HO2 is formed during oxidation of CO and NMHCs (Crutzen et al.,1999;Atkinson,1990), their emissions are influencing significantly the above described photochemistry.
Road traffic is one of the main emitters of these ozone precursors, formed by the
15
combustion of fossil fuels inside internal combustion engines (gasoline and diesel). Although since the nineties reductions in road traffic specific emissions were achieved in certain regions due to the introduction of catalytic converters resulting in decreasing emission indices, global emissions are still supposed to grow in the future (OECD,
1995). Reasons for this are both, traffic growth rates, e.g. in developing regions, and
20
fuel intense vehicles counteracting mitigation strategies. In contrast to other transport modes, e.g. shipping and aviation, only few global modelling studies on the impact of road traffic exist. E.g.,Granier and Brasseur(2003) investigated the impact of NOxand CO emissions from road traffic and estimated relative contribution of such emissions to ozone concentrations near the surface in the northern hemisphere of between 12%
25
and 15% in industrialized regions and about 9% in remote regions. In our study we 10341
ACPD
5, 10339–10367, 2005
Impact of road traffic on tropospheric ozone S. Matthes et al. Title Page Abstract Introduction Conclusions References Tables Figures J I J I Back Close
Full Screen / Esc
Print Version Interactive Discussion
EGU
also consider the additional impact of NMHC-emissions from road traffic. The related impact on climate is dealt within a forthcoming paper.
The applied global atmosphere-chemistry model, emission data and experimental setup are described in Sect. 2. In Sect. 3 simulated NO2columns are evaluatex against satellite data, and extending results of existing model evaluation (Roelofs and Lelieveld,
5
2000;Houweling et al.,1998). In Sect. 4, results of our modelling study are presented
and discussed, with respect to the effect of total road traffic emissions, individual contri-butions from NOx, CO, and NMHCs emissions, and with respect to regional road traffic emissions. Section 5 gives a summary and concludes this study.
2. Model, emissions, and experimental setup
10
In order to study the impact of road traffic emissions on the atmospheric composi-tion we use the global circulacomposi-tion model ECHAM4 (Roeckner et al., 1996) coupled to the chemistry module CBM-IV (Gery et al., 1989), using a parameterized strato-spheric chemistry. The coupled model system (ECHAM4/CBM) has been developed and adapted for global modelling (Roelofs and Lelieveld,2000). ECHAM4 is a spectral
15
general circulation model which solves the primitive equations; for the present study it is used in T30 horizontal resolution with 19 layers vertical resolution (model top layer centered at 10 hPa), model physics are calculated on the associated Gaussian grid of about 3.75◦×3.75◦ geographical longitude vs. latitude. Water vapour, cloud water and the 35 tracers included in the chemistry model are transported by a semi-Lagrangian
20
advection scheme. CBM-IV is a carbon-bond-mechanism based on structural lumping with explicit representation of e.g. alkanes, alkenes, isoprene, aceton, formaldehyde. Aromatic compounds are neglected in the scheme used here, but sensitivity experi-ments performed with our chemistry model give a lower estimate of the contribution of aromatic compounds to atmospheric ozone in the order of 3% in strongly confined
25
regions.
ACPD
5, 10339–10367, 2005
Impact of road traffic on tropospheric ozone S. Matthes et al. Title Page Abstract Introduction Conclusions References Tables Figures J I J I Back Close
Full Screen / Esc
Print Version Interactive Discussion
EGU
year 1990 was chosen as reference year, since complete emission data and atmo-spheric observations were available. Global values of anthropogenic emissions (NOx, CO, and NMHCs) are given in Table 1. Anthropogenic NOx emissions amount to 27.6 Tg and include those from biomass burning (Hao and Liu, 1994) and from fos-sil fuel combustion (Benkovitz et al., 1996). Road traffic emissions (Matthes, 2003;
5
Matthes and Sausen,2000) of nitrogen oxide (included within fossil fuel combustion)
were calculated from the fossil fuel related emissions (Benkovitz et al.,1996) by extract-ing the fraction of road traffic given byOlivier et al.(1996). The geographical distribution of NOxemissions from road traffic is shown in Fig.1. Carbon monoxide emissions from fossil fuel combustion are taken fromOlivier et al.(1996), but have been enhanced by
10
15% to yield the global amount given inOECD(1995). Emissions from biomass burn-ing are adopted from Hao and Liu (1994). The NMHC emissions from road traffic were adapted according toHouweling et al.(1998): Individual emitted NMHC species
(Olivier et al.,1996) are lumped and thereby included in the carbon-bond-scheme of
the chemistry module according toGery et al.(1989). With this procedure around 80%
15
of total mass of NMHC emissions can be integrated into the model.
To determine the impact of emissions from road traffic, a number of individual sim-ulations were performed (Table 2): a control run (CTR90) and several scenario sim-ulations. A scenario consist of identical conditions except those emissions which are to be investigated are excluded in the model system. Three scenarios for individual
20
species emitted by road traffic (No NOx, No NMHC, No CO), one excluding all road traffic emissions (No road), and two scenarios without all road traffic emissions in a specific region (No USA, No EUR) were calculated. The impact of the individual road traffic emission component is then calculated as the difference between the specific scenario and CTR90 on a monthly mean basis (four years averaging period after two
25
years spin-up time).
ACPD
5, 10339–10367, 2005
Impact of road traffic on tropospheric ozone S. Matthes et al. Title Page Abstract Introduction Conclusions References Tables Figures J I J I Back Close
Full Screen / Esc
Print Version Interactive Discussion
EGU
3. Comparison with observations
The representation of the atmospheric NOxdistribution is of crucial importance for the simulation of the impact of road traffic emission. Satellite data of tropospheric NO2 have been made available only recently (Richter and Burrows,2002) from the GOME measurements. We compare these with simulated NO2 columns based on monthly
5
means of four consecutive years, following Lauer et al. (2002), who applied the so-called tropospheric excess method (TEM) on model data.
Figure2gives a global picture of the model’s capability and indicates that the model system is able to capture the main pattern of the atmospheric NOx distribution. Nega-tive values indicate that the reference sector in this latitude is not free of tropospheric
10
contributions to the total NO2 column (see also discussion on application of TEM low). A conclusion on the quantitative model performance is hard to draw, first, be-cause of uncertainties in the observational data be-caused by clouds and a low sensitivity in surface-near NO2, which may dominate the total tropospheric column, and, second, because of different meteorology between observational data and modelled data. The
15
tropospheric NO2columns are influenced by vertical mixing within the boundary layer, which is determined by the respective meteorological conditions. As a general circula-tion model calcultes its own meteorological state and does not use measured meteo-rological data as input, these conditions can differ quite substantially different between individual periods from modelling studies and observations. A vertically limited
bound-20
ary layer can promote an enrichment of NOxin this layer, causing high troposheric NO2 columns.
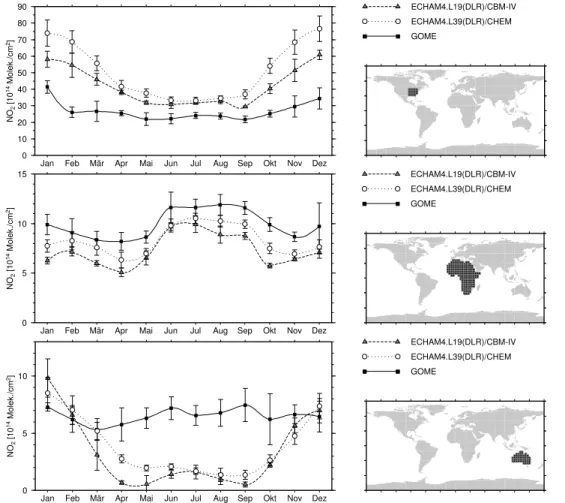
Comparing the amplitude of the seasonal cycle of the tropospheric NO2 column densities in industrialized regions (eastern USA) indicates an agreement within 20% (Fig.3). In Fig. 3 additional results from model studies including a chemistry scheme
25
which does not include higher hydrocarbons (ECHAM4.L39(DLR)/CHEM) are given
(Lauer et al., 2002). In industrialized regions of the northern hemisphere deviations
ACPD
5, 10339–10367, 2005
Impact of road traffic on tropospheric ozone S. Matthes et al. Title Page Abstract Introduction Conclusions References Tables Figures J I J I Back Close
Full Screen / Esc
Print Version Interactive Discussion
EGU
corresponds to a stronger reduced vertical mixing in the boundary layer in wintertime. On the other hand, the observations have a small sensitivity in the surface layer of the atmosphere due to physical reasons. This can serve as an explanation why mod-elled data are higher than observed values. Additionally, clouds in wintertime prevent observations with the satellite instrument, which causes a sparse data base for
north-5
ern hemispheric winter (December and January) and can cause a systematic bias of measurements. Deviations between observed and modelled NO2 columns amount to values between 15% and 30%. Deviation of more than 50% are only found in remote regions with column densities of NO2 below 10·1014mol. cm−2 (Fig.3, third row), be-cause, first, in these regions respective tropospheric NO2-columns are very low and,
10
second, the corresponding reference sector in the model system is influenced by tro-pospheric NO2. Therefore, the TEM can not be applied within these model regions reliably in order to deduce NOxtropospheric columns.
The preceding comparison shows that the ECHAM4/CBM is able to reproduce the general pattern of the global NO2column density distribution calculated with the TEM
15
within regions where the reference sector does show no tropospheric influence (’clean air’). However absolute maximum values in industrialized areas (high NOx-regions) show a tendency of higher values in the model than in observations. Due to non-linear photochemistry this would cause a lower estimate of ozone productivity of NOx emissions.
20
4. Results
4.1. Impact of total road traffic emissions
The changes in zonal monthly mean concentrations (CO, NOx, alkanes, ozone) due to total road traffic emissions are presented in Fig. 4for January and July (difference between the simulations No rt and CTR90). Road traffic contributes to atmospheric
25
carbon monoxide concentrations in the free troposphere of the summertime northern 10345
ACPD
5, 10339–10367, 2005
Impact of road traffic on tropospheric ozone S. Matthes et al. Title Page Abstract Introduction Conclusions References Tables Figures J I J I Back Close
Full Screen / Esc
Print Version Interactive Discussion
EGU
extratropics by more than 12% (Fig.4, first row). In January, contributions of more than 24% are reached in the northern hemisphere due to a longer chemical lifetime (less photolysis in winter). In the southern extratropics relative contributions in the free tropo-sphere are lower than in the northern extratropics due to smaller road traffic emissions in southern latitudes. Relative contributions amount to less than 8% in January
(sum-5
mer) and to less than 12% in July (winter). The highest values occur in source regions, with maximum contributions to atmospheric CO in January in the northern hemisphere near the surface (up to 32%).
Road traffic emissions contribute to atmospheric NOx (Fig.4, 2nd row) by a similar order of magnitude as to CO, ranging from 8% to 24%, depending on altitude and
sea-10
son. However, the impact of NOx emissions compared to CO is much more confined to the vicinity of the source regions as the atmospheric lifetime of NOx is about one order of magnitude shorter than the lifetime of CO. In midlatitudes near the surface, contributions up to 32% are calculated, whereas in the free troposphere values around 12% are found. Beside these high contributions in midlatitudes, relative contributions
15
of more than 50% appear in arctic regions. These relative contributions correspond to absolute contributions in arctic regions of about 5 ppt NOx. This effect is particularly pronounced in winter (January). As will be shown in the sensitivity studies in the next section these high contributions are caused by NMHC road traffic emissions leading to enhanced formation of PAN. PAN is then transported throughout the hemisphere and
20
decomposes in subsidence regions (Sect.4.3). This represents an indirect transport of NOx from road traffic.
The impact of road traffic emissions on atmospheric concentration of alkanes (Fig.4, 3rd row) reaches relative contributions of more than 50%. Alkanes are selected as a representative for a NMHC with comparatively long chemical lifetime. These high
rela-25
tive contributions show that road traffic represents one of the major emitters of alkanes, for which anthropogenic sources dominate. In the northern hemisphere, again relative contributions are higher in winter than in summer (indicated by larger atmospheric re-gions with contributions above 50% are larger), due to longer chemical lifetimes in
ACPD
5, 10339–10367, 2005
Impact of road traffic on tropospheric ozone S. Matthes et al. Title Page Abstract Introduction Conclusions References Tables Figures J I J I Back Close
Full Screen / Esc
Print Version Interactive Discussion
EGU
winter. In the southern hemisphere (SH), this seasonality can not be noticed in the dis-tributions of relative condis-tributions (Fig.4) but only in absolute contributions (Matthes,
2003), due to strong seasonality of natural emissions, which compensates for the sea-sonal cycle of the NMHC lifetimes and of OH concentrations, respectively.
Characteristic differences in the pattern of the relative contributions of road
traf-5
fic emissions to the distribution of atmospheric ozone (Fig. 4, bottom) can be found between January and July. Its seasonality shows a pattern opposite to the primary species (see above), with maximum ozone contributions occurring in summer and min-imum values in winter. While ozone formation is increased by an enhanced abundance of its precursors, not only the concentration of precursors is of importance, but also
10
the photochemical activity which has its maximum in summer. In the summer hemi-spheres, relative contributions to the atmospheric burden of ozone of more than 12% (NH) and 8% (SH) from road traffic induced ozone occur. In winter hemispheres rela-tive contributions are lower by a factor between 1.5 and 2 in the NH and of about 3 in the SH.
15
The road traffic effect to the SH ozone budget in summer (January) appears overpro-portionally high considering the fact that road traffic NOxemissions in southern regions amount to only about 3% of the global total road traffic emissions. Reason for this comparatively high relative ozone contribution in the southern hemisphere is the low background concentrations of trace gases, especially nitrogen oxides. As productivity
20
of ozone production decreases with increasing NOx concentrations (Liu et al.,1980,
1987) NOx emissions from road traffic are much more effective when emitted in the southern hemisphere. In the northern hemisphere ozone production takes place at high NOx concentrations, often in the saturation regime. Thus a further NOxincrease only leads to a weak increase of the production rate or even to a decrease.
25
For direct comparison of our results to those presented by Granier and Brasseur
(2003), the horizontal distribution of relative contributions to surface ozone is shown (Fig. 5, left). In July, an overall increase in surface ozone due to total road traffic emissions of up to 15% in non-source regions in northern extratropics (e.g. North
ACPD
5, 10339–10367, 2005
Impact of road traffic on tropospheric ozone S. Matthes et al. Title Page Abstract Introduction Conclusions References Tables Figures J I J I Back Close
Full Screen / Esc
Print Version Interactive Discussion
EGU
lantic, North Pacific) and higher contributions of little more than 16% in source regions (e.g. central Europe, USA, Japan) can be found (lower panel). In source regions, these results are comparable to the findings ofGranier and Brasseur(2003), who calculated about the same relative contribution (15%). However, a remarkable difference occurs in non-source regions where their calculation showed lower relative contributions of 6
5
to 9%, only. Looking at the impact of individual road traffic emission compounds (see Fig. 5, middle and right), the origin of this difference can be attributed to the neglec-tion of NMHC road traffic emissions. In the southern hemisphere, relative contributions remain lower than on the northern hemisphere, with values of more than 8% being cal-culated only in July in continental source regions and more than 4% contribution only
10
in certain outflow regions (e.g. Pacific ocean, east coast of South America, tropical pacific), which is comparable to the findings ofGranier and Brasseur(2003).
As Granier and Brasseur (2003) give only values for July, no direct comparison is
possible for January. By comparing the impact of total road traffic emissions with the impact of NOx emission only (Fig. 5), the significant role of NMHCs becomes again
15
obvious. In the northern hemisphere in January, the relative contribution of total road traffic emissions remain much lower in source regions compared to July with only more than 8%, sometimes even less due to weaker photochemistry (as mentioned before). Relative contributions of more than 16% are only found in a few locations, e.g. southern USA, Arabian Peninsular. In January however, the relative contributions in southern
20
latitudes are higher due to enhanced photochemistry (summer) and low background concentrations (see discussion above). There, relative contributions of more than 16% are found in industrialized centres (e.g. South America, New Zealand). Over large parts of southern hemispheric extratropics oceans relative contributions or more than 8% are simulated. This emphasises the considerable long-range impact of road traffic
25
ACPD
5, 10339–10367, 2005
Impact of road traffic on tropospheric ozone S. Matthes et al. Title Page Abstract Introduction Conclusions References Tables Figures J I J I Back Close
Full Screen / Esc
Print Version Interactive Discussion
EGU
4.2. Importance of individual emissions for ozone
To determine the impact of individual components from road traffic emissions we will discuss now separate sensitivity experiments for NOx, CO and NMHC emissions only (Table2).
In Fig. 5, the individual contributions of either NOx (middle) or NMHCs emissions
5
(right) together with the total impact of road traffic (left, already discussed in the last sub-section) to surface ozone are shown. Maximum contributions to atmospheric ozone from road traffic NOx emissions are found in summer in source regions and downwind regions (about 15%), especially over North America and Europe. In January, road traffic NOxemissions even lead to ozone decrease in source regions, caused by a
10
dominating decrease of ozone productivity of NOxwith increasing NOxconcentrations. NMHCs (like CO) act as a source for the hydroperoxyl radical (Reaction R5)
RH+ OH → R + HO2 (R5)
thereby influencing Reactions (R3) and (R4). In these strongly confined regions, this results in ozone production and an ozone increase due to road traffic NMHC emission
15
of about 12%. In other northern hemisphere regions, especially in higher latitudes, an ozone increase by around 4% is found, with higher contributions (up to 6%) in remote areas (e.g. oceans, Arctic) than in sources regions (approximately 2%), other than the hot spots (e.g. parts of Europe and USA).
In January the mechanism remains the same, but acts on a lower level due to
20
slow photochemistry. Northern hemisphere regions in which ozone titration occurs are larger, as well as regions, where NMHC emissions cause an increase in ozone (North America, East Europe).
The impact of CO-emissions from road traffic on atmospheric ozone is not shown because it is about a factor 10 smaller than that of NOx-emissions in either January
25
and July.
Figure6 displays the zonal mean ozone change due to individual emission compo-nents from road traffic, in order to quantify the different role of road traffic NOx and
ACPD
5, 10339–10367, 2005
Impact of road traffic on tropospheric ozone S. Matthes et al. Title Page Abstract Introduction Conclusions References Tables Figures J I J I Back Close
Full Screen / Esc
Print Version Interactive Discussion
EGU
NMHC emissions in the free troposphere (for totals see Fig. 4, bottom). The effect of both, total emissions and NOx emissions, is strongest in latitudes where the main source regions of road traffic emissions are located (15◦N–60◦N). In July, NOx emis-sions in northern hemispheric source regions contribute by more than 10% to the zon-ally averaged near surface ozone. At 800 hPa and below, a relative contribution of
5
more than 8% can be attributed to road transport NOx emissions in these latitudes. More regional considerations show (see Sect. 4.4), the atmospheric distributions in these altitudes are predominantly influenced by regional emissions. This is consistent with the short atmospheric lifetime of NOx of only several days. At higher altitudes up to 300 hPa, relative contributions of global road traffic NOxemissions of more than 4%
10
can be noticed in July. Generally, about 70% of the total ozone increases is caused by NOx emissions from road transport at latitudes, where the main sources are located, and in the free troposhere. Zonal gradients are distinct for NOxrelated ozone increase especially in July, reflecting fast photochemistry and related short atmospheric lifetime. In July, NMHC emissions contribute considerably less than NOxemissions to ozone
15
in those source latitudes (15◦N–60◦N) with only about 3% (Fig.6, middle row). Ozone contributions, of about 6%, are found in remote regions (e.g. arctic latitudes). In these remote regions the effect due to NMHC emissions has about the same strength as due to NOx emissions (Fig. 6, upper row), which is consistent with above discussed contributions to surface ozone. The mechanism for the long-range impact of NMHC
20
emissions from road transport is additional PAN-formation (see Sect.4.3). In January, road traffic NMHC emissions contribute strongest to zonally averaged ozone in source latitudes with more than 4% relative contribution, by inhibiting ozone titration, and more than 2% in northern hemispheric extratropics, but outside the main source regions. Again the strong contribution in arctic latitudes in noteworthy.
25
As mentioned above, the impact of CO emissions from road traffic on atmospheric ozone is about a factor of 10 smaller than that of NOx emissions in both January and July. Relative contributions of 1% and 2% can be found in latitudes north of 30◦N below 400 hPa, elsewhere it is even less.
ACPD
5, 10339–10367, 2005
Impact of road traffic on tropospheric ozone S. Matthes et al. Title Page Abstract Introduction Conclusions References Tables Figures J I J I Back Close
Full Screen / Esc
Print Version Interactive Discussion
EGU
To sum up these results it can be noted that the total impact of road traffic emissions (NOx, CO, NMHCs) is dominated by the impact of NOxemissions in source regions and while it is substantially influenced by the impact of NMHC (and CO) emissions in non-source regions. This importance of NMHC emissions (and partly CO) became obvious from the comparison between the impact due to exclusive consideration of NOx and
5
the impact by consideration of all three emission species together (NOx, NMHCs, CO). Particularly, relative contributions of road traffic emissions in remote regions increase, e.g. in arctic regions in July, from about 8% to about 15%. As will be shown in the next section (Sect.4.3) the mechanism for long-range impact of NMHC emissions is transport of additionally formed PAN, which acts as a temporal reservoir for NOx and
10
allows an indirect long-range transport of NOx from source regions.
Our results largely agree with those of Granier and Brasseur (2003), when com-paring their total road traffic impact (NOx and CO only) to our sensitivity experiments for NOx and CO emissions only (No NOx, No CO). As Granier and Brasseur (2003) did not account for road traffic NMHC emissions, they underestimated the total impact
15
of road traffic emissions on ozone. The sensitivity experiment for NMHC emissions (No NMHC) revealed that in remote areas NMHCs act as an additonal source for road traffic induced ozone. In these areas ozone is formed due to long-range transport of PAN from NMHC road traffic emissions.
4.3. Role of road traffic NMHC emissions in PAN formation and long-range transport
20
into Arctic latitudes
We have mentioned several times the importance of PAN as reservoir species for trans-ferring NOx emissions to regions far away from the sources. NMHC emissions from road traffic form PAN together with atmospheric NOx in source regions. PAN is ther-mally stable at low temperatures and can be transported over long distances to remote
25
regions. Subsidence causes an adiabatic heating, causing PAN to decay thermally and leads to additional NOx. In low-NOx regions this NOx leads to ozone production and as a consequence causes high relative contributions of road traffic emissions to
ACPD
5, 10339–10367, 2005
Impact of road traffic on tropospheric ozone S. Matthes et al. Title Page Abstract Introduction Conclusions References Tables Figures J I J I Back Close
Full Screen / Esc
Print Version Interactive Discussion
EGU
ally averaged ozone concentrations in remote regions of more than 6% (Fig.6, middle row).
As one example for remote regions, the regionally averaged concentration changes of PAN due to road traffic emissions are shown in Fig.7in both northern hemispheric mid-latitudes and arctic regions. A strong PAN enhancement is indicated due to all road
5
traffic emissions (solid lines), a slightly weaker due to NMHC emissions only (dashed lines) and clearly weaker due to NOx emissions only (dotted lines). In spring, in arctic (PN) and mid-latitudes (NHE), total road traffic emissions are responsible for a PAN en-hancement of 75 ppt (solid line, regional average north of 68◦below 550 hPa), whereas NMHC emissions alone cause in arctic latitudes an increase of about 65 ppt (dotted
10
line). On the other hand, NOx emissions alone cause a PAN increase of only about 20 ppt (dashed line). Hence, NMHC emissions are responsible for about 90% of PAN enhancement in winter and springtime in arctic latitudes (PN). Due to higher atmo-spheric temperatures in spring and summer, the absolute size of this effects decreases from April on. In summer absolute values only amount to about 20 ppt contribution
15
due to gaseous road traffic emissions (NOx, NMHCs and CO). Nevertheless NMHCs still represent the major contributor with about 50%. Hence Fig.7illustrates that road traffic NMHC-emissions are crucial for the formation and long-range transport of PAN which then causes ozone contribution of road traffic in remote regions.
The synthesis of the role for the impact of all three individual emission components is
20
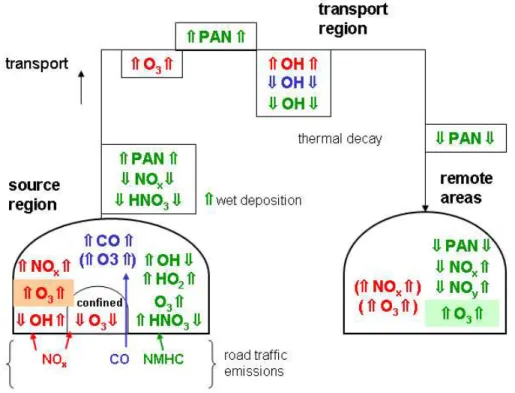
illustrated in Fig.8 for the three different regions: source regions (e.g. Europe), trans-port regions (free troposphere) and remote regions (e.g. Atlantic ocean, Arctic). The scheme includes the impact on the Hydroxylradical. In source regions, NOx emissions from road traffic (red colored) are mainly important for ozone production depending on season. This causes a decrease in winter (January) and an increase in summer
25
(July) of the concentrations of the atmospheric hydroxyl radical. In strongly confined regions (high-NOx) increasing HOx can strongly reduce ozone productivity and over-compensate the NOx increase due to road traffic emissions, causing a decrease of ozone. n source regions, generally NMHC emissions convert additional OH into HO2
ACPD
5, 10339–10367, 2005
Impact of road traffic on tropospheric ozone S. Matthes et al. Title Page Abstract Introduction Conclusions References Tables Figures J I J I Back Close
Full Screen / Esc
Print Version Interactive Discussion
EGU
during their oxidation (Reaction R5). Radicals formed during the oxidation process produce more HOx than they consume within their initial reaction. The enhanced HOx increases ozone productivity of nitrogen oxides. In winter HOxincreases so strongly in source regions of the northern hemisphere that – in spite of a relative decrease of HOx – OH increases. The increased OH concentrations form an enhanced sink for NOx
5
and more HNO3 is produced. In transport regions PAN concentrations are enhanced and NOx are reduced due to NMHC emissions from road traffic. On the other hand, HNO3 concentrations are reduced due to wet deposition in transported air masses. During subsidence of air masses PAN decomposes thermally and the PAN concen-tration decreases. In remote regions the above mentioned impact of NMHCs makes
10
these species responsible for a major ozone increase.
Figure 5 showed that ozone destruction due to road traffic NOx emissions occurs in the industrialized areas in Central Europe and North America. Since NMHC road traffic emissions cause long-range transport of NOx (see above) the geographic origin of emissions is of primary interest. Therefore, we performed studies of regional road
15
traffic emissions (NOx, NMHCs, CO): USA only or Europe only (No rtusa and No rteur in Table2), which will now be discussed.
4.4. Impact of regional emissions from the USA and Europe
The results of the USA and Europe related impact simulations are shown in Fig. 9. The meriodionally averaged, relative contributions to atmospheric ozone (Fig. 9,
up-20
per row) indicate that long-range transport occurs eastward. In the free troposphere (above 900 hPa) over the USA in midlatitudes, global road traffic contributes by about 6%, whereas emissions from the USA itself contribute more than 3%. In the free tro-posphere over the Atlantic, 2% to 4% of the ozone concentration has its origin in road traffic emissions in USA and about 1% originates from Europe, out of a road traffic
con-25
tribution from global road traffic emissions of 4% to 5%. In the free troposphere over Europe in midlatitudes, emissions from the USA still contribute by more than 2%, where the impact of global road traffic emissions amounts to 6% (700 hPa–300 hPa; 30◦E).
ACPD
5, 10339–10367, 2005
Impact of road traffic on tropospheric ozone S. Matthes et al. Title Page Abstract Introduction Conclusions References Tables Figures J I J I Back Close
Full Screen / Esc
Print Version Interactive Discussion
EGU
and road traffic emissions from Europe contribute by up to 2%. Further east (30◦E– 130◦E) in the free troposphere relative contributions from Europe and the USA have about the same size of 1% here; global emissions contribute more (about 5%). Over Asia, where global road traffic emissions contribute about 4% to mid-latitude ozone abundance a contribution of about 1% due to road traffic emissions in the USA can
5
be found (Fig.9, middle row) whereas on the other hand, emissions from Europe con-tribute there about 0.5%. Results shows that Europe and USA road traffic emissions can represent up to 50% of the global road traffic contribution to the ozone distribu-tion in mid-latitudes in the free troposphere. Surface ozone concentradistribu-tions are only significantly affected by long-range transport in remote areas.
10
In northern tropics (Fig.9, right panels), global road traffic emissions contribute more than 4% above the USA/Central America to atmospheric ozone. Road traffic in the USA represents with around 1% only about a quarter of these total ozone contributions (up to 200 hPa in tropical latitudes). European emissions from road traffic show a maximum relative contribution of 0.5% around 30◦E (Arabian Peninsular), clearly illustrating the
15
minor importance of European road traffic emissions for the tropics. The sensitivity studies show the strong zonal transport of road traffic impact on ozone, and the much weaker meridional transport.
5. Summary and conclusions
Our results indicate that in July road traffic emissions (NOx, CO, and NMHCs)
con-20
tribute to the zonally averaged tropospheric ozone concentration by more than 12% in northern hemisphere midlatitudes and arctic latitudes. In January, road traffic con-tributes near the surface both in northern and southern extratropics more than 8%. Relative contributions near the surface to northern hemispheric midlatitudes ozone amount to more than 12% in remote regions. The simulations with ECHAM4/CBM
25
show that the exclusive consideration of NOx for assessing the impact of road traffic emissions neglects an important impact due to NMHC emissions. This holds in
partic-ACPD
5, 10339–10367, 2005
Impact of road traffic on tropospheric ozone S. Matthes et al. Title Page Abstract Introduction Conclusions References Tables Figures J I J I Back Close
Full Screen / Esc
Print Version Interactive Discussion
EGU
ular for the consequences of long range transport of emissions for atmospheric ozone in remote regions which is underestimated by about 30% when only considering NOx and CO emissions. For assessing the climate impact of road traffic emissions NMHCs have to be considered. Regional studies have emphasised the regional and long-range contributions to ozone enhancement in the free troposphere, showing that global
emis-5
sion distributions have to be well known even for regional ozone studies in the free troposphere. Future increase in southern hemispheric regions, e.g. due to economic development in these regions will lead to comparative high ozone contributions to at-mospheric ozone.
Acknowledgements. BMW AG funded part of the work of S. Matthes. 10
References
Atkinson, R.: Gas-phase tropospheric chemistry of organic compounds: a review, Atmos. Env., 24A, 1–41, 1990. 10341
Benkovitz, C., Scholtz, M., and Pacyna, J.: Global gridded inventories of anthropogenic emis-sions of sulfur and nitrogen, J. Geophys. Res., 101, 29 239–29 253, 1996. 10343
15
Crutzen, P., Lawrence, M., and P ¨oschl, U.: On the background photochemistry of tropospheric ozone, Tellus, 51A-B, 123–146, 1999. 10340,10341
Gery, M., Whitten, G., Killus, J., and Dodge, M.: A photochemical kinetics mechanism for urban and regional scale modelling, Geophys. Res. Lett., 94, 12 925–12 956, 1989. 10342,10343
Granier, C. and Brasseur, G.: The impact of road traffic on global tropospheric ozone, Geophys.
20
Res. Lett., 30, 1086, doi:10.1029/2002GL015972, 2003. 10341,10347,10348,10351
Hao, W. and Liu, M.: Spatial and temporal distribution of tropical biomass burning, Glob. Bio-geochem. Cycles, 8, 495–503, 1994. 10343
Houweling, S., Dentener, F., and Lelieveld, J.: The impact of nonmethane hydrocarbon com-pounds on the tropospheric photochemistry, J. Geophys. Res., 103, 10 673–10 696, 1998.
25
10342,10343
Lauer, A., Dameris, M., Richter, A., and Burrows, J.: Tropopsheric NO2columns: a comparison between model and retrieved data from GOME measurements, Atmos. Chem. Phys., 2, 67–
ACPD
5, 10339–10367, 2005
Impact of road traffic on tropospheric ozone S. Matthes et al. Title Page Abstract Introduction Conclusions References Tables Figures J I J I Back Close
Full Screen / Esc
Print Version Interactive Discussion
EGU
78, 2002,
SRef-ID: 1680-7324/acp/2002-2-67. 10344
Liu, S., McFarland, M., Kley, D., Mahlman, J., and Levy II, H.: On the origin of tropospheric ozone, J. Geophys. Res., 85, 15 879–15 888, 1980. 10347
Liu, S., Trainer, M., Fehsenfeld, F., Parrish, D., Williams, E., Fahey, D., H ¨ubler, G., and Murphy,
5
P.: Ozone production in the rural troposphere and the implication for regional and global ozone distribution, J. Geophys. Res., 92, 4191–4207, 1987. 10347
Matthes, S.: Globale Auswirkung des Straßenverkehrs auf die chemische Zusammensetzung der Atmosph ¨are, PhD thesis, Ludwig-Maximilians Universit ¨at M ¨unchen, 2003. 10343,10347
Matthes, S. and Sausen, R.: Absch ¨atzung der Emissionen in den EU-15 Staaten im Zeitraum
10
1980 bis 2015, Tech. rep., German Space Center (DLR), Oberpfaffenhofen, Germany, 2000.
10343
OECD: Motor vehicle pollution, Tech. rep., OECD Organisation for economic co-operation and development, Paris, France, 1995. 10341,10343
Olivier, J., Bouwman, A., van der Maas, C., Berdowski, J., Veldt, C., Bloos, J., Visschedijk,
15
A., Zandveld, P., and Haverlag, J.: Description of EDGAR 2.0: A set of global emission inventories of greenhouse gases and ozone depleting substances for all anthropogenic and most natural sources on a per country basis on a 1◦×1◦ grid, Tech. rep., RIVM, Bilthoven, Netherlands, 1996. 10343
Richter, A. and Burrows, J.: Retrieval of Tropospheric NO2 from GOME Measurements, Adv.
20
Space Res., 29, 1673–1683, 2002. 10344,10360,10361
Roeckner, E., Arpe, K., Bengtsson, L., Christoph, M., Claussen, M., D ¨umenil, L., Esch, M., Giorgetta, M., Schlese, U., and Schulzweida, U.: The Atmospheric General Circulation Model ECHAM-4: Model Description and Simulation of Present-day Climate, Tech. rep., Max-Planck-Institute for Meteorology, Hamburg, Germany, 1996. 10342
25
Roelofs, G.-J. and Lelieveld, J.: A three dimensional chemistry-general circulation model: Influ-ence of higher hydrocarbon chemistry, J. Geophys. Res., 105, 22 697–22 712, 2000. 10342
ACPD
5, 10339–10367, 2005
Impact of road traffic on tropospheric ozone S. Matthes et al. Title Page Abstract Introduction Conclusions References Tables Figures J I J I Back Close
Full Screen / Esc
Print Version Interactive Discussion
EGU Table 1. Global annual anthropogenic emissions of nitrogen oxides (NOx), carbon monoxide
(CO) and non-methane hydrocarbons (NMHCs), for references see text. Anthropogenic total, fossil fuel combustion and herein included emissions due to road traffic are given (o/w = of which).
Emissions NOx CO NMHCs
Tg [N] Tg [CO] Tg Anthropogenic 27.6 678.4 177.5 Fossil fuel 22.6 478.4 41.6 o/w road traffic 8.8 236.9 33.2
ACPD
5, 10339–10367, 2005
Impact of road traffic on tropospheric ozone S. Matthes et al. Title Page Abstract Introduction Conclusions References Tables Figures J I J I Back Close
Full Screen / Esc
Print Version Interactive Discussion
EGU Table 2. Overview of model simulations performed; rt= road transport, w/o = without.
Name Description Base runs
CTR90 emissions from all sources
No rt w/o NOx, NMHCs, CO from road traffic Effect of individual emission
No NOx w/o NOxfrom road traffic No NMHC w/o NMHC from road traffic No CO w/o CO from road traffic
Regional effects
No rtusa w/o emissions from road traffic in USA No rteur w/o emissions from road traffic in Europe
ACPD
5, 10339–10367, 2005
Impact of road traffic on tropospheric ozone S. Matthes et al. Title Page Abstract Introduction Conclusions References Tables Figures J I J I Back Close
Full Screen / Esc
Print Version Interactive Discussion EGU 180˚ 120˚W 60˚W 0˚ 60˚E 120˚E 180˚ 90˚S 60˚S 30˚S 0˚ 30˚N 60˚N 90˚N 0.01 1.00 3.00 10.00 30.00 100.00 300.00 10-10 g/cm2/s
Fig. 1. NOxemission [10−11gcm−2s−1] from road traffic in 1990.
ACPD
5, 10339–10367, 2005
Impact of road traffic on tropospheric ozone S. Matthes et al. Title Page Abstract Introduction Conclusions References Tables Figures J I J I Back Close
Full Screen / Esc
Print Version Interactive Discussion EGU 180˚ 120˚W 60˚W 0˚ 60˚E 120˚E 180˚ 90˚S 60˚S 30˚S 0˚ 30˚N 60˚N 90˚N January-ECHAM4/CBM 180˚ 120˚W 60˚W 0˚ 60˚E 120˚E 180˚ 90˚S 60˚S 30˚S 0˚ 30˚N 60˚N 90˚N January-GOME96-00 180˚ 120˚W 60˚W 0˚ 60˚E 120˚E 180˚ 90˚S 60˚S 30˚S 0˚ 30˚N 60˚N 90˚N July-ECHAM4/CBM 180˚ 120˚W 60˚W 0˚ 60˚E 120˚E 180˚ 90˚S 60˚S 30˚S 0˚ 30˚N 60˚N 90˚N July-GOME96-00 -10 -5 -1 1 5 10 20 30 40 60 80 100 120 1014 mol./cm2
Fig. 2. Tropospheric NO2 columns [1014mol. cm−2] derived from GOME satellite data (right) (Richter and Burrows,2002) and ECHAM4/CBM model simulations (left) for January (top) and July (bottom).
ACPD
5, 10339–10367, 2005
Impact of road traffic on tropospheric ozone S. Matthes et al. Title Page Abstract Introduction Conclusions References Tables Figures J I J I Back Close
Full Screen / Esc
Print Version Interactive Discussion EGU 0 10 20 30 40 50 60 70 80 90 NO 2 [10 14 Molek./cm 2]
Jan Feb Mär Apr Mai Jun Jul Aug Sep Okt Nov Dez
USA(Osten) b) ECHAM4.L19(DLR)/CBM-IV ECHAM4.L39(DLR)/CHEM GOME 0 5 10 15 NO 2 [10 14 Molek./cm 2]
Jan Feb Mär Apr Mai Jun Jul Aug Sep Okt Nov Dez
Afrika f) ECHAM4.L19(DLR)/CBM-IV ECHAM4.L39(DLR)/CHEM GOME 0 5 10 NO 2 [10 14 Molek./cm 2]
Jan Feb Mär Apr Mai Jun Jul Aug Sep Okt Nov Dez
Australien
e) ECHAM4.L19(DLR)/CBM-IV
ECHAM4.L39(DLR)/CHEM GOME
Fig. 3. Regional tropospheric NO2-columns derived from GOME satellite data (Richter and Burrows,2002) and ECHAM4 model simulations (in 1014mol. cm−2). The respective geographic region for averaging is indicated in black: eastern USA, Africa and Australia.
ACPD
5, 10339–10367, 2005
Impact of road traffic on tropospheric ozone S. Matthes et al. Title Page Abstract Introduction Conclusions References Tables Figures J I J I Back Close
Full Screen / Esc
Print Version Interactive Discussion EGU January July 2 4 6 8 100 200 300 400 500 600 700 800 900 1000 pressure [hPa] -90 -60 -30 0 30 60 90 90˚S 60˚S 30˚S Ä 30˚N 60˚N 90˚N ∆ CO [%] 246 8 100 200 300 400 500 600 700 800 900 1000 -90 -60 -30 0 30 60 90 90˚S 60˚S 30˚S Ä 30˚N 60˚N 90˚N ∆ CO [%] 2 4 6 8 8 100 200 300 400 500 600 700 800 900 1000 pressure [hPa] -90 -60 -30 0 30 60 90 90˚S 60˚S 30˚S Ä 30˚N 60˚N 90˚N ∆ NOx [%] 2 4 6 100 200 300 400 500 600 700 800 900 1000 -90 -60 -30 0 30 60 90 90˚S 60˚S 30˚S Ä 30˚N 60˚N 90˚N ∆ NOx [%] 0 2 4 6 8 12 24 32 40 48 56 Prozent
Primäre Spezies und Ozon
Beitrag des Strassenverkehrs zu den zonal gemittelten Verteilungen (Jan+Jul)
32 32 100 200 300 400 500 600 700 800 900 1000 pressure [hPa] -90 -60 -30 0 30 60 90 90˚S 60˚S 30˚S Ä 30˚N 60˚N 90˚N ∆ Alkane [%] 24 48 100 200 300 400 500 600 700 800 900 1000 -90 -60 -30 0 30 60 90 90˚S 60˚S 30˚S Ä 30˚N 60˚N 90˚N ∆ Alkane [%] 2 4 100 200 300 400 500 600 700 800 900 1000 pressure [hPa] -90 -60 -30 0 30 60 90 90˚S 60˚S 30˚S Ä 30˚N 60˚N 90˚N ∆ O3 [%] 2 46 100 200 300 400 500 600 700 800 900 1000 -90 -60 -30 0 30 60 90 90˚S 60˚S 30˚S Ä 30˚N 60˚N 90˚N ∆ O3 [%] 0 2 4 6 8 12 24 32 40 48 56 Prozent
Primäre Spezies und Ozon
Beitrag des Strassenverkehrs zu den zonal gemittelten Verteilungen (Januar)
Fig. 4. Relative contribution of road traffic emissions to atmospheric CO, NOx, NMHCs and O3 zonally averaged distributions (in %). Isolines are 2, 4, 6, 8, 12, 24, 32, 48, 56%.
ACPD
5, 10339–10367, 2005
Impact of road traffic on tropospheric ozone S. Matthes et al. Title Page Abstract Introduction Conclusions References Tables Figures J I J I Back Close
Full Screen / Esc
Print Version Interactive Discussion EGU 180˚ 120˚W 60˚W 0˚ 60˚E 120˚E 180˚ 90˚S 60˚S 30˚S 0˚ 30˚N 60˚N 90˚N ∆ O3 [%] by RT 180˚ 120˚W 60˚W 0˚ 60˚E 120˚E 180˚ 90˚S 60˚S 30˚S 0˚ 30˚N 60˚N 90˚N ∆ O3 [%] by RT 180˚ 120˚W 60˚W 0˚ 60˚E 120˚E 180˚ 90˚S 60˚S 30˚S 0˚ 30˚N 60˚N 90˚N ∆ O3 [%] by NOx - RT 180˚ 120˚W 60˚W 0˚ 60˚E 120˚E 180˚ 90˚S 60˚S 30˚S 0˚ 30˚N 60˚N 90˚N ∆ O3 [%] by NMHCs - RT 180˚ 120˚W 60˚W 0˚ 60˚E 120˚E 180˚ 90˚S 60˚S 30˚S 0˚ 30˚N 60˚N 90˚N ∆ O3 [%] by NOx - RT 180˚ 120˚W 60˚W 0˚ 60˚E 120˚E 180˚ 90˚S 60˚S 30˚S 0˚ 30˚N 60˚N 90˚N ∆ O3 [%] by NMHCs - RT 0 3 6 9 12 15 [%] JAN JUL
Fig. 5. Relative contributions [%] of total and individual road traffic emissions to the surface
ozone distribution in January (upper row) and July (lower row); total emissions (left), NOx only (middle) and NMHC only (right).
ACPD
5, 10339–10367, 2005
Impact of road traffic on tropospheric ozone S. Matthes et al. Title Page Abstract Introduction Conclusions References Tables Figures J I J I Back Close
Full Screen / Esc
Print Version Interactive Discussion EGU 0.51 2 3 100 200 300 400 500 600 700 800 900 1000 -90 -60 -30 0 30 60 90 January-RT-NOx 0.51 2 3 4 100 200 300 400 500 600 700 800 900 1000 -90 -60 -30 0 30 60 90 July-RT-NOx 0.5 100 200 300 400 500 600 700 800 900 1000 -90 -60 -30 0 30 60 90 January-RT-NMHC 0.5 100 200 300 400 500 600 700 800 900 1000 -90 -60 -30 0 30 60 90 July-RT-NMHC 0.5 0.5 100 200 300 400 500 600 700 800 900 1000 -90 -60 -30 0 30 60 90 January-RT-CO 0.5 100 200 300 400 500 600 700 800 900 1000 -90 -60 -30 0 30 60 90 July-RT-CO 0 2 4 6 8 10 percent
Fig. 6. Contributions [%] of individual road traffic emissions – NOx (upper), NMHCs (middle) and CO (lower) to atmospheric distribution of ozone. Isolines are equidistant with 1% difference, plus one additional line for 0.5%.
ACPD
5, 10339–10367, 2005
Impact of road traffic on tropospheric ozone S. Matthes et al. Title Page Abstract Introduction Conclusions References Tables Figures J I J I Back Close
Full Screen / Esc
Print Version Interactive Discussion EGU 0 10 20 30 40 50 60 70 80 90
Jan Feb Mar Apr May Jun Jul Aug Sep Oct Nov Dec
dPAN [ppt] NHE PN NHE-NMHC PN-NMHC NHE-NOx PN-NOx
Fig. 7. Individual contributions of road traffic emissions to PAN in two regions: (1) mid-latitudes
near the surface (NHE; 30◦N–60◦N, below 750 hPa) and (2) arctic regions (PN; 68◦N–90◦N, below 550 hPa); total (solid), NMHCs (dotted), NOx(dashed).
ACPD
5, 10339–10367, 2005
Impact of road traffic on tropospheric ozone S. Matthes et al. Title Page Abstract Introduction Conclusions References Tables Figures J I J I Back Close
Full Screen / Esc
Print Version Interactive Discussion
EGU
8
S. Matthes et al.: Impact of road traffic on tropospheric ozone
Fig. 8. Scheme illustrating the impact of individual components of
road traffic emissions on atmospheric composition: NO
x(red), CO
(blue), NMHCs (green). An arrow up indicates increase, down a
decrease; the arrows on the left of the specie describe the change in
winter, those on the right the change in summer. Weak processes
are in parenthesis, major processes are highlighted with a coloured
background.
aged concentration changes of PAN due to road traffic
emis-sions are shown in Fig. 7 in both northern hemispheric
mid-latitudes and arctic regions. A strong PAN enhancement is
indicated due to all road traffic emissions (solid lines), a
slightly weaker due to NMHC emissions only (dashed lines)
and clearly weaker due to NO
x
emissions only (dotted lines).
In spring, in arctic (PN) and mid-latitudes (NHE), total road
traffic emissions are responsible for a PAN enhancement of
75 ppt (solid line, regional average north of 68
◦
below 550
hPa), whereas NMHC emissions alone cause in arctic
lati-tudes an increase of about 65 ppt (dotted line). On the other
hand, NO
x
emissions alone cause a PAN increase of only
about 20 ppt (dashed line). Hence, NMHC emissions are
responsible for about 90% of PAN enhancement in winter
and springtime in arctic latitudes (PN). Due to higher
atmo-spheric temperatures in spring and summer, the absolute size
of this effects decreases from April on. In summer
abso-lute values only amount to about 20 ppt contribution due
to gaseous road traffic emissions (NO
x
, NMHCs and CO).
Nevertheless NMHCs still represent the major contributor
with about 50 %. Hence Figure 7 illustrates that road
traf-fic NMHC-emissions are crucial for the formation and
long-range transport of PAN which then causes ozone contribution
of road traffic in remote regions.
The synthesis of the role for the impact of all three
indi-vidual emission components is illustrated in Figure 8 for the
three different regions: source regions (e.g. Europe),
trans-port regions (free troposphere) and remote regions (e.g.
At-lantic ocean, Arctic). The scheme includes the impact on
the Hydroxylradical. In source regions, NO
x
emissions from
road traffic (red colored) are mainly important for ozone
pro-duction depending on season. This causes a decrease in
win-ter (January) and an increase in summer (July) of the
con-centrations of the atmospheric hydroxyl radical. In strongly
confined regions (high-NO
x
) increasing HO
x
can strongly
reduce ozone productivity and overcompensate the NO
x
in-crease due to road traffic emissions, causing a dein-crease of
ozone. n source regions, generally NMHC emissions
con-vert additional OH into HO
2
during their oxidation (R5).
Radicals formed during the oxidation process produce more
HO
x
than they consume within their initial reaction. The
en-hanced HO
x
increases ozone productivity of nitrogen oxides.
In winter HO
x
increases so strongly in source regions of the
northern hemisphere that - in spite of a relative decrease of
HO
x
- OH increases. The increased OH concentrations form
an enhanced sink for NO
x
and more HNO
3
is produced. In
transport regions PAN concentrations are enhanced and NO
x
are reduced due to NMHC emissions from road traffic. On
the other hand, HNO
3
concentrations are reduced due to wet
deposition in transported air masses. During subsidence of
air masses PAN decomposes thermally and the PAN
concen-tration decreases. In remote regions the above mentioned
im-pact of NMHCs makes these species responsible for a major
ozone increase.
Figure 5 showed that ozone destruction due to road
traf-fic NO
x
emissions occurs in the industrialized areas in
Cen-tral Europe and North America. Since NMHC road traffic
emissions cause long-range transport of NO
x
(see above) the
geographic origin of emissions is of primary interest.
There-fore, we performed studies of regional road traffic emissions
(NO
x
, NMHCs, CO): USA only or Europe only (No rtusa
and No rteur in Tab. 2), which will now be discussed.
4.4
Impact of regional emissions from the USA and Europe
The results of the USA and Europe related impact
simula-tions are shown in Figure 9. The meriodionally averaged,
relative contributions to atmospheric ozone (Figure 9, upper
row) indicate that long-range transport occurs eastward. In
the free troposphere (above 900 hPa) over the USA in
midlat-itudes, global road traffic contributes by about 6%, whereas
emissions from the USA itself contribute more than 3%. In
the free troposphere over the Atlantic, 2% to 4% of the ozone
concentration has its origin in road traffic emissions in USA
and about 1% originates from Europe, out of a road traffic
contribution from global road traffic emissions of 4% to 5%.
In the free troposphere over Europe in midlatitudes,
emis-sions from the USA still contribute by more than 2%, where
the impact of global road traffic emissions amounts to 6%
(700hPa-300hPa; 30
◦
E). and road traffic emissions from
Eu-rope contribute by up to 2%. Further east (30
◦
E-130
◦
E) in
the free troposphere relative contributions from Europe and
the USA have about the same size of 1% here; global
emis-sions contribute more (about 5%). Over Asia, where global
road traffic emissions contribute about 4% to mid-latitude
ozone abundance a contribution of about 1% due to road
traf-fic emissions in the USA can be found (Fig. 9,middle row)
whereas on the other hand, emissions from Europe contribute
there about 0.5 %. Results shows that Europe and USA road
Fig. 8. Scheme illustrating the impact of individual components of road traffic emissions on
atmospheric composition: NOx (red), CO (blue), NMHCs (green). An arrow up indicates in-crease, down a decrease; the arrows on the left of the specie describe the change in winter, those on the right the change in summer. Weak processes are in parenthesis, major processes are highlighted with a coloured background.
ACPD
5, 10339–10367, 2005
Impact of road traffic on tropospheric ozone S. Matthes et al. Title Page Abstract Introduction Conclusions References Tables Figures J I J I Back Close
Full Screen / Esc
Print Version Interactive Discussion
EGU
S. Matthes et al.: Impact of road traffic on tropospheric ozone
9
Mid-latitudes
Northern tropics
of northern hemisphere
0.512 4 3 4 5 100 200 300 400 500 600 700 800 900 1000 -180 -120 -60 0 60 120 180 global RT-emissions 0.51 2 44 3 5 100 200 300 400 500 600 700 800 900 1000 -180 -120 -60 0 60 120 180 global RT-emissions 0.5 1 2 3 100 200 300 400 500 600 700 800 900 1000 -180 -120 -60 0 60 120 180RT-emissions from the USA
0.5 1 100 200 300 400 500 600 700 800 900 1000 -180 -120 -60 0 60 120 180
RT-emissions from the USA
0.5 1 100 200 300 400 500 600 700 800 900 1000 -180 -120 -60 0 60 120 180
RT-emissions from Europe
100 200 300 400 500 600 700 800 900 1000 -180 -120 -60 0 60 120 180
RT-emissions from Europe
0 2 4 6 8 10 12 14 16 18 20 ppb
0 2 4 6 8 10 12 14 16 18 20 ppb
Fig. 9. Contributions [%] of road traffic (RT) emissions to
merid-ionally averaged ozone: global emissions (upper), emissions from
the USA (middle) and emissions from Europe (lower) in July.
Mid-latitudes denote meridionally averaging over 30
◦N-60
◦N and
north-ern tropics over Equator-30
◦N; isolines distance 1 %, plus one
ad-ditional at .5 %.
traffic emissions can represent up to 50% of the global road
traffic contribution to the ozone distribution in mid-latitudes
in the free troposphere. Surface ozone concentrations are
only significantly affected by long-range transport in remote
areas.
In northern tropics (Figure 9, right panels), global
road traffic emissions contribute more than 4% above the
USA/Central America to atmospheric ozone. Road traffic
in the USA represents with around 1% only about a quarter
of these total ozone contributions (up to 200 hPa in
tropi-cal latitudes). European emissions from road traffic show a
maximum relative contribution of 0.5% around 30
◦E
(Ara-bian Peninsular), clearly illustrating the minor importance of
European road traffic emissions for the tropics. The
sensi-tivity studies show the strong zonal transport of road traffic
impact on ozone, and the much weaker meridional transport.
5
Summary and conclusions
Our results indicate that in July road traffic emissions (NO
x,
CO, and NMHCs) contribute to the zonally averaged
tro-pospheric ozone concentration by more than 12% in
north-ern hemisphere midlatitudes and arctic latitudes. In January,
road traffic contributes near the surface both in northern and
southern extratropics more than 8%. Relative contributions
near the surface to northern hemispheric midlatitudes ozone
amount to more than 12% in remote regions. The
simula-tions with ECHAM4/CBM show that the exclusive
consider-ation of NO
xfor assessing the impact of road traffic
emis-sions neglects an important impact due to NMHC emisemis-sions.
This holds in particular for the consequences of long range
transport of emissions for atmospheric ozone in remote
re-gions which is underestimated by about 30 % when only
considering NO
xand CO emissions. For assessing the
cli-mate impact of road traffic emissions NMHCs have to be
considered. Regional studies have emphasised the regional
and long-range contributions to ozone enhancement in the
free troposphere, showing that global emission distributions
have to be well known even for regional ozone studies in the
free troposphere. Future increase in southern hemispheric
re-gions, e.g. due to economic development in these regions will
lead to comparative high ozone contributions to atmospheric
ozone.
Acknowledgements. BMW AG funded part of the work of Sigrun
Matthes.
References
Atkinson, R.: Gas-phase tropospheric chemistry of organic
com-pounds: a review, Atmos. Env., 24A, 1–41, 1990.
Benkovitz, C., Scholtz, M., and Pacyna, J.: Global gridded
inven-tories of anthropogenic emissions of sulfur and nitrogen, J.
Geo-phys. Res., 101, 29,239–29,253, 1996.
Crutzen, P., Lawrence, M., and P¨oschl, U.: On the background
photochemistry of tropospheric ozone, Tellus, 51A-B, 123–146,
1999.
Gery, M., Whitten, G., Killus, J., and Dodge, M.: A
photochemi-cal kinetics mechanism for urban and regional sphotochemi-cale modelling,
Geophys. Res. Lett., 94, 12,925–12,956, 1989.
Granier, C. and Brasseur, G.:
The impact of road traffic on
global tropospheric ozone, Geophys. Res. Lett., 30, 1086,
doi:10.1029/2002GL015 972, 2003.
Hao, W. and Liu, M.: Spatial and temporal distribution of tropical
biomass burning, Glob. Biogeochem. Cycles, 8, 495–503, 1994.
Houweling, S., Dentener, F., and Lelieveld, J.: The impact of
nonmethane hydrocarbon compounds on the tropospheric
pho-tochemistry, J. Geophys. Res., 103, 10,673–10,696, 1998.
Lauer, A., Dameris, M., Richter, A., and Burrows, J.:
Tropopsh-eric NO
2columns: a comparison between model and retrieved
data from GOME measurements, Atmos. Chem. Phys., 2, 67–
78, 2002.
Liu, S., McFarland, M., Kley, D., Mahlman, J., and Levy II, H.: On
the origin of tropospheric ozone, J. Geophys. Res., 85, 15,879–
15,888, 1980.
Liu, S., M. Trainer, M., Fehsenfeld, F., Parrish, D., Williams, E.,
Fa-hey, D., H¨ubler, G., and Murphy, P.: Ozone production in the
ru-ral troposphere and the implication for regional and global ozone
distribution, J. Geophys. Res., 92, 4191–4207, 1987.
Matthes, S.: Globale Auswirkung des Straßenverkehrs auf die
chemische Zusammensetzung der Atmosph¨are, Ph.D. thesis,
Ludwig-Maximilians Universit¨at M¨unchen, 2003.
Matthes, S. and Sausen, R.: Absch¨atzung der Emissionen in den
EU-15 Staaten im Zeitraum 1980 bis 2015, Tech. rep., German
Space Center (DLR), Oberpfaffenhofen, Germany, 2000.
www.atmos-chem-phys.org/acp/0000/0001/
Atmos. Chem. Phys., 0000, 0001–10, 2005
Fig. 9. Contributions [%] of road traffic (RT) emissions to meridionally averaged ozone: global
emissions (upper), emissions from the USA (middle) and emissions from Europe (lower) in July. Mid-latitudes denote meridionally averaging over 30◦N–60◦N and northern tropics over Equator–30◦N; isolines distance 1%, plus one additional at .5%.

![Fig. 1. NO x emission [10 −11 gcm −2 s −1 ] from road tra ffi c in 1990.](https://thumb-eu.123doks.com/thumbv2/123doknet/14708510.566935/22.918.710.897.120.638/fig-no-emission-gcm-from-road-tra-ffi.webp)
![Fig. 2. Tropospheric NO 2 columns [10 14 mol. cm −2 ] derived from GOME satellite data (right) (Richter and Burrows, 2002) and ECHAM4/CBM model simulations (left) for January (top) and July (bottom).](https://thumb-eu.123doks.com/thumbv2/123doknet/14708510.566935/23.918.50.663.80.513/tropospheric-columns-derived-satellite-richter-burrows-simulations-january.webp)

![Fig. 5. Relative contributions [%] of total and individual road tra ffi c emissions to the surface ozone distribution in January (upper row) and July (lower row); total emissions (left), NO x only (middle) and NMHC only (right).](https://thumb-eu.123doks.com/thumbv2/123doknet/14708510.566935/26.918.41.676.144.458/relative-contributions-individual-emissions-surface-distribution-january-emissions.webp)
![Fig. 6. Contributions [%] of individual road traffic emissions – NO x (upper), NMHCs (middle) and CO (lower) to atmospheric distribution of ozone](https://thumb-eu.123doks.com/thumbv2/123doknet/14708510.566935/27.918.93.618.48.553/contributions-individual-traffic-emissions-nmhcs-middle-atmospheric-distribution.webp)

![Fig. 9. Contributions [%] of road traffic (RT) emissions to merid- ppb](https://thumb-eu.123doks.com/thumbv2/123doknet/14708510.566935/30.918.102.607.108.543/fig-contributions-road-traffic-rt-emissions-merid-ppb.webp)
