The Design of A Compact Integral Medium Size PWR:
The CIRIS
by Koroush Shirvan
Submitted to the Department of Nuclear Science and Engineering in Partial Fulfillment of the Requirements for the Degree of
Master of Science in Nuclear Science and Engineering at the
Massachusetts Institute of Technology June 2010
© Massachusetts Institute of Technology, 2010. All rights reserved.
Signature of Author:
MASSACHUSETTS INSTITUTE jOF TEC[:' OLO3Y
DEC 0 9 2010
LIBRARIES
ARCHIVES
Department of Nuclear Science and Engineering . / April 6, 2010
Certified By:
(Mujidd . Kazimi, Ph.D. TEPCO Profes r of clear Engineering Thesis Supervisor Certified By: Pavel Hejzlar, Sc.D. Ahesis Reader Accepted By: JacquelynC. Yanch, Ph.D. Chair, Coiniiittee on Graduate Students
The Design of A Compact Integral Medium Size PWR: The CIRIS
By
Koroush Shirvan
Submitted to the Department of Nuclear Science and Engineering on January 15, 2010, in partial fulfillment of the requirements for the Degrees of Master of Science in
Nuclear Science and Engineering
Abstract
The International Reactor Innovative and Secure (IRIS) is an advanced medium size, modular integral light water reactor design, rated currently at 1000 MWt. IRIS design has been under development by over 20 organizations from nine countries, led by Westinghouse. IRIS has a standard Westinghouse PWR core, but is an integral reactor, which means the reactor vessel contains all pumps, steam generators, pressurizer and control rod drive mechanisms. This work assesses possible improvements of the plant economics by the allowable power in the IRIS vessel, while maintaining the same or better safety limits, through increasing the power density in the core and heat exchangers.
IRIS was designed with 8 Once-Through Helically coiled Steam Generators (OTHSG), located in an annulus near the vessel in the region above the core. The unit size dictates the vessel diameter, or limits the core size for fixed vessel diameter, and thus the reactor power rating. The Printed Circuit Heat Exchangers (PCHE) of HEATRICIm are compact heat exchangers that can provide high power density along with low pressure drop. They are proposed here as replacement for the OTHSG. The PCHEs experience is mostly for single phase heat transfer. A model is developed for the two phase fluid heat transfer in the small horizontal PCHE flow channels. The PCHE performance under IRIS conditions was modeled by a one dimensional nodal code. For the same power output, the PCHEs are found to safely reduce the IRIS vessel diameter by as much as 1.5 m and reduce the pressure drop in the SG by 30 %.
The Internally and eXternally cooled Annular Fuel (IXAF) had been investigated as part of MIT's Advanced Fuel Project. It was found to maintain the current operating MDNBR margin under steady state IRIS conditions at 150% of nominal power density when the flow rate can be proportionally increased. The MDNBR in the inner channels was sensitive to flow changing flow conditions. A complete RELAP5 model of the IRIS reactor, along with PCHE and IXAF design representation, was developed. The PCHE RELAP model was first benchmarked against the stand-alone code and their agreement was demonstrated successfully. The short and long term responses of IRIS with PCHE and IXAF were analyzed for a Loss Of Flow Accident (LOFA) and a Loss Of FeedWater Accident (LOFWA). Under LOFA the MDNBR margins were found to be acceptable with added inertia to current IRIS pumps configuration.
Therefore, the pressure vessel size can be reduced by implementing the PCHE instead of the OTHSG, and IXAF instead of solid fuel rods in addition to increasing the power rating of the reactor by 50% for the same vessel size. The results indicate that a large potential exist to reduce the cost per kilowatt and increase the attractiveness of the IRIS reactor design.
Thesis Supervisor: Mujid S. Kazimi
Title: TEPCO Professor of Nuclear Engineering and Professor of Mechanical Engineering
Acknowledgements
I would like to thank Prof. Mujid Kazimi for providing me with the opportunity to work with him, Dr. Pavel Hejzlar for his continuous support and help throughout my thesis, the MASDAR Institute and Prof. Shatilla for providing the funding for the project and Bo Feng for providing me with many files on previous work on Annular Fuel.
Also, I want to thank all my family for all their support and encouragement and especially my uncle, Prof. Samim Anghaie for providing me the passion for nuclear energy as well as life to succeed.
Table of Contents
Abstract ...---...
2
Acknowledgements...
...
3
Table of Contents ...-.
-- -- -- 4
List of Figures...
...
...
6
List of Tables
...
...
9
1. Introduction
...
..---
11
1.1 Motivation ... .. ...-...- 111.2 IRIS Reactor Design...15
1.3 PC H E ...--- .... . . ---... . ---... 17
1.4 A nnular F uel ... . --- . . -... 18
1.5 Com putational Tools and Sum m ary... .... .. ... 20
2. OTHSG Analysis
...---
23
2.1. Helical System Generator Model... 23
2.2 B enchm arking O TH SG ... ... 29 2.3 Conclusion... . - -- -...-. 32
3. PCHE Analysis ...
... 34
3.1. Previous w ork on PCH E ... 34 3.2 V alidation of PCH E m odel...---... . ---... 38 3.3 Stability analysis of PC H E ...---...--- 4 1 3.4 Comparison of PCHE to OTHSG ... 514. IRIS Plant M odel...
.
.... 56
4.1. Previous Work ... .-.... 56
4.2 Model of IRIS SGs... ... ...---.- - ---.. 56
4.2.1 M odel of IR IS O TH SG ... . . ...----..--... 56
4.2.3. M odel of IR IS PCH E... ... ...---... 61
4. 3 M odel of IR IS C ore ... . -... - -- -- -- --... 65
4. 3.1 Model of IRIS Solid Fuel Core ... 65
4. 3.2 3 Model of IRIS Annular Fuel Core... 69
4. 4 M odel of IR IS Pressurizer... 72
4. 5 M odel of IR IS Pum p...--. . ---... 74
4. 6 M odel of IRIS Pipes/secondary side ... ... 76
4. 7 Model of IRIS Safety Systems ... 77
4. 7.1 Model of IRIS EHRS ...-...- 77
4. 7.2 Model of IRIS ADS ... 79
4. 8 IRIS Plant Calculated Results... 80
4. 8.1 IRIS Plant Model Preliminary Steady State ... 80
4. 8.2 IRIS Plant Transient A nalysis... 84
4. 8.3 IRIS Plant LOFA Transient Analysis... 84
4. 8.4 IRIS Plant LOFWA Transient Analysis... 93
4. 8.5 IRIS Plant with Annular Fuel Model ... 98
4. 8.6 IRIS Response to SBLOCAs... . 104
5.
IRIS DNBR Analysis...
106
5. 1 P revious W ork ... 106
5. 2 IRIS Reference Reactor DNBR Model... 107
5. 3 IRIS IXAF Reactor DNBR Model...--. 111
5.4 IR IS R eactor D N B R R esults... 117
6. CIRIS Optimization...
124
6. 1 General Model Description.124 6. 2 Pum p O ptim ization ... 125
6. 3 Shielding Optimization.129 ... 1329
6. 4 Economic Optimization13
7.
Conclusions and Future W ork...
137
7 . 1 C o n clu sio n ... 13 7 7. 2 R ecom m ended Future W ork ... 141
Appendices ...
142
A ppendix A : A N L B enchm arking ... 142
Appendix B: RELAP PCHE Benchmarking ... 145
A ppendix C : RELA P Transient A nalysis... 155
A ppendix D : PC H E A nalysis ... 16 1 A ppendix : V IPR E A nalysis ... 174
A ppendix F: Econom ics A nalysis... 191
List of Figures
Figure 1-1 IRIS reactor pressure vessel layout (from Cinotti et al., 2002)
Figure 1-2 A crossection of PCHE from the side and the top view (from Heatric, 2008) Figure 1-3 Solid and internally and externally cooled annular fuel (from Kazimi et al., 2006) Figure 1-4 Comparison between the 13x13 annular fuel assembly (right) and the reference
17X17 solid fuel assembly (left) (from Kazimi et al., 2006) Figure 2-1 OTHSG view from above
Figure 2-2 Helical Coil Tube
Figure 2-3 The SG (a) temperature profile and (b) heat flux (qpp) profile as predicted by the MIT and Italy models
Figure 3-1 Heat exchanger nodalization (from Dostal, 2004)
Figure 3-2 A crosssection of two layers of the PCHE showing the semicircular coolant paths (from Heatric, 2008)
Figure 3-3 Effect of different correlations on (a) total length and (b) pressure drop of the PCHE Figure 3-4 A comparison of different methods to calculate the straight channel single phase friction factor
Figure 3-5 Minimum Mass Flux for Stratification vs. Quality
Figure 3-6 The void coefficient (a) that was used to calculate the khor (b) Figure 3-7 The PCHE CHF values assuming vertical flow
Figure 3-8 The PCHE CHF comparison of different correlation by using the same khor Figure 3-9 Comparison of CHF correlation for the PCHE
Figure 3-10 The PCHE comparison to typical PCHE values from HeatricT website (2008) Figure 3-11 The PCHE CHF for two hot plate for every one cold plate case
Figure 3-12 The comparison of (a) temperature profile and (b) heat flux profile of PCHE and OTHSG
Figure 3-13 Side view and cross sectional view of the PCHE in the IRIS layout
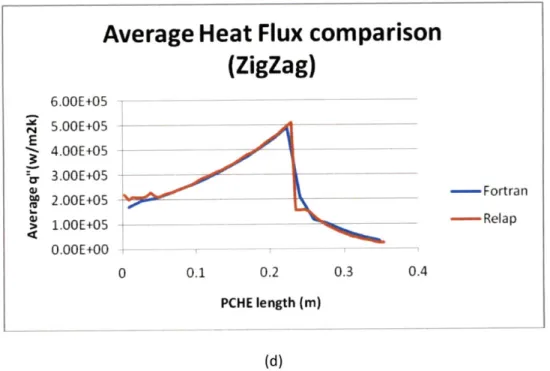
Figure 4-1 The MIT Fortran vs RELAP (a) temperature distribution and (b) heat flux for one OTHSG
Figure 4-2 The MIT Fortran vs RELAP temperature distribution (a) and heat flux (b) for one OTHSG
Figure 4-3 The MIT Fortran vs RELAP (a) temperature distribution for straight and (c) zigzag channels and (b) heat flux for straight and (d) zigzag for one PCHE
Figure 4-4 The rod Axial power fraction resembling chopped cosine Figure 4-5 The IRIS core layout
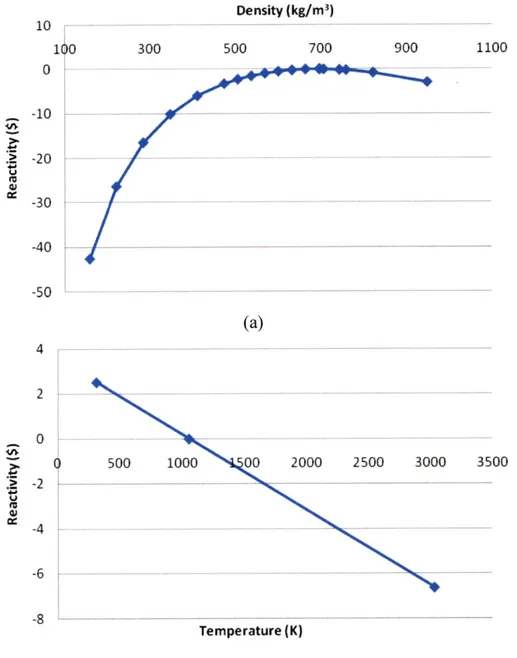
Figure 4-6 The reactivity feedback values used for (a) moderator density and (b) fuel temperature in the core
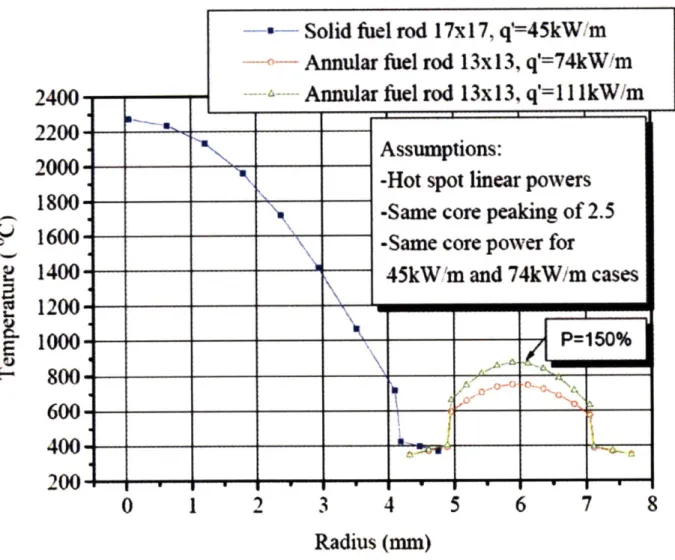
Figure 4-7 The comparison of peak fuel temperature at peak conditions for solid fuel and annular fuel (from Kazimi et al., 2006)
Figure 4-8 The view of pumps in the IRIS reactor from the top and side (from Kitch et al., 2004) Figure 4-9 IRIS simplified RELAP model
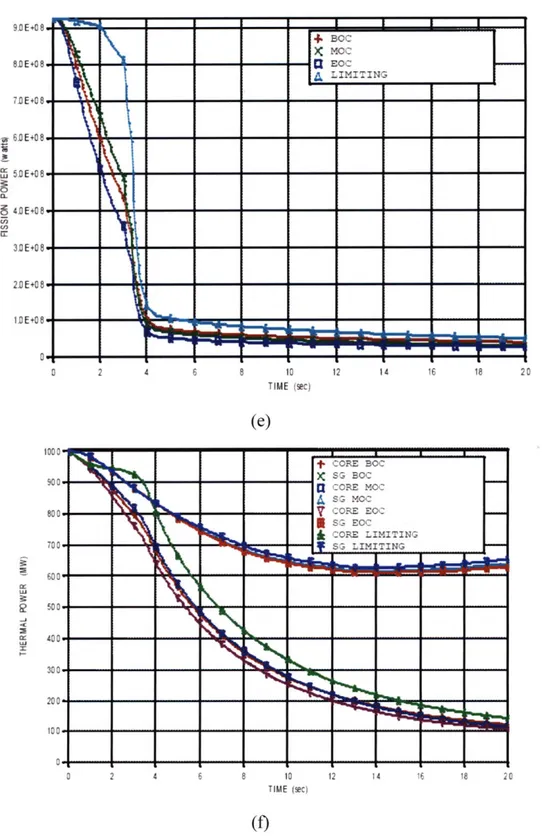
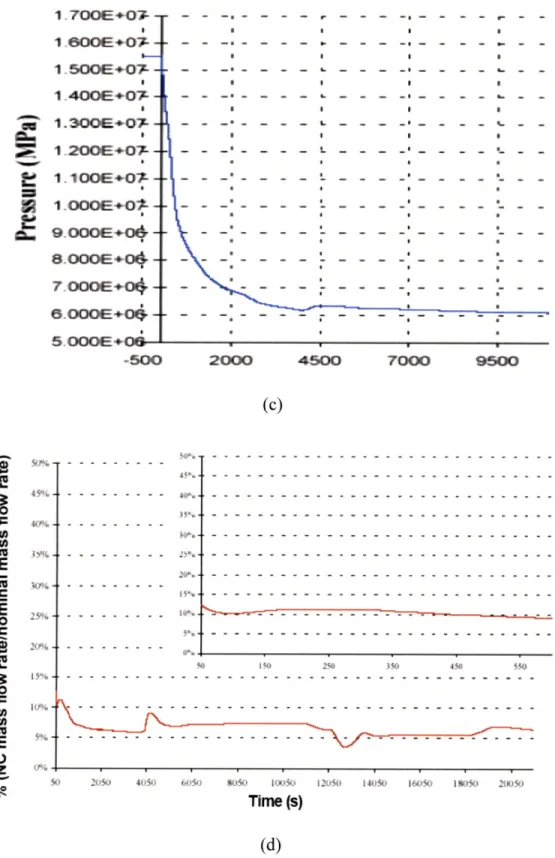
Figure 4-10 The MIT RELAP model calculated response following LOFA (a) the core pressure, (b) the Temperature, (c) the Fission power, (d) the Thermal power and the Westinghouse results for (e) the fission power and (f) the thermal power (from Bajs et al., 2002)
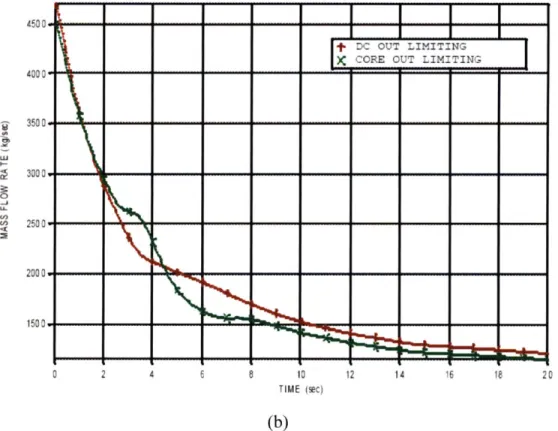
Figure 4-11 The MIT RELAP model during the LOFA of (a) the core mass flow rate and (b) the Westinghouse results (from Bajs et al., 2002)
Figure 4-12 The long term behavior prediction of MIT RELAP model following a LOFA of (a) the core pressure and (b) the mass flow rate and the Westinghouse results for (c) the core pressure and (d) the mass flow rate (from Ricotti et al., 2002)
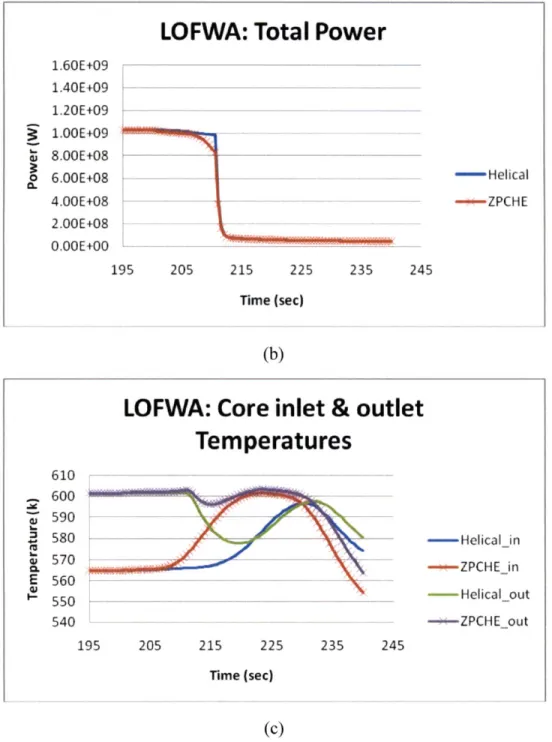
Figure 4-13 The short term behavior of MIT RELAP model during the LOFWA of (a) the core pressure, (b) the total power and inlet and (c) the outlet temperature
Figure 4-14 The long term behavior of MIT RELAP model during the LOFWA of (a) the core inlet and outlet temperatures and (b) the Westinghouse results (from Ricotti et al., 2002) Figure 4-15 The long term behavior of MIT RELAP model during the LOFWA of (a) the core pressure and (b) the Westinghouse results for core pressure (from Ricotti et al., 2002)
Figure 4-16 The behavior of main thermal hydraulic parameters for the IXAF fuel core with PCHE compared to the solid fuel core in the MIT RELAP model
Figure 4-17 The behavior of MIT RELAP model during the LOFWA of (a) the core pressure and (b) the core outlet temperature for the IXAF and solid fuel cases
Figure 4-18 IRIS response to SBLOCA (from Oriani et al., 2003)
Figure 5-1 The pin power distribution used for (a) the hot fuel assembly and (b) other lumped assemblies in VIPRE
Figure 5-2 Channel and rod numbering scheme in the 1/8 core model for the IRIS reactor Figure 5-3 Channel and rod numbering scheme in the 1/8 IXAF core model for the IRIS reactor Figure 5-4 The MDNBR vs. Time for the LOFWA at 100% power
Figure 5-5 A typical LOFA sequence for PWRs (from Dandong et al., 2007)
Figure 5-6 The MDNBR vs. Time for the LOFA with fast coastdown for the IRIS and slow coastdown for the CIRIS
Figure 6-1 The probable cross sectional area needed for the pumps if (a) 12 pumps is used or (b) (b) larger sized 8 pumps is used
Figure 6-2 The MCNP Model Geometry
Figure 6-3 Neutron and Photon dose from the core to the outside of the CIRIS reactor vessel (most uncertainties were less than 0.1 percent)
Figure 6-4 The levelized fuel cycle cost of the IRIS and the CIRIS reactor with 12 ft or 14 ft fuel rods
Figure 6-5 The levelized cost of the IRIS and the CIRIS reactor with 12 ft or 14 ft fuel rods Figure 6-6 The levelized cost of the IRIS and the CIRIS reactor for current PWR capital and O&M levelized costs
List of Tables
Table 1-1 Comparison of current Integral Pressurized LWR designs
Table 2-1 Sample OTHSG code input
Table 2-2 Comparison of Parameters for steam generators
Table 2-3 Comparison of OTHSG parameters for benchmarking MIT code
Table 3-1 The diameter correction factors at different mass flux, quality and pressure (from
Tanasea et al., 2008)
Table 3-2 The comparison of thermal hydraulic parameters of the PCHE with OTHSG
Table 4-1 The MIT Fortran vs initial RELAP results for one OTHSG
Table 4-2 The MIT Fortran vs RELAP results for one OTHSG
Table 4-3 The MIT Fortran vs RELAP results for one PCHE with straight or zigzag channels Table 4-4 The IRIS nominal fuel geometric specifications
Table 4-5 SCRAM reactivity values for IRIS RELAP model
Table 4-6 The IXAF fuel geometric specifications for 13 x 13 assembly Table 4-7 The spool type pump calculated specifications
Table 4-8 The Steady-State results for the simplified RELAP model
Table 4-9 The list of design basis accidents and IRIS's general response (from Carelli et al., 2003)
Table 4-10 The Accident sequence for a complete LOFA for the IRIS reactor Table 4-11 The Accident sequence for a LOFWA for the IRIS reactor
Table 4-12 The Steady-State RELAP results for the simplified IRIS with IXAF model Table 5-1 The overpower MDNBR and core pressure drop results for various cases Table 5-2 The steady state MDNBR values for the IRIS and CIRIS cores at 100% power
Table 6-1 The MCNP5 results for different vessel geometries (all uncertainties were less than 0.1 percent)
Table 6-2 Input parameters to the economic model
Table 7-1 The Final MIT RELAP CIRIS model compare to the IRIS nominal specifications Table 7-2 The zigzag PCHE vs. OTHSG specifications
Chapter 1 Introduction
1.1 Motivation
Over the remainder of this century, the need for viable clean sources of energy will be
getting more important, as billions of tones of carbon based fuel is being burned, contributing to
global warming through green house gas emission and depleting valuable resources for future
chemical industry. Nuclear power can be one of the options for emission-free large scale
electricity production in the US and other countries. However, in order for nuclear power to be
viable, it has to be competitive with other options. Currently in the US, the nuclear power
electricity production cost is very competitive with other means of production, such as coal and
natural gas power plants. The main reason for this is that the capital cost of the nuclear plants
has been already paid and the operating costs are dominated by the O&M and the fuel cycle
costs. According to many sources including MIT's "The Future of Nuclear Power" study
[Deutch et al., 2009], the capital cost of the nuclear power plants is large and somewhat
uncertain compared to coal and natural gas plants. The higher cost along with the uncertainty poses a risk for electric utilities in the US and across the world which has to be considered
against the uncertain cost of carbon emissions in the future.
The Small-to-Medium size Reactors (SMRs) have been a hot topic in the nuclear industry
in this decade. SMRs can be a more attractive option for developing nations with low electricity
demand and grid-size. They can also be used in non-electricity areas such as desalinization and
hydrogen production. What defines an SMR size can be debated; typically from 50-600 MWe
reactors are considered SMRs. The goals of SMR plants are to have simplified designs that
demonstrate safety and show their ability to be economically modularized. Currently, there are
many designs of SMRs being developed by many countries, as referenced in the IAEA 2005 SMRs report:
e Integral type pressurized water reactors targeted for near term deployment: SMART
(the Republic of Korea), IRIS (the International Consortium, led by Westinghouse, USA), CAREM (Argentina), mPower (B&W) and SCOR (AREVA-CEA, France);
- Small pressurized water reactors without on-site refueling from Russia: SAKHA-92, ABV-3, ABV-6, KLT-40S (with lifetime core), VBER, RIT (all from OKBM), RUTA-70, UNITHERM, NIKA-70 (from RDIPE), in particular, designed for floating NPPs;
* Direct conversion small light water reactor without on-site refueling ELENA (RRC "Kurchatov Institute", Russia);
e Light water cooled heavy water moderated pressure tube reactor AHWR (BARC,
India);
e Light water reactors using coated particle or pebble bed type fuel: PFPWR50
(University of Hokkaido, Japan), VKR-MT (VNIIAM-RRC "Kurchatov Institute", Russia), FBNR (Federal University of Rio Grande Do Sul, Brazil);
- Innovative high temperature gas cooled reactors: PBMR-400 (ESCOM, South Africa), HTR-PM (INET, China), HTR-F/VHTR (AREVA-CEA, France), GT-MHR (GA, USA);
e Lead-bismuth cooled small reactor without on-site refueling SVBR-75/100, targeted
for near-term deployment (IPPE and EDO "Gidropress", Russia);
e Innovative lead or lead-bismuth cooled small reactors without on-site refueling:
STAR-LM, STAR-H2, SSTAR ("STAR family", ANL, USA), SPINNOR and VSPINNOR (ITB, Indonesia);
e Lead-bismuth cooled compact high temperature reactor CHTR, with HTGR type fuel
(BARC, India);
- Molten salt cooled small reactor with pebble-bed fuel MARS (RRC "Kurchatov Institute", Russia);
e CANDLE burn-up concept for small high temperature gas cooled reactors and for
small reactors with fast neutron spectrum (RLNR TITech, Japan), Traveling Wave Reactor (Terra Power, US).
In order to find a design that can be used for near term deployment, one must eliminate
non-LWR technology as it is still far from realization. Under the non-LWR category, the first designs
considered will be the designs that employ solid cylindrical rods and U0 2 fuel as it is being used
across the world and carries the most experience base. This leaves the concepts listed under the
first two bullets above as the remaining choices. Since the Russian designs are of typical LWR
designs, the amount of improvement is most likely not significant, therefore the concepts under
the first bullet remain to be reviewed in more detail.
Table 1-1 Comparison of current Integral Pressurized LWR designs
General Information Units
Design Name IRIS CAREM SMART mPower SCOR
Thermal Power 1000 100 330 400 2000 MW
Electrical Power 335 27 100 125 600 MW
Vessel Height 21.3 -- 9.8 22 14.67 m
Vessel Outer Diameter 6.21 -- 3.96 3.6 5.265 m
Core Information I
Number of Assemblies 89 61 57 69 157
Assembly Type 17x17 Hex 117 17x17 17x17 17x17
Assembly Height 4.27 1.4 2 2 3.66 m
Fuel Type U02 U02 U02 U02 U02
Enrichment 4.95 3.4 Low <5 -- % U2 35
Moderator Water Water Water Water Water
Clad Zirc Zirc Zirc Zirc Zirc
Control Rod Material Ag-In-Cd Ag-In-Cd Ag-In-Cd -- Ag-In-Cd
Boron Yes No No -- No
Core Power Density 51.26 -- 62.6 -- 75.3 kW/cc
Linear Power 10 10.84 11 11 13.2 kW/m
Reactor Cooling System
Cooling Mode Forced Natural Forced Forced Forced
Mass Flow Rate 4700 410 1560 -- 10465 kg/sec
Operating Pressure 15.5 12.25 15 <14 8.8 MPa
Core Inlet Temperature 292 284 270 -- 246.4 C
Core Outlet Temperature 330 326 310 327 285.9 C
Steam Generator
Configuration Inside Inside Inside Inside Outside
Number of units 8 12 12 12-16 1
Type OTHSG OTHSG OTHSG OTHSG U-Tube
Rated Power 125 8.4 27.5 -- 2000 MW
Secondary Inlet Temperature 224 200 180 -- -- C Secondary Outlet Temperature 317 290 274 -- 237.4 C
Secondary Pressure 6 4.7 5.2 <7 3.2 MPa
PUMP
Configuration Inside NA Outside Inside Inside
Number 8 NA 4 12-16 16
As seen from Table 1-1, there are many options with integral pressurized water reactors.
The hexagonal arrangement of the CAREM reactor makes it less attractive design in terms of
licensing in the US. According to a Westinghouse study, the smallest rating of the module to
achieve attractive economy is in the neighborhood of 300MWe [Carelli et al., 2009]. Thus, the
IRIS is expected to be economically more attractive than the much lower rated SMART and
mPower reactors. The SCOR reactor has the steam generator located outside, therefore it is not
an integral reactor and the vessel is already very compact. Consequently, the IRIS reactor design
is chosen for this project as the most viable option to pursue for near term development. The
goal of this analysis is to increase the power density of the IRIS reactor to make it more
economically competitive with large traditional reactors such as AP1000 and ABWR as well as
the above listed SMR reactor designs.
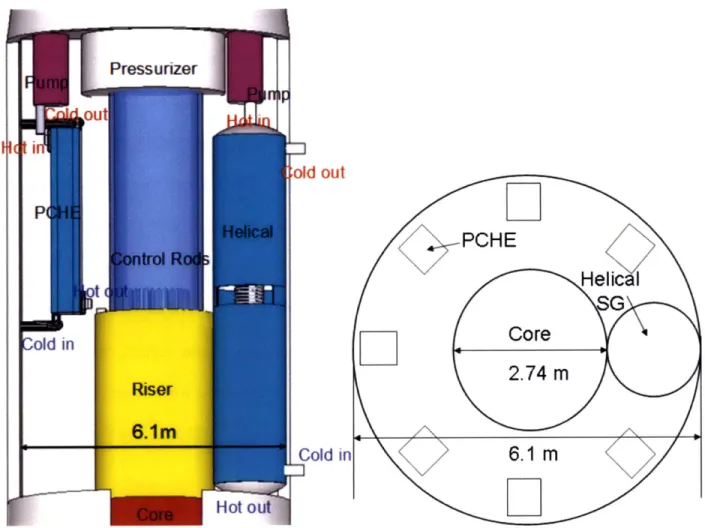
1.2 IRIS Reactor Design
The IRIS is a medium size, modular light water reactor, rated currently at 1000 MWt. IRIS design has been under development by over 20 organizations from nine countries, led by
Westinghouse. IRIS has a standard Westinghouse PWR core, which makes it one of the leading
design candidates for medium size reactors. It is an integral reactor, which means the reactor
vessel contains all pumps, steam generators, pressurizer and control rod drive mechanisms as
seen in Figure 1-1 [Cinotti et al., 2002]. The design is an expansion of 40 years of operating
PWR experience and already existing use of passive safety features established by Westinghouse
Figure 1-1 IRIS reactor pressure vessel layout (from Cinot'ti et al., 2002)
The IRIS was designed with 8 Once-Through Helically coiled Steam Generators
(OTHSG), located above the core. These OTHSGs are of the family of shell and tube heat exchangers composed of an annulus, where the high pressure fluid flows, and helically coiled
tube bundle, in which the lower pressure fluid flows. This geometry can handle thermal
expansion and vibration effects which sufficiently lower the probability of steam generator
rupture. However, since these steam generators are in the reactor vessel, their size dictates vessel diameter, or limits the core size for fixed vessel diameter, and thus reactor power rating [Cinotti
et al., 2002].
The integral design of IRIS reactor uses "safety by design" approach, which means
"design the plant in such a way that eliminates accidents from occurring, rather than coping with
their consequences". Furthermore, the design reduces the consequences and/or probability of
occurrance of the accidents which could not be eliminated. One of the significant safety features
of IRIS compared to a nominal PWR is that safety assessment can ignore the large Loss Of
Coolant Accidents (LOCAs), since no large primary coolant loop piping or penetrations exist
outside the vessel. The "safety by design" reduces the complexity of the IRIS passive safety
systems. Also, the passive safety systems allow for plant simplification, reliability and safety.
Such simplifications, along with the elimination of welds for the large pipings, are expected to
reduce the construction time.
1.3 PCHE
Public information on the HeatricTm Printed Circuit Heat Exchanger (PCHE) design and
performance has been increasing gradually over recent years, due to a rise of interest in the
compact design of the PCHEs. For example, University of New Mexico, Kansas state University
and MIT along with INL, ANL, KAERI, TITECH have published theses/papers on the subject of
using PCHE in nuclear application. The PCHEs are a type of compact heat exchangers that
provide high power density along with low pressure drop and maintenance requirements.
PCHEs are composed of rectangular plates, diffusion bonded together with semi circular
channels, as seen in Figure 1-2. The diffusion bonds in PCHE have proven to be able to
withstand pressures much higher than those in nuclear power reactors [Southall, 2009]. The
diffusion bonds have also been extensively tested and shown to possess the same strength as the
parent material. PCHE channels could be straight or zigzag (Figure 1-2), where the zigzag
also proven technology in the oil and gas industries and chemical reactors [Heatric, 2008].
However, no recorded experiment with boiling water through PCHE was found.
E
Cold
Hot
Figure 1-2 A crossection of PCHE
from
the side and the top view (from Heatric,2008)Out of all the mentioned list of institutes involved with PCHE only one, ANL, has
performed an experiment that has water as a secondary coolant. The rest involve gaseous CO2
-CO2 loops. One of the main goals of this work is to analyze the effectiveness of the PCHE performance for water to water heat transfer conditions, whereby the secondary water boils and
exits as superheated vapor.
1.4 Annular Fuel
The Internally and eXternally cooled Annular Fuel (IXAF) has been analyzed extensively as part
of MIT's Annular Fuel Project. The study has demonstrated that the power density in the core
can be up rated by 50% above typical Westinghouse PWR cores. The study has shown that the
thermal margins for IXAF are maintained or improved with the 50% up rate, if the flow is also
increased by partial blockage of the inner annular region of the fuel rods has also been shown
acceptable the MDNBR limits. In terms of neutronic margins, the IXAF has shown reasonable
performance compared to typical Westinghouse PWR fuel rods for conditions of a typical four
loop plant design [Zhiwen et al, 2007]. The economics of fabrication of annular fuel pellets has
also been evaluated by Westinghouse. It was found that only the inner zirconium cladding adds
a cost of 0.000002 $/kWhr(e) to 0.005 $/kWhr(e) [Lahoda et al., 2007].
Dcoo Coolant Dcoi Dio
Fuel
DgiCladding
DcsoFigure 1-3 Solid and internally and externally cooled annular fuel (from Kazimi et al., 2006)
The MIT study showed there is an incentive for using 13 x 13 annular fuel assembly
instead of other combinations in terms of neutronic, thermal hydraulic and economic
performance. The 13x13 assembly has 8 guide tubes compared to 24 for a traditional 17 x 17
Figure 1-4 Comparison between the 13x13 annular
fuel
assembly (right) and the reference 1 7X1 7 solidfuel
assembly (left) (from Kazimi et al., 2006)1.5 Computational Tools
The main focus of the analysis of IRIS in this work is on thermal hydraulic performance,
due to the fact that changing the steam generator has no effect on core neutronics, and the
neutronic performance of annular fuel has already been evaluated. The IRIS core is similar to a
nominal PWR, so it is assumed that for IRIS the reactivity feedback coefficients, such as moderator temperature and doppler coefficient, and shutdown margin reactivity values for
control rods are applicable.
Previously, for PCHE thermal hydraulic analysis, a one-dimensional nodal code that uses
various correlations was developed for MIT'S
experiments on CO2 - CO2 loop [Hejzlar et al, 2006
GFR, and benchmarked with TITECH
]. The same code is expanded to the use
liquids and gas and two phase flows of components available in REFPROP software. The code
.... ....... ... ... .. ... .... .... . .
Ak A& Ah 196 Alik Ah A6 A6 Ak A& X XX XXXX'& A& AL X X X X AXV X I XXX XX-kXXX XXXXXI X X gkNL X XX
+ +
+ +A + A + + + + + + + +A + + + 0 0 + + + + + + +A h*, + *A h+L + 0 + + + + + + + + +is used here to calculate the volume required by the PCHE for given thermal hydraulic
parameters.
For analysis of IRIS under steady state and transient conditions, with PCHE and/or
Annular fuel, the state-of-art code RELAP5-3D [RELAP5, 2001] coupled to VIPRE-01 [Stewart, 1989] is used. RELAP is used to find the general core parameters such as the operating pressure, inlet temperature, mass flow rate and power during a transient. Then VIPRE is used to calculate
Minimum Departure from Nucleate Boiling Ratio (MDNBR) during the transient. A RELAP
nominal model of IRIS has been developed, however, the input is proprietary. Therefore, a total
model of the IRIS reactor along with its main safety systems was developed first, then modified
in order to accurately assess the consequences of using PCHE and Annular Fuel for the reactor
design.
Since one of the goals of the project is to reduce the vessel diameter, the shielding of the
IRIS reactor at a reduced diameter needs to be analyzed. MCNP5 [MCNP5, 2003] was used to
assess the dose outside the reactor vessel, taking into account both neutrons and photons. An economic analysis of the fuel cycle cost of the new design was also performed with the aid of
CASMO-4 [Edenius et al., 1995] and TK-Solver programs[TK Solver, 2003].
In summary, Chapter 2 will look at the overall OTHSG model developed to be compared
to Chapter 3 content on the PCHE model. The Chapter 3, a PCHE model is described and a
more detailed analysis and comparison to the OTHSG as given, as there were no publications
found with regard to boiling in the PCHE. Chapter 4 will analyze the impact of using the PCHE
steam generators and the IXAF core on safety by modeling the IRIS reactor in RELAP.
Specifically, the consequences of these changes is shown under loss of flow and loss of feed
water accidents, in addition to showing the long term decay removal capabilities after each
accident. Chapter 5 focuses on detailed MDNBR calculation of the IRIS reactor under steady
state and transients and shows the MDNBR implication of using PCHE steam generators and
IXAF core. Also, it describes the increase of the power from 1000 MWth to 1500 MWth and its
MDNBR consequences. Chapter 6 uses the information from all the previous chapters and
shows how the new IRIS reactor (the CIRIS) with 50% more power can be successfully and
economically designed. Chapter 7 describes the main conclusions and provides
Chapter 2 OTHSG Analysis
2.1 Helical System Generator Model
The current OTHSG in the IRIS design has the primary fluid flowing downward in an
annular ring, while the secondary fluid flows upward in multiple helical tubes. OTHSG has been
modeled by one dimensional steady state FORTRAN/TK-Solver code. The code modeled an
average helically coiled tube and multiplied the appropriate results by the number of tubes.
To estimate the heat transfer coefficient for the primary fluid, the Dittus-Boelter
correlation was used:
Nu = 0.023 Re0 8 pr
0.4 and (2.1)
Nu = h D/k, (2.2)
where Nu is the Nusselt number, Re is the Reynolds number, Pr is the Prandtl number, D is the
tube diameter, k is the thermal conductivity of the fluid.
The hydraulic diameter for the primary side was calculated by estimating from geometric
considerations the average flow area seen by each tube. This was done first by estimating the
number of rows of helical tube around the annular region of the OTHSG as shown in Figure 2-1.
Then the total area occupied by the helical rows is subtracted from the area between the first
helical tube and the outside diameter of the SG and then divided by the number of rows to obtain
the primary coolant flow average area per helical tube. It is noted that such approximation is
only valid for OTHSG such as in IRIS where the tubes are more horizontal than vertical.
Therefore, the minimum and maximum diameters that encompass all helical rows are inputs to
Areafrom the first helical
\
tube to the outside diameter of th e SGFigure 2-1 OTHSG view
from
aboveGnielinski's correlation for fully developed turbulent flow in helical tubes, which
includes centrifugal effects of the flow in a helical geometry, was considered for the single phase
heat transfer coefficient of the secondary side [Gnielinski, 1986]. The Nakayama correlation [Bayless, 1979] for heat transfer also gave very close results compared to the Gnielinski
correlation. At the end, it was decided to go with the White correlation and Seban-McLaughlin
correlation [Zhao et al, 2003] for single phase pressure drop and heat transfer which also gave
close answers to the two correlations above. This correlation was experimentally verified for
diameters around the same size and length to width ratio as those of the steam generator of IRIS.
fc = 0.08 Re"4 + 0.012 (do/Di)", (2.3)
... ... ... . ... ...
Nu = 0.023 Reo* Pro 4 [Re (dJ/Di)2]0
.
0s (6000 < Re < 65,600),
where fc is the friction factor, do is the diameter of tube and D; is the diameter of the helix as
illustrated in Figure 2-2.
Figure 2-2 Helical Coil Tube
For the two phase region, the straight channel correlation of Chen was used due to
negligible effects of the centrifugal force in two-phase flow [Bayless, 1979].
correlation uses a combined boiling and flow heat transfer. For boiling:
al .2 .5 .41 .49 .79 0.00122ATa2 APa; cp; p, k~ .5 g24 VI.29 .24 The chen (2.5)
where a.b is the nucleate boiling heat transfer coefficient, A1T, is the difference in wall
temperature and saturation temperature, AP,, is the difference in pressure at the wall surface and
saturation, cp, is the liquid specific heat, p is the density, k, is the liquid thermal conductivity,
o is the surface tension, hg is the enthalpy of vaporization, and v, is the liquid viscosity. The Martinelli parameter is also used:
. ...
X = (P)-(V)- ( X). 2 7 , (2.6)
A1 V9 X
where x is the flow quality and v is the kinematic viscosity. The effective heat transfer
coefficient for two phase flow is given by:
h =F h + S an, (2.7)
where hi is the convection heat transfer calculated based on the flow of the liquid portion in the
tube, F and S are defined as:
1
F = 2.35[- +.213]-736 and (2.8)
X
S 1 1.17 (2.9)
1+ 2.53e -6 Re,
where Res is defined as:
Res = Re F125 (2.10)
Additionally, the subcooled region uses the Bergles and Rohsenow equation [Bergles .et
al., 1964] to calculate the required wall superheated to have subcooled nucleate boiling as a heat
transfer mechanism. Also, the Wong Critical Heat Flux (CHF) correlation [Wong et al., 1990]
for horizontal tubes was used to assess the quality at which CHF takes place. This is a
conservative assumption as the critical heat flux in helical tubes is greater than that of horizontal
tube. Therefore, once the CHF is reached the post-CHF, Groeneveld correlation [Todreas et al.,
For the primary pressure drop, the friction factor of McAdams was used:
f= 0.184 Re-2 , (2.11)
where f is the friction factor and Re is defined for the annulus region. The pressure drop
correlations chosen for the secondary side were validated by experimental results from SIET
thermo-hydraulics labs in Italy. For Headers and orifices, loss coefficient of 0.2 was used, which
is based on experimental results [Santini .et. al., 2008].
The OTHSG model assumes that there is no transfer of heat to the outside of the SG (e.g.
zero heat loss). It also assumes that all the helical tubes are identical with the same total mass
flow rate and helix diameter. The OTHSG code requires the inlet secondary mass flow rate to
one tube, the pressure and temperature for both the hot and cold sides in order to proceed into the
calculations. The code first guesses the total length of the OTHSG tube, and then it will divide
the length into 80 nodes. Starting with the node at the inlet of the primary side (or outlet of the
secondary side), the code calculates the heat transfer coefficient and pressure drop in each node
and estimates new length for the individual nodes. The lengths of the nodes are summed up and
used to calculate the total transferred power within the OTHSG. This value is compared to the
target power value, if it is not within 0.1%, then a new total length is estimated by scaling the
previous guess by the ratio of estimated power to desired power. The code also requires the
helix pitch and average helical diameter and SG overall desired height for the pressure drop
calculations. The input of the loss coefficients for headers is also allowed if it is necessary.
When calculating the parameters for the secondary side, due to the existence of two phase
guessed and is used as an input to the Chen correlation, which is used to calculate the heat flux.
The heat flux is used to recalculate the wall temperature, which is used again to calculate the heat
transfer coefficient, until a numerically stable solution has been reached.
Table 2-1 Sample OTHSG code input
Inputs
Description
125000 power (kW)
15500 pressure - hot fluid - hot end (kPa)
5810 pressure - cold fluid - cold end (kPa) 328.4 temperature - hot fluid - hot end (o C)
223.9 temperature - cold fluid - cold end (o C)
589 mass flow rate on hot side (kg/s) 62.5 mass flow rate on cold side (kg/s)
0.61 hot inner channel diameter (m)
1.62 hot outer channel diameter (m) 0.01324 cold inner channel diameter (m) 0.01746 cold outer channel diameter (m)
I helix diameter (m)
0.8 helix pitch (m)
0.3 min distance from the first helix to the inner annulus (m)
7.9 HX height (m)
655 number of tubes
0.1 hot header loss coefficient 0.2 cold header loss coefficient
16 thermal conductivity of the plate (W/m-K)
60 # of HX longitude cells
18.0026 wmh - molar mass
18.0026 wmc - molar mass
water.fld hot fluid id (0 co2 else helium)
Water.fld cold fluid water
0 if two phase exists 1 else 0
1 two phase side: 1 for hot else 2 for cold
2.2
Benchmarking OTHSG
The result of the OTHSG FORTRAN/TK-Solver code is compared to the results obtained from
FLUENT, modeled in Italy [Cioncolini et. al., 2003]. Table 2-2 shows the current IRIS operating conditions
and compares the results of the OTHSG code with the calculated parameters.
Table 2-2 Comparison of Parameters for steam generators
As seen from Table 2-2, all the results are very close and consistent with the results of
models and experiments from Italy on the prototype IRIS OTHSG. The overall profiles of the
temperature and the heat flux from the two models are plotted in Figure 2-3.
Parameters
Italy
MIT
Power
125
125
MWPrimary side:
Mass Flow rate
589
589
k g/sInlet Temperature
328.4
328.4
c
Oulet
Temperature
292
291.9 c
Inlet Pressure
15.5
15.5
MPaPressure drop
72
74
kPaSecondary side:
Mass Flow rate
62.5
62.5
kg/s
Inlet Temperature
223.9
224.2
c
Oulet
Temperature
317
317.5
c
Outlet Pressure
5.8
5.8
MPaPressure drop
296
307
kPa610 50-57 -+- s ThotMIT -W TcoldMIT iw550-Thot Ital S53Q-Todla S510- wl-I Twall Italy 490 0 5 10 15 20 25 30 35 Tube Positon (m) (a) 300 250-+- qppMI T 250 -a-qppItaly n. : 100-50 -0 0 2 4 6 8 10 12 14 16 18 20 22 24 26 28 30 32 34 Tube Position (m) (b)
Figure 2-3: The SG (a) temperature profile and (b) heat flux (qpp) profile as predicted by the
MIT and Italy models
As seen, the shape of the profiles in Figure 2-3 are very similar. However in case of the
heat flux and the average wall temperature, there is about 25 kW/m2 and 10 K difference
between the Italian result from FLUENT and the MIT FORTRAN model. These differences
don't affect the overall conditions significantly. Since the methodology used in the OTHSG
30
MIT code is very similar to the one used for the PCHE model, as described later, it was
important to validate the model against other experimental and numerical models.
The code was tested for other cases to show the validity of the assumptions that was
made for the hydraulic diameter of the OTHSG. There is only one other case shown with
different tube lengths, number and SG height displayed in Table 2-3. The Fortran/Tk-Solver
predicted the length to be 30.6 m compared to the reported value of 32 m. This is reassuring
since the average distance between the helical coils was not reported, and was just guessed by
scaling the nominal values by the number of tubes contained in the modified design. The only
other parameter that differed was the hot side pressure drop, which was 106 kPa compared to the
reported 136 kPa. This is also not troublesome, since there was no mention of what values of
loss coefficient and height were used for headers and the same values as the nominal design were
Table 2-3 Comparison of OTHSG parameters for benchmarking MIT code
Parameters
Italy
MIT
Power 125 125 MW
Primary side:
Mass Flow rate 589 589 kg/s
Inlet Temperature
328.4
328.4
c
Outlet Temperature
292
291.9
c
Inlet
Pressure 15.5 15.5 MPaPressure drop 136 144 kPa
Secondary side:
Mass Flow rate 62.5 62.5 kg/s
Inlet Temperature 212 213.1 C
Outlet Temperature 317 316.34 C
Outlet Pressure 5.8 5.8 MPa
Pressure drop 101 91.3 kPa
Tube Length
32
30.6
m2.3 Conclusion
The OTHSG of IRIS was accurately and successfully modeled with a 1-D thermal
hydraulic model using an iterative scheme and published correlations that are applicable to the IRIS specific geometry. The code was able to show acceptable numerical stability and
extrapolation for the purpose of this project. In general, helical steam generators have very helical tubes arrangement with a variety of wavelengths and helix diameters. It is noted that the
MIT developed code was tested for specific conditions and the CHF occurred at very high
qualities (greater than 95%). Therefore, the applicability of the Groeneveld correlation and the
performance of the code under other conditions in which CHF way occur earlier have not been
tested. However, for the purpose of steady state IRIS analyses, the above methods are sufficient. 32
Furthermore, fluids other than water can be used, such as sodium, for which the correlations will
Chapter 3 PCHE Analysis
3.1 Previous work on PCHE
PCHE is made up of diffusion bonded plates with chemically etched flow paths. The plates are bonded together in sequence of hot/cold plate. There is counter-current flow between the hot and
cold plates. For the purpose of modeling the PCHE, the following assumptions were made:
- The total mass flow rate is uniformly distributed among the channels.
- There is a boundary condition of zero heat flux periodically between each pair of hot/cold
plates
" The wall channel temperature is uniform at every axial node, along with zero axial conduction
- Cold and hot plates have the same number of flow channels
The nodalization scheme is shown in Figure 3-1.
Heat Heat
Exchanger Exchanger
Hot End +i-i Cold End
Hot side in
+
Hot side outCold side out Cold side in
Nodcj
[Nodej
Hot End Cold End
Therefore a single channel has been modeled for each hot and cold side and the heat transfer is
calculated between them and scaled to the total number of channels in the PCHE. Basically every
node will obey an energy balance equation:
r"hot (1
H,, - Hou )hot ~ n cold (Hi, - Hout )cold = P, Az ho, (T,,,, - Told) (3. 1)
Where rh is the mass flow rate, H is the enthalpy, Ph is the heated parameter, Az is the axial
length, T is the node-average temperature. The h,0t is total heat transfer coefficient, and is
derived by using heat flux balance:
h = 1 -+ + (3.2)
hh k2P hk
P)-where h is the heat transfer coefficient, P is pitch of the channels, cl conduction length which is
60% of the hot/cold channel distance calculated by the CFD code Fluent, k is the thermal conductivity of the plates.
The PCHE thermal parameters were calculated using a FORTRAN nodal code that estimates the necessary volume, given inlet conditions for both the primary (single phase) and
secondary sides (two phase). This code is an expanded version of one that originally included
single phase gas to gas calculations [Hejzlar et al, 2006]. Figure 3-2 shows a cut in the PCHE
layout that was considered. PCHE is composed of multiple plates of the same geometry packed
on top of each other, with 2mm diameter semicircular channels in a zigzag arrangement. The
effects of the geometry were accounted for in the heat transfer coefficient and pressure drop, by
Plate
Thickness.
Hot
1.6 mm
Cold
Figure 3-2 A crosssection oftwo layers of the PCHE showing the semicircular coolant paths
(from Heatric, 2008)
The primary and secondary liquid heat transfer coefficient was calculated by the
Gnielinski correlation for laminar flow, which has been experimentally validated for small
diameter and velocity conditions of PCHE [Hesselgreaves, 2001],
(Re-1000)Pr
Nu = 8 Re>5000, (3.3)
1+12.7(Pr -1) 8
where Nu is the Nusselt number, Re is the Reynolds number, Pr is the Prandtl number and fc is
the Moody friction factor expressed by
f
=( )2 ,I34where the Re is defined as
Re= pvD. (3.5)
In Eq. (3-5), p , v and y are density, velocity and viscosity of the fluid respectively. Deq is the
equivalent hydraulic diameter which in case of PCHE is
Dq = 47rd (3.6)
8
d+x7r-2
where d is the diameter of the semicircular flow channel.
For the laminar regime (Re < 2300), a constant Nu of 4.089 was used, which is good for semicircular channels. In the transition region between 2300 < Re < 5000, linear interpolation between the laminar and turbulent regimes was used [Dostal, 2004]:
ha,,n =ham (hlrb
(
Re- 2300 . (3.7)h
),,,
5000 - ReIn Eq. (3-5), hiam is heat transfer coefficient at laminar region and hturb is the turbulent heat
transfer coefficient at Re of 5000.
For the two-phase heat transfer coefficient, the Chen superposition correlation, Eq. (2.7)
was used for qualities between 0 and 0.95. After reaching a quality of 0.95, due to the low
velocity of the flow, the main mechanism of heat transfer is that of pure superheated vapor and
the Gnielinski correlation is used again. For the zigzag channels, the above heat transfer
coefficient is multiplied by 2.3, as derived by Ishizuka [Ishizukat .et al., 2005] based on
experiments with PCHE. It is noted that in OTHSG experiments, it was found that the
centrifugal force of helical tubes did not enhance heat transfer coefficient in the two phase
regime. The same could be true for the zigzag channels in PCHE. However, as will be seen
later, the cold side heat transfer coefficient in the boiling region affects the PCHE overall
The pressure drops for the single phase portions of the PCHE were modeled by using
experimental results from Tokyo Institute of Technology [Ishizuka .et al., 2005]. The two-phase
pressure drop was modeled by using the Taylor correlation [Hesselgreaves, 2001]. Headers and
orifices pressure drops were modeled based on the geometric specifications. Refer to the
appendix D for more details on header design and stress calculations.
The PCHE code requires the inlet mass flow rate, pressure and temperature for both hot
and cold sides in order to produce results. The code first guesses the total length of the PCHE,
and then it divides the length into 60 nodes. Starting with the node at the inlet of the primary
side (or outlet of the secondary side), the code calculates the heat transfer coefficient and
pressure drop in each node and estimates a new length for the individual nodes. The lengths of
the nodes are summed up and are used to calculate the total transferred power of the PCHE. This
value is compared to the target power value, if it is not within 0.1%, then the new total length is
estimated by scaling the previous guess by the ratio of the estimated power to desired power. In
case of the wall temperature iteration scheme and the subcooled boiling calculations, the same
method as described in Section 2-1 was used.
3.2
Validation of PCHE model
Due to atypical thermal hydraulic conditions in the PCHE (e.g. low mass flux and small
channel diameter) compared to most present experimental data and empirical formulation for
two-phase flow, and lack of any experimental results with two-phase flow with water as the
working fluid for the PCHE, it is very important to examine a range of correlations. For the base
case (the first case in Figure 3-3) for subcooled nucleate boiling region, the Froster-Zuber, for
two-phase heat transfer, the Chen and for the pressure drop, the Chisholm correlations were
originally used. The Jens and Lottes and Thom nucleate boiling correlations were also
considered [Todreas .et al., 1990]. A new two-phase heat transfer correlation developed by
Tokyo University for low Reynolds numbers in small diameter tubes was implemented [Zhang
.et al., 2005]. In addition, another new two-phase heat transfer correlation developed by
Argonne National Laboratory (ANL) for horizontal small diameter flows with comparable mass
fluxes was used [Yu .et al., 2002]. Also, for compact surfaces, the Cooper correlation,
recommended by Cornwell and Kew [Cornwell, 1999] was applied.
For pressure drop, the C coefficient in the Chisholm correlation was assumed to be zero
due to the small diameter of the tube. Holt developed a correlation that correlates the C
coefficient as an exponential function of the hydraulic diameter; Holt's experiments include a
diameter size similar to the PCHE [Holt .et al., 1997]. A new pressure drop model was used as
an alternative to Chisholm from the ANL experiment. The Taylor correlation was also
recommended to be used for compact heat exchangers. Taylor treats the liquid phase and vapor
phase separately as opposed to the Chisholm correlation, which assumes both phases are either
turbulent or laminar [Hesselgreaves, 2001].
0.35- 0.3- 0.25-.c 0.2-0.15 ~0.1 0.05-0
Z ber Jens Thorn Tokyo AMLh2p Cooper Holt ANL..delp Taylor
Two-phae hest Twop mpressure dop
Nucleate Boiling trarsfer coefficient
120 100-I 80- 160-at & 40-20 0
Zuber Jens Thom Tokyo AL h2p Cooper. Hot ALt,_del Taylor
Nucleate Boiling Twophasi heat Two-phase pressure dop
transfer coefficient
(b)
Figure 3-3 Effect of different correlations on (a) total length and (b) pressure drop of the PCHE
As seen in Figure 3-3, the overall effect of the new heat transfer correlation compared to
Chen's is not very significant in terms of the PCHE overall length and pressure drop. However,
some of the boiling correlations resulted in a heat transfer coefficient significantly greater than
Chen's correlation. Yet, due to the laminar liquid phase and turbulent vapor phases present for
the current PCHE case, which is based on the IRIS conditions, the Chisholm correlation
over-predicts the pressure drop. In fact, this has been experimentally proven for small mass fluxes [Yu
.et al., 2002]. Therefore, the Taylor correlation will be used for the rest of the analysis to
compare the PCHE performance to that of the OTHSG.
The validity of the single phase friction factor developed by TITECH for water and CO2 as
the working fluids was also examined. As seen in Figure 3-4, the "Regular" uses the fanning
friction factor for laminar and the Blasius friction factor for Turbulent [Todreas et al. 1990]. The "Advance" uses the "Regular" friction factors but also takes into account the laminar and
turbulent entry regions [Idelchick, 1986]. The TITECH correlation calculates a straight channel
friction factor and uses it to calculate the zigzag friction factor. However, as seen in Figure 3-4,
this straight channel correlation differs from the "Regular" and "Advance" values for Reynolds
40
numbers less than 1000. Normally, this will not cause any problems, however, when calculating
the two phase friction multiplier at high qualities the single phase Reynolds number will be very
low, so, the TITECH correlation will underestimate the friction pressure drop. So for the final PCHE model, the "Advance" method was used for low Reynolds numbers.
9 8 7 6 .5 4
.3-
TITECH
2 Regular Advance 1 0 0 500 1000 1500 2000 2500 3000 ReFigure 3-4 A comparison of different methods to calculate the straight channel single phase
frictionfactor
3.3 Stability analysis of PCHE
This section discusses the stability issues that are relevant to PCHE and its operating
conditions within the IRIS design. In general compact units are susceptible to have blocked
passages due to particulates in the fluid stream. It is recommended to use two parallel compact
holes. Also, the reduced cost of maintenance and cleaning due to much less required space by
PCHE usually offsets the added capital cost for the new unit. PCHEs are particularly sensitive to operation outside their design margins. Small changes to velocity could affect the temperature
significantly, especially in the current case with high heat flux. The startup of the PCHE is also
of concern especially under two phase conditions.
The PCHE is believed to be not susceptible to vibration instability, because of strong
bonds between the plates. However, excursive instability, which is characterized by small
perturbations in operating parameters that could result in a large departure from the steady state
condition, has been observed in subcooled nucleate boiling regions of small diameter tubes
caused by blocked channels. Since the flow is subcooled at the inlet and super heated at the
outlet, the internal pressure gradient with mass flux change must be positive at all times in
addition to being less than the pump applied gradient. Density wave instability is not expected to
be observed for PCHE due to high operating pressure and higher pressure drop at the inlet than
the exit [Kakac, 1991].
The Critical Heat Flux (CHF) will also need to be addressed to understand its safety
implications, and also to see the effects on the total length required by the PCHE. In general, for a horizontal flow in tube, if the flow is stratified then the CHF is zero at the vapor side. To
check the stratification of the flow regime Taitel and Dukler Flow regime map was used [Hewitt
.et al., 1987]. Figure 3-5 shows that the nominal PCHE mass flux is well below the stratification
145 105 85 ~65 45 0 0.1 0.2 0.3 0.4 0.5 0.6 0.7 0.8 0 9 1 Quality
Figure 3-5 Minimum Mass Flux for Stratification vs. Quality
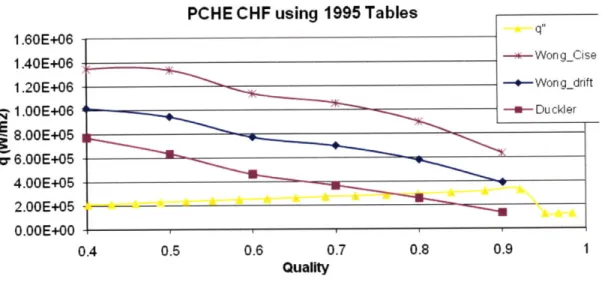
To calculate the CHF for the PCHE, two correction factors are used. The first correction
factor changes the vertical CHF to its equivalent horizontal CHF with 8mm diameter tube [Yu,
2002]. Three options for the correction factors were used, the Duckler correction factor
[Groeneveld et al., 1986], the Wong correction factor [Wong et al., 1990] with CISE [Triplett et
al., 1999] and Drift flux [Todreas et al., 1990] models for the void coefficient correlation. It is
noted that Yu recommended the Wong correlation to be used with CISE void correlation [Yu et
al., 2002]. For the full equations of the above correlations Appendix D can be consulted. As
seen in Figure 3-7, the small difference in void coefficients makes an enormous impact on the
khor, the horizontal critical heat flux correction factor due to the presence of the exponential
function in the Wong correlation. The values of Khor can be obtained as a function of flow rate
and void coefficients from equation:
khor=1-exp[-(T/3)Y] (3.8)
Where Ti is given by a complex function in terms of flow rate and void coefficient shown in
Appendix D [Wong et al., 1990].
-.- Gmin