Publisher’s version / Version de l'éditeur:
Journal of Magnetic Resonance Imaging, 31, 4, pp. 829-837, 2010-04-29
READ THESE TERMS AND CONDITIONS CAREFULLY BEFORE USING THIS WEBSITE.
https://nrc-publications.canada.ca/eng/copyright
Vous avez des questions? Nous pouvons vous aider. Pour communiquer directement avec un auteur, consultez la première page de la revue dans laquelle son article a été publié afin de trouver ses coordonnées. Si vous n’arrivez pas à les repérer, communiquez avec nous à [email protected].
Questions? Contact the NRC Publications Archive team at
[email protected]. If you wish to email the authors directly, please see the first page of the publication for their contact information.
NRC Publications Archive
Archives des publications du CNRC
This publication could be one of several versions: author’s original, accepted manuscript or the publisher’s version. / La version de cette publication peut être l’une des suivantes : la version prépublication de l’auteur, la version acceptée du manuscrit ou la version de l’éditeur.
For the publisher’s version, please access the DOI link below./ Pour consulter la version de l’éditeur, utilisez le lien DOI ci-dessous.
https://doi.org/10.1002/jmri.22101
Access and use of this website and the material on it are subject to the Terms and Conditions set forth at
Human cervical spinal cord funiculi: Investigation with magnetic resonance diffusion tensor imaging
Onu, Mihaela; Gervai, Patricia; Cohen-Adad, Julien; Lawrence, Jane; Kornelsen, Jennifer; Tomanek, Boguslaw; Sboto-Frankenstein, Uta Nicola
https://publications-cnrc.canada.ca/fra/droits
L’accès à ce site Web et l’utilisation de son contenu sont assujettis aux conditions présentées dans le site LISEZ CES CONDITIONS ATTENTIVEMENT AVANT D’UTILISER CE SITE WEB.
NRC Publications Record / Notice d'Archives des publications de CNRC:
https://nrc-publications.canada.ca/eng/view/object/?id=e5bd9ff3-bb7a-4faf-a26e-0839b425fbd6 https://publications-cnrc.canada.ca/fra/voir/objet/?id=e5bd9ff3-bb7a-4faf-a26e-0839b425fbd6
Human cervical spinal cord funiculi: Investigation with magnetic resonance
diffusion tensor imaging
Onu, Mihaela; Gervai, Patricia; Cohen-Adad, Julien; Lawrence, Jane; Kornelsen,
Jennifer; Tomanek, Boguslaw; Sboto-Frankenstein, Uta Nicola
Keywords:
cervical spinal cord; DTI; MRI; tractography; funiculiPurpose:
To use spinal cord diffusion tensor imaging (DTI) for investigating human cervical funiculi, acquire axial diffusion magnetic resonance imaging (MRI) data with an in-plane resolution sufficient to delineate subquadrants within the spinal cord, obtain corresponding DTI metrics, and assess potential regional differences.
Materials and Methods:
Healthy volunteers were studied with a 3 T Siemens Trio MRI scanner. DTI data were acquired using a single-shot spin echo EPI sequence. The spatial resolution allowed for the delineation of regions of interest (ROIs) in the ventral, dorsal, and lateral spinal cord funiculi. ROI-based and tractography-based analyses were performed.
Results:
Significant fractional anisotropy (FA) differences were found between ROIs in the dorsal and ventral funiculi (P = 0.0001), dorsal and lateral funiculi (P = 0.015), and lateral and ventral funiculi (P = 0.0002). Transverse diffusivity was significantly different between ROIs in the ventral and dorsal funiculi (P = 0.003) and the ventral and lateral funiculi (P = 0.004). Tractography-based quantifications revealed DTI parameter regional differences that were generally consistent with the ROI-based analysis.
Conclusion:
Original contributions are: 1) the use of a tractography-based method to quantify DTI metrics in the human cervical spinal cord, and 2) reported DTI values in various funiculi at 3 T. J. Magn. Reson. Imaging 2010;31:829–837. ©2010 Wiley-Liss, Inc.
IN THE LAST TWO DECADES basic research on spinal cord injury and pathology has made exciting progress in identifying factors that beneficially influence spinal cord repair and regeneration. In the human, the evaluation of treatment efficacy and spinal cord fiber tract integrity in vivo is limited to behavioral sensorimotor assessments (1–4). Notwithstanding the importance of these assessments there is a growing interest to noninvasively assess human spinal cord white matter micro-architecture in vivo (5–9).
Diffusion tensor imaging (DTI) is a noninvasive magnetic resonance technique that is sensitive to the diffusion of water molecules within and across extracellular spaces of tissues. Anisotropic diffusion in the central nervous system (CNS) is caused by barriers to diffusion, such as cell membranes and myelin found in CNS white matter (WM). Higher anisotropy in WM compared to gray matter (GM) has been demonstrated in vivo in both animals and humans and it is generally understood that the primary reason for this higher anisotropy in WM is due to packed axon bundles in various WM regions (10, 11). Although WM delineation with DTI is well established in brain, the application of DTI in the spinal cord is more difficult because of its small cross-sectional size, susceptibility artifacts, and motion artifacts from cerebrospinal fluid (CSF) pulsation and respiration.
The diameter of the human cervical spinal cord enlargement is ≈13 mm. In cross-section the spinal cord is typically characterized by the butterfly-shaped GM surrounded by WM. The WM on each side of the spinal cord can be grossly divided into dorsal, lateral, and ventral funiculi. The dorsal funiculus is the spinal cord WM on either side between the dorsal median sulcus and the dorsal root. Similarly, the ventral funiculus is the WM lying on either side between the ventral median fissure and the ventral root and finally the lateral funiculus is the WM on either side of the spinal cord between the dorsal and ventral roots.
Funiculi carry distinct ascending somatosensory and descending motor spinal cord tracts. For example, the dorsal funiculus carries the ascending dorsal column pathway which carries information necessary for fine tactile discrimination, vibration sensitivity, and position sense. The lateral funiculus carries the corticospinal and spinothalamic tracts, which are concerned with voluntary motor movements and pain transmission. The ventral funiculus contains various tracts including the ventral corticospinal, medial reticulospinal, vestibulospinal, and tectospinal tracts, each subserving unique functions. For example, the vestibulospinal tract is involved in the vestibular control of posture and balance, whereas the tectospinal tract is implicated in the reflexive turning of the head to orient to visual stimuli. These tracts show variation in
morphometric features with respect to axon density, axon diameter, and axon spacing (12–16). Variation in axon diameter is also supported by human anatomy where the smallest fibers are found in the fasciculus gracilis, the tract of Lissauer (dorsal funiculus), and inner part of the lateral funiculus; while the largest are situated in the ventral funiculus and in the peripheral part of the lateral funiculus (17).
Although there are a large number of studies that have examined the human spinal cord by means of DTI, these studies have generally focused on technical developments such as MRI sequence optimization, data processing, and display and ultimately clinical applications. The majority of these studies have been conducted at 1.5 T. While the ultimate goal of DTI is to precisely characterize the detailed structure of and differences between individual spinal cord
tracts, our study provides a tractography-based method to quantify DTI metrics in various spinal cord funiculi. This method was validated with region of interest (ROI)-based analyses and various DTI metrics are reported in the cervical spinal cord of eight healthy subjects. To the best of our knowledge there is only one study examining differences in diffusion anisotropy in human dorsal and lateral spinal cord funiculi, at 1.5 T. In that study the authors used an ROI method to report significant differences between fractional anisotropy (FA) values of the dorsal and lateral cervical WM (5); however, DTI metrics from the ventral funiculus were not reported.
Furthermore, transverse (t) and longitudinal (l) diffusivity coefficients were also used in the present study to characterize detailed information about spinal cord micro-architecture as they directly correlate with axon morphometry, each reflecting distinct histological parameters (14,
18). As such, transverse diffusivity was positively correlated with axon spacing and longitudinal diffusivity with axon diameter (14, 15). The evaluation of individual directional diffusivities is relevant because it can provide additional information to help characterize tissue integrity beyond the general measure of anisotropic water diffusion.
Since there are few in vivo investigations on human WM characterization using diffusion MRI at ≥3 T (19, 20), the aim of the present study was twofold: 1) acquire in vivo axial diffusion MRI data in human at 3 T with an in-plane resolution sufficient to delineate various subquadrants in all spinal cord funiculi, and more specifically 2) report ROI-derived and tractography-derived DTI metrics in each funiculus and assess potential regional differences.
MATERIALS AND METHODS
Subjects
Studies were performed on eight healthy adults (age range: 18–40 years, mean age: 29.1 ± 4.9 years, five men and three women). Informed consent was obtained prior to subjects' entry into the magnet. Ethics approval was obtained from the local Human Research Ethics Board. Subjects gave written informed consent and were free of exclusion criteria for MRI.
MR Data Acquisition
A whole-body 3 T clinical MRI scanner (TRIO, Siemens Medical Solutions, Erlangen,
Germany) was used for data acquisition. This system has 32 fast radiofrequency (RF) channels and supports integrated parallel acquisition techniques. An eight-channel phased array spine coil, a neck coil, and the posterior elements of a 12-channel receive-only head coil were used
simultaneously for imaging. A high gradient system (up to 40 mT/m) enabled DTI. RF transmission was performed using the body coil integrated into the magnet bore. Images were acquired in the cervical spinal cord region with the center slice on cervical spinal cord level C5. Anatomical scans were acquired with the following parameters: T2*-weighted FLASH gradient echo sequence with flow compensation, same orientation plane as for diffusion-weighted data (axial), 256 × 205 matrix, 30 slices, no gap, TR = 700 msec, TE = 7.38 msec, flip angle = 25°,
voxel size = 1.3 × 1.3 × 1.9 mm. The T2*-weighted sequence generated the best gray/white matter contrast for ROI analyses (see Data Processing section).
DTI data were acquired using a single-shot spin echo (SE) EPI sequence. Imaging was performed using the following scanning parameters: imaging plane: axial, phase encoding direction: A–P; echo spacing was 0.82 msec, TE = 109 msec, TR = 5600 msec; number of slices = 30; interslice gap = 0 mm; bandwidth = 1396 Hz/pixel, voxel size = 1.3 × 1.3 × 1.9 mm; acquisition matrix 128 × 128; NEX = 4. Images were acquired with b values of 0 and 800 s/mm2 in 20 directions following an icosahedral scheme. Parallel acquisition using GRAPPA
(generalized autocalibrating partially parallel acquisition) with an effective acceleration factor of 2.56 was used to keep acquisition time at a clinically acceptable level of 8 minutes.
Data Processing
The basics of DTI is to estimate the so-called diffusion tensor D in equation A = exp(-b.D), where A stands for the signal attenuation and b for the characterization of the gradient pulse (time, amplitude). A multiple regression is performed to recover D, then the latter matrix is diagonalized to retrieve the three eigenvalues (λ1, λ2, λ3). In the present study, tensor estimation and tractography procedures were performed using the freely available software MedINRIA. (23). The derived eigenvalues were used to calculate FA (24). We further defined longitudinal diffusivity as λl = λ1 and the transverse diffusivity λt = (λ2 + λ3)/2. The tractography algorithm was based on trilinear log-Euclidean interpolation and used a standard streamline algorithm (25). The tractography procedure was automatic, since every voxel of the reference volume was a seeding point (26).
Prior to analysis the mosaic DICOM volumes were split and then averaged according to their gradient directions.
The anatomical T2*-weighted volume was rigidly registered to the b0 volume (MedINRIA software/Registration Tool Module). We performed a b0 to anatomical image linear rigid body registration with 3 degrees of freedom. The Image Fusion module allowed us to undo and redo registration steps while examining the results by fusing the target image with the current registered image. This allowed us to estimate the efficiency of each registration step.
The anatomical volume was then used for defining ROIs. To confirm the appropriate position, each ROI was overlaid onto the co-registered FA map. Figure 1a shows typical ROIs covering the dorsal, ventral, and lateral funiculi. To quantify diffusion parameters and to perform selective tractography, the ROIs were manually designated at cervical level C5–C6, in three consecutive axial slices. Small ROIs were carefully drawn to limit partial volume effects between CSF, WM, and GM (27). To avoid CSF contamination from pixels located in the median fissure area, two ROIs were designated within both dorsal and ventral WM regions (Fig. 1a).
Figure 1. Axial slice of the cervical spinal cord (level C5). Four ROIs are overlaid on a T2*-weighted anatomical image for diffusion tensor parameter evaluations and selective
tractography. The ROI for the dorsal funiculus is depicted in red, right lateral in blue, left lateral in yellow, and the ROI for the ventral funiculus in green (images are in radiological orientation
and the top of the image is dorsal). For both dorsal and ventral funiculi two ROIs were drawn to avoid contamination of ROIs by CSF (a). Schematic of spinal cord tracts on the same T2*-weighted anatomical image to depict some of the tracts that may have been covered by the manually drawn ROIs (b).
Mean values and standard deviation of diffusion parameters were computed within each of the ROIs. The values from three consecutive slices were then averaged for each volunteer. Selective tractography was performed with an FA threshold of 0.2. Tractography-derived DTI metrics are also reported.
RESULTS
Overall this work provides results of diffusion tensor parameters and extracted fiber bundles in human cervical spinal cord funiculi at 3 T. The transverse anatomy of the spinal cord with the central GM butterfly configuration surrounded by WM is well visible in the anatomical volume. Very few distortions related to susceptibility artifact were apparent, which ensured a good correspondence between the anatomical and the b0 images. The spatial resolution was sufficient to delineate spinal cord subquadrants. For example, it was possible to define ROIs in the ventral spinal cord (Fig. 1a) and to localize spinal nerves and nerve roots entering on either side of the cord when performing tractography (Fig. 3b).
The results of the quantitative analysis of the cervical spinal cord enlargement are shown in Tables 1 and 2. ROI-derived FA values (averaged over three central slices) and tractography-derived FAs (averaged over the specific column's entire length) are reported, respectively. Principal diffusivity indices (transverse diffusivity (λt), perpendicular to, and longitudinal diffusivity (λl), parallel to the long axis of axons in spinal cord) are also reported.
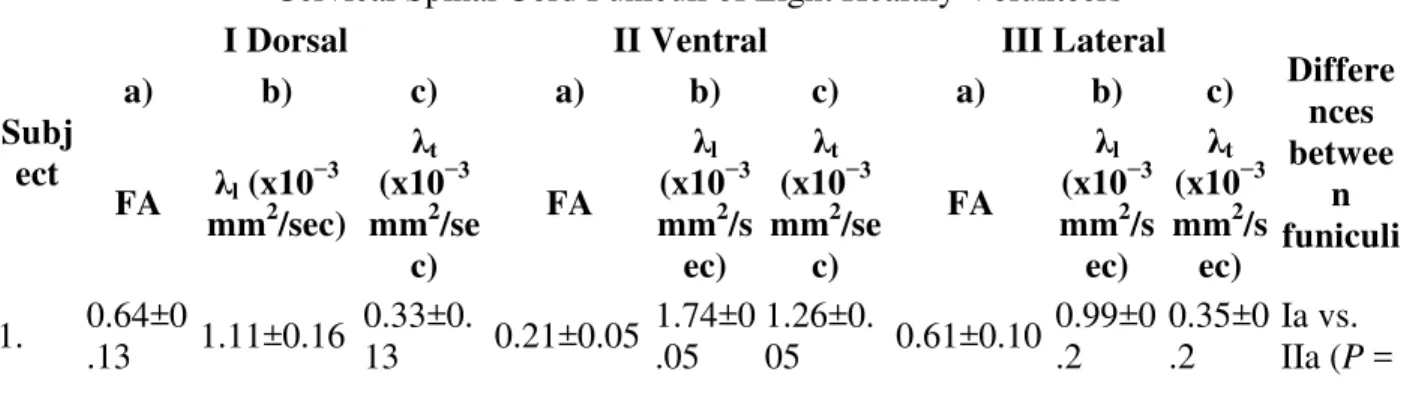
Table 1. Fractional Anisotropy (FA), Longitudinal (λl), and Transverse Diffusivity (λt) Values in Cervical Spinal Cord Funiculi of Eight Healthy Volunteers
Subj ect
I Dorsal II Ventral III Lateral
Differe nces betwee n funiculi a) b) c) a) b) c) a) b) c) FA λl (x10 −3 mm2/sec) λt (x10−3 mm2/se c) FA λl (x10−3 mm2/s ec) λt (x10−3 mm2/se c) FA λl (x10−3 mm2/s ec) λt (x10−3 mm2/s ec) 1. 0.64±0 .13 1.11±0.16 0.33±0. 13 0.21±0.05 1.74±0 .05 1.26±0. 05 0.61±0.10 0.99±0 .2 0.35±0 .2 Ia vs. IIa (P =
Table 1. Fractional Anisotropy (FA), Longitudinal (λl), and Transverse Diffusivity (λt) Values in Cervical Spinal Cord Funiculi of Eight Healthy Volunteers
Subj ect
I Dorsal II Ventral III Lateral
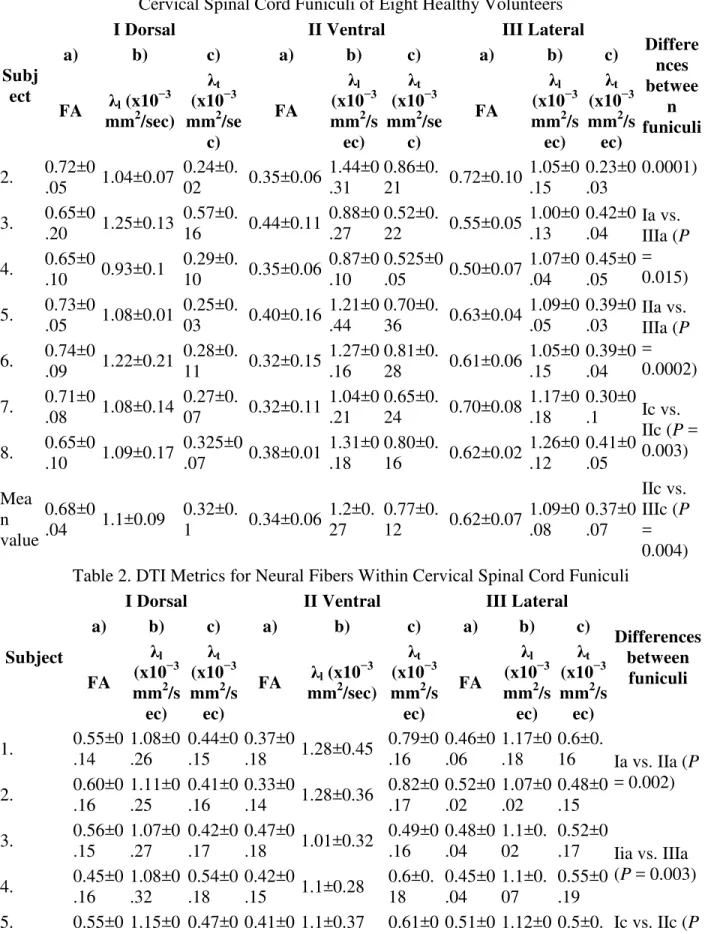
Differe nces betwee n funiculi a) b) c) a) b) c) a) b) c) FA λl (x10 −3 mm2/sec) λt (x10−3 mm2/se c) FA λl (x10−3 mm2/s ec) λt (x10−3 mm2/se c) FA λl (x10−3 mm2/s ec) λt (x10−3 mm2/s ec) 2. 0.72±0 .05 1.04±0.07 0.24±0. 02 0.35±0.06 1.44±0 .31 0.86±0. 21 0.72±0.10 1.05±0 .15 0.23±0 .03 0.0001) 3. 0.65±0 .20 1.25±0.13 0.57±0. 16 0.44±0.11 0.88±0 .27 0.52±0. 22 0.55±0.05 1.00±0 .13 0.42±0 .04 Ia vs. IIIa (P = 0.015) 4. 0.65±0 .10 0.93±0.1 0.29±0. 10 0.35±0.06 0.87±0 .10 0.525±0 .05 0.50±0.07 1.07±0 .04 0.45±0 .05 5. 0.73±0 .05 1.08±0.01 0.25±0. 03 0.40±0.16 1.21±0 .44 0.70±0. 36 0.63±0.04 1.09±0 .05 0.39±0 .03 IIa vs. IIIa (P = 0.0002) 6. 0.74±0 .09 1.22±0.21 0.28±0. 11 0.32±0.15 1.27±0 .16 0.81±0. 28 0.61±0.06 1.05±0 .15 0.39±0 .04 7. 0.71±0 .08 1.08±0.14 0.27±0. 07 0.32±0.11 1.04±0 .21 0.65±0. 24 0.70±0.08 1.17±0 .18 0.30±0 .1 Ic vs. IIc (P = 0.003) 8. 0.65±0 .10 1.09±0.17 0.325±0 .07 0.38±0.01 1.31±0 .18 0.80±0. 16 0.62±0.02 1.26±0 .12 0.41±0 .05 Mea n value 0.68±0 .04 1.1±0.09 0.32±0. 1 0.34±0.06 1.2±0. 27 0.77±0. 12 0.62±0.07 1.09±0 .08 0.37±0 .07 IIc vs. IIIc (P = 0.004) Table 2. DTI Metrics for Neural Fibers Within Cervical Spinal Cord Funiculi
Subject
I Dorsal II Ventral III Lateral
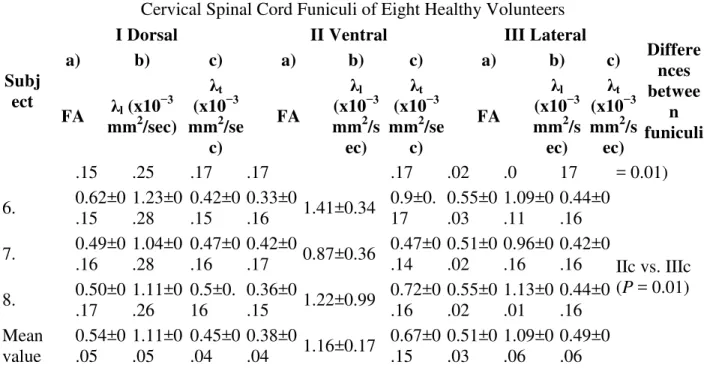
Differences between funiculi a) b) c) a) b) c) a) b) c) FA λl (x10−3 mm2/s ec) λt (x10−3 mm2/s ec) FA λl (x10 −3 mm2/sec) λt (x10−3 mm2/s ec) FA λl (x10−3 mm2/s ec) λt (x10−3 mm2/s ec) 1. 0.55±0 .14 1.08±0 .26 0.44±0 .15 0.37±0 .18 1.28±0.45 0.79±0 .16 0.46±0 .06 1.17±0 .18 0.6±0. 16 Ia vs. IIa (P = 0.002) 2. 0.60±0 .16 1.11±0 .25 0.41±0 .16 0.33±0 .14 1.28±0.36 0.82±0 .17 0.52±0 .02 1.07±0 .02 0.48±0 .15 3. 0.56±0 .15 1.07±0 .27 0.42±0 .17 0.47±0 .18 1.01±0.32 0.49±0 .16 0.48±0 .04 1.1±0. 02 0.52±0 .17 Iia vs. IIIa (P = 0.003) 4. 0.45±0 .16 1.08±0 .32 0.54±0 .18 0.42±0 .15 1.1±0.28 0.6±0. 18 0.45±0 .04 1.1±0. 07 0.55±0 .19 5. 0.55±0 1.15±0 0.47±0 0.41±0 1.1±0.37 0.61±0 0.51±0 1.12±0 0.5±0. Ic vs. IIc (P
Table 1. Fractional Anisotropy (FA), Longitudinal (λl), and Transverse Diffusivity (λt) Values in Cervical Spinal Cord Funiculi of Eight Healthy Volunteers
Subj ect
I Dorsal II Ventral III Lateral
Differe nces betwee n funiculi a) b) c) a) b) c) a) b) c) FA λl (x10 −3 mm2/sec) λt (x10−3 mm2/se c) FA λl (x10−3 mm2/s ec) λt (x10−3 mm2/se c) FA λl (x10−3 mm2/s ec) λt (x10−3 mm2/s ec) .15 .25 .17 .17 .17 .02 .0 17 = 0.01) 6. 0.62±0 .15 1.23±0 .28 0.42±0 .15 0.33±0 .16 1.41±0.34 0.9±0. 17 0.55±0 .03 1.09±0 .11 0.44±0 .16 7. 0.49±0 .16 1.04±0 .28 0.47±0 .16 0.42±0 .17 0.87±0.36 0.47±0 .14 0.51±0 .02 0.96±0 .16 0.42±0 .16 IIc vs. IIIc (P = 0.01) 8. 0.50±0 .17 1.11±0 .26 0.5±0. 16 0.36±0 .15 1.22±0.99 0.72±0 .16 0.55±0 .02 1.13±0 .01 0.44±0 .16 Mean value 0.54±0 .05 1.11±0 .05 0.45±0 .04 0.38±0 .04 1.16±0.17 0.67±0 .15 0.51±0 .03 1.09±0 .06 0.49±0 .06 The normality of the data distribution was checked (R version 2.7.2,) for each diffusion
parameter on N values equal to the number of subjects multiplied by the ROI number of pixels for each dorsal, ventral, and lateral funiculus and by the number of investigated slices. The Shapiro-Wilk results were consistent with normality (P > 0.05). Therefore, analysis of variance (ANOVA) and a post-hoc t-test were used for assessing differences between diffusion indices means. The ANOVA demonstrated overall significant differences between WM regions for FA and transverse diffusivity (FA: F = 65.2, P < 0.01, λt: F = 11.09, P < 0.01) (ROI-based method) and between funiculi for FA and transverse diffusivity (FA: F = 21.5, P < 0.01, λt: F = 10.5, P < 0.01) (tractography-based method). Post-hoc analysis results are summarized in Tables 1 and 2, correspondingly.
WM Diffusion Tensor Parameters
Using the ROI-based method FA values were significantly decreased in ROIs of the ventral funiculus compared to the dorsal and lateral funiculi (P < 0.01 for both) (Table 1). Fractional anisotropy values in dorsal and lateral funiculi ROIs were also significantly different (P < 0.0159). A Student's t-test revealed no significant difference between left and right lateral
funiculi. Therefore, we averaged the data of both lateral funiculi for comparisons with dorsal and ventral funiculi as has been done in a previous study (5). Transverse diffusivity (λt) was
significantly different between ROIs located in the ventral and dorsal funiculi (P < 0.01) and ventral and lateral (P < 0.01) funiculi with transverse diffusivity being highest in the ventral funiculus. There was no significant difference in longitudinal diffusivities (λl) between ROIs. As a reference, in-plane GM measurements were performed: FA of 0.28 ± 0.07, λl of 1.14 ± 0.5 × 10⁻³ mm2/secand λt of 0.715 ± 0.41 × 10⁻³ mm2/sec.
Tractography Within Funiculi
Figure 3a depicts a three dimensional fiber tractography map in cross sectional view. Figure 3b shows the same tractography map in an oblique view. Fibers are FA-color coded using a spectrum color code (green with low fiber FA values through yellow, medium, to red with high fiber FA values). The center butterfly-shaped GM is clearly visible in the green spectrum corresponding to low FA values. The GM is closely surrounded by fibers with medium FA values as well as fibers with high FA values in the periphery. Visually comparing the ventral and dorsal columns in Fig. 3, it is noticeable that both appear to contain red fibers, indicating a high FA value. At the same time ventral fibers show a lower density (54.8 streamlines/5.9 mm3) compared to dorsal fibers (70.6 streamlines/5.9 mm3). This difference in reconstructed fiber density can be visually assessed in our tractography (Fig. 3a).
In addition to ROI-based quantifications, we also report tractography-based quantifications, which offer a more automatic means to quantify diffusion characteristics along WM tracts. Table
2 reports FA values of fiber bundles within ROIs of cervical spinal cord funiculi. FA values within each funiculus were averaged across the entire length of the fiber bundle. The general pattern of both tractography and ROI-derived FA values is similar. For example, the highest FA values were found in fibers traveling through the dorsal funiculus, while the lowest FA values were associated with fibers traveling through the ventral funiculus. FA values differed
significantly between fibers of the ventral and dorsal funiculi (P < 0.01). FA values also differed significantly between fibers in the ventral and lateral funiculi (P < 0.01). Dorsal fiber FA values were not significantly different when compared to lateral fiber FA values (P = 0.12). Transverse diffusivity (table 2) was significantly higher for fibers going through the ventral funiculus when compared to both dorsal (P < 0.01) and lateral (P < 0.01) columns. Longitudinal diffusivity for fiber tracts showed no significant variation among funiculi, similar to the ROI-based results. Figure 2 shows the b0, FA, and main eigenvalue maps. Highest FA values can be seen on dorsal and lateral areas of the spinal cord, in exactly the same regions where the transversal diffusivity components (lambda 2 and lambda 3) show the lowest values.
Figure 2. The magnified b0 image (a) FA map with high FA values in the dorsal and lateral aspects of the spinal cord (b), λ1 map with slightly lower values in spinal cord areas that may correspond to GM (light blue) compared to areas that may correspond to WM (light green) (c), λ2 (d), and λ3 (e) maps showing lower values in the dorsal and lateral aspects of the spinal cord section corresponding to the same regions showing high FA values in (a).
As a reference, using the tractography method GM measurements were performed: FA of 0.3 ± 0.1, λl of 0.88 ± 0.2 × 10⁻³ mm2/sec. and λt of 0.5 ± 0.1 × 10⁻³
DISCUSSION
Since the introduction of DTI in spinal cord investigation, many efforts have been made to quantify diffusion parameters in various regions of the spinal cord. Previous human studies focused on differences between diffusion indices measured at different levels of the cervical spinal cord (6, 27). As such, FA tends to be higher at higher levels of the cervical spinal cord. For example, Wheeler-Kingshott et al (6) reported a significant difference between mean FA of C2/C3 and C5/C6. Van Hecke et al (27) made similar observations and further observed that this increase is independent of age. Other studies investigated diffusion processes in transverse sections of the spinal cord reporting higher anisotropy in the WM than in the GM (5, 28–30). Fewer studies have investigated anisotropy differences between various spinal cord WM funiculi. These have been largely demonstrated in rat and cat (13–15, 29, 31, 32). Recently, significant differences between FA in dorsal and lateral funiculi have been reported in the human spinal cord (5). The degree of these differences is still under discussion.
In the present work, WM architecture was examined in cross-sections of the human cervical spinal cord. Tensor analyses revealed consistent directionality of principal eigenvectors within the cervical spinal cord WM as well as spinal nerves projecting to the body of the spinal cord (Fig. 3b). The spatial resolution of the anatomical image enabled the delineation of ROIs in dorsal, lateral, and ventral spinal cord funiculi. The selected ROIs contain a combination of spinal cord pathways, so it was not possible to draw ROIs small enough to characterize particular ascending or descending tracts. However, the main WM areas in the spinal cord were visible and, after a correlation of the b0 image with the anatomical slices (co-registration), diffusion
parameter analysis was performed.
Figure 3. Cervical spinal cord tractography overlaid onto level C5 FA map. Fibers are FA-color-coded using a spectrum color code. The center butterfly-shaped GM is clearly visible in the green spectrum corresponding to fibers with low FA values. WM is composed of yellow, orange, and red fibers corresponding to medium and high FA values. A lower density of fibers in the ventral area can be visually detected (a). Oblique view of the same tractography map co-registered with the anatomical image (b) (images are in radiological orientation and the top of the image is ventral).
The general pattern of regional WM diffusion differences are similar to those reported by Rossi et al (5), the only previous study investigating human funiculi by DTI means, to our knowledge. Although our FA values are comparable to those reported by Rossi et al (5), they are slightly lower. Our FA values were obtained at the C5–C6 spinal cord level while the exact level of FA assessment was not defined by Rossi et al (5). It is possible that their measurements were performed at a higher level of the cervical spinal cord. This different location along the cervical
spinal cord might provide an explanation for our slightly lower FA values. In our study dorsal funiculus FA values ranged from 0.64 ± 0.13 to 0.74 ± 0.09 (Table 1), whereas Rossi et al values ranged from 0.71 ± 0.06 to 0.88 ± 0.05. Magnetic field strength can be a further consideration in varying FA values. Differences have been reported for brain and spine, with higher field strength and parallel imaging resulting in significantly improved DTI (19, 33). On the contrary, Hunsche et al (34) reported a negligible effect of field strength on FA when controlling for the signal-to-noise ratio between fields.
Similar to Rossi et al's study (5), our analyses revealed significant differences between FA values of the dorsal and lateral WM. In addition to their study, our ROI-based and tractography-based investigations of the ventral funiculus demonstrated significantly lower FA values when
compared to both the dorsal and lateral funiculi (Table 1). These results are also consistent with those obtained in animal studies, where FA values were always lowest in the ventral funiculi (16,
29, 32). Madi et al (29) found that FA values in the dorsal WM of rat spinal cord in vivo are higher relative to the ventral WM. This difference disappears in excised cords. The group attributed this difference to the more compact and densely packed fibers projecting through the dorsal WM, as these densely packed fibers are expected to provide more hindrance to the translational diffusion perpendicular to axons, thus resulting in larger FA values.
As long as longitudinal diffusivity demonstrated no significant variation among funiculi in our study, the lower transverse diffusivity in the dorsal funiculus was expected to accompany the higher FA when compared to the ventral funiculus. Indeed, transverse diffusivity (λt) was highest in ROIs located in the ventral funiculus and significantly different from λt in the lateral and dorsal funiculi (Tables 1, 2). In support, the FA map in Fig. 2b shows higher values in dorsal and lateral aspects of the spinal cord cross-section, while in the same areas, Lambda 2 (Fig. 2d) and mainly, Lambda 3 (Fig. 2e) show their lowest values. Work by Takahashi et al (16) suggests that transverse diffusivity measurements are sensitive to the diameter of axons and to fiber packing density. The group showed that as the mean diameter of axons increases from the dorsal to the lateral and ventral funiculi and axons are progressively less densely packed, transverse
diffusivity increases. On the contrary, Schwartz et al (14) did not find a correlation between transverse diffusivity and axon diameter in excised rat cervical spinal cords but reported a
positive correlation of transverse diffusivity with extracellular volume fraction and axon spacing, suggesting that extracellular water mobility is the primary determinant of transverse diffusivity. In a separate article, Schwartz et al (15) found that the vestibulospinal tract which had the largest axons also had the highest transverse diffusivity values. Recently, Ong et al (13) used q-space imaging (QSI)—an alternative diffusion MRI technique—to assess axonal architecture in excised mouse spinal cord. Using 1D-QSI they measured the full-width at half-maximum (FWHM) of the molecular displacement probability function. This function defines the probability that a molecule at any initial position is displaced along an arbitrary gradient direction. In 1D-QSI, where the gradients are applied perpendicular to the axon fibers, FWHM is similar to the transverse diffusivity parameter used in conventional diffusion MRI. Ong et al (13) found an excellent agreement between FWHM and axon diameters calculated from histology. Thus, in our study the high transverse diffusivity in the ventral funiculus suggests increased axon diameter and spacing relative to the lateral and dorsal funiculi, which is also consistent with the anatomy of the human spinal cord where the largest fibers are found in the ventral funiculus and the peripheral part of the lateral funiculus (17).
Our study also provides information on the individual directional diffusivities (λt and λl) in normal spinal cord funiculi. Recently, Ellingson et al (7) provided normative DTI parameters including FA, λ1, λ2, and λ3 along the length of the spinal cord, but not across different funiculi. At level C5–C6 our parameters with an FA value of 0.55, λ1 of 1.13, λ2 of 0.61, and λ3 of 0.36 are comparable to those reported by Ellingson et al (7).
Several previous studies (15, 35) showed that while the data might indicate no change in FA, increases or decreases in both longitudinal and transverse diffusivities can reflect specific pathology. Therefore, reporting individual diffusivities along with FA values may help future studies aimed at detecting specific pathological changes.
Figure 3 depicts FA-coded tractography maps. To date, FA values have been documented for different segments of the spinal cord as well as cross-sections of the spinal cord. Figure 3a shows that the distribution of fibers with high and low FA values is in agreement with reports of low FA values in the center GM and high FA values in the surrounding WM (5, 7, 36). However, visually comparing the ventral and dorsal columns in Fig. 3a, it is noticeable that both appear to contain red fibers, indicating a high FA value, which is contrary to our reports of high FA values in the dorsal column and low FA values in the ventral column. One potential explanation of this discrepancy may involve the fiber density index (FDi). Roberts et al (37) report a high positive correlation (r = 0.81) between the FDi and FA. Reviewing our data, ventral fibers have a lower density (54.8 streamlines/5.9 mm3) compared to dorsal fibers (70.6 streamlines/5.9 mm3). This difference in reconstructed fiber density can be visually assessed in our tractography (Fig. 3a). It has been proposed that the assessment of WM anisotropy at different levels along the spinal cord may allow for monitoring the integrity of nervous fibers and provide useful support in the diagnosis of spinal injuries (31, 38). Figure 3b provides a 3D view of FA-coded tractography along the entire length of the cervical spinal cord segment. These FA-coded tractography maps can serve as a quick and useful tool in evaluating overall fiber tract integrity, or spinal cord WM displacement in pathological conditions (39, 40).
There are no previous studies reporting tractography-derived metrics for individual funiculi in human spinal cord. FA values within different funiculi of the entire spinal cord have been reported in the cat and no significant differences were observed between funiculi (38). For a similar assessment done in human cervical spinal cord, our seed points were delineated from the ROIs and diffusion indices were obtained by averaging values over the entire fiber length in the cervical spinal cord segment (Table 2). We found lowest FA (0.38 ± 0.04) (highest λt) values for
fibers going through the ventral funiculus of the cervical spinal cord segment. A further
observation revealed that the tractography-derived variation in FA among fibers in different WM funiculi has a similar pattern to the one seen in axial sections using the ROI-based data analysis. Dorsal funiculi demonstrate the highest FA values followed by lateral and ventral FA values. Therefore, similar to the interpretation of the ROI-based data, the larger axon diameters and extracellular spaces may be responsible for the higher transverse diffusivity and corresponding anisotropy decrease in the ventral funiculus. Even though fiber FA values were lower when averaging values over the entire fiber length (tractography-based analysis), it is possible that this type of averaging included lower levels of the spinal cord where the FA values are known to be reduced (27, 31, 36).
Tractography analyses were conducted with a threshold of 0.2. Applying a lower threshold can result in the inclusion of voxels contaminated by CSF or partial volume effects. On the contrary, a high threshold can result in biasing the data by excluding too many voxels from the analysis (27). There are other methodological issues worth consideration. First, the spatial resolution employed in this study was 1.3 × 1.3 mm in-plane with a slice thickness of 1.9 mm. Using a spin echo sequence with high in-plane resolution Gullapalli et al (32) were able to identify individual fiber tracts such as the corticospinal, rubrospinal, vestibulospinal, and reticulospinal tracts in the rat spinal cord. More recently, Cohen-Adad et al (38) used a single-shot spin echo EPI sequence with high spatial resolution (1 mm3) and the group was able to delineate ROIs including a combination of tracts in the cat spinal cord. In comparison to other human spinal cord DTI studies, the resolution employed in our study allowed for the additional definition of ROIs located in the human ventral funiculus, which enabled assessment of diffusion parameters information in this WM region. In the future, with the improvement of pulse sequences and higher magnetic field, it may be possible to further develop this delineation toward a finer characterization of ascending/descending tracts.
Since we did not use cardiac gating, image quality may have been compromised by artifacts from pulsatile flow of the surrounding CSF. Although motion of the spinal cord is lower in the
transverse plane (7), it has been shown that cardiac related motion might increase ADC in the rostral-caudal direction, thus potentially biasing FA quantification along the cord. It should be noted, however, that cardiac gating does neither prevent subject motion, nor respiratory-related fluctuations of the image in the phase-encoding direction (41, 42).
The curvature of the spinal cord makes it difficult to acquire slices that are all perpendicular to the cord, resulting in potential partial volume effects. To rectify this problem we repositioned the subject using a combination of cushions to limit lordosis.
Finally, the tractography method appears to be more inclusive (partial volume effect) than a manual ROI delineation and this may have influenced statistical comparisons. Indeed, the absolute values of the tractography-derived FA are lower than in the ROI method. Therefore, manual ROI delineation may be more advantageous to employ in a clinical setting.
In conclusion, we were able to measure diffusion anisotropy in human cervical spinal cord funiculi and assess FA values within fibers of different spinal cord funiculi. The spatial
resolution enabled comparisons of anisotropy indices among funiculi, either with ROI-derived or tractography-derived metrics, showing regional diffusion differences in cervical spinal cord WM.
Acknowledgements
We thank Dr. Pierre Fillard for many relevant suggestions and data analysis help. We also thank Dr. Ian Smith of the National Research Council Institute for Biodiagnostics whose support made this work possible.
1 Bareyre FM, Kerschensteiner M, Raineteau O, Mettenleiter TC, Weinmann O, Schwab ME.
The injured spinal cord spontaneously forms a new intraspinal circuit in adult rats. Nat Neurosci 2004; 7: 269–277.
2 Fouad K, Pearson K. Restoring walking after spinal cord injury. Prog Neurobiol 2004; 73:
107–126.
3 Kerschensteiner M. Strategies for axonal repair in central nervous system diseases. J
Neurol 2007; 254( Suppl 1): I29–I32.
4Rossignol S. Plasticity of connections underlying locomotor recovery after central and/or
peripheral lesions in the adult mammals. Philos Trans R Soc Lond 2006; 36: 1647–1671.
5Rossi C, Boss A, Steidle G, et al. Water diffusion anisotropy in white and gray matter of the
human spinal cord. J Magn Reson Imaging 2008; 27: 476–482.
6Wheeler-Kingshott CAM, Hickman SJ, Parker GJM, et al. Investigating cervical spinal cord
structure using axial diffusion tensor imaging. Neuroimage 2002; 16: 93–102.
7Ellingson BM, Ulmer JL, Kurpad SN, Schmit BD. Diffusion tensor MR imaging of the
neurologically intact human spinal cord. AJNR Am J Neuroradiol 2008; 29: 1279–1284.
8Ellingson BM, Ulmer JL, Kurpad SN, Schmit BD. Diffusion tensor MR imaging in chronic
spinal cord injury. AJNR Am J Neuroradiol 2008; 29: 1976–1982.
9Mamata H, De Girolami U, Hoge WS, Jolesz FA, Maier SE. Collateral nerve fibers in
human spinal cord: visualization with magnetic resonance diffusion tensor imaging. Neuroimage 2006; 31: 24–30.
10Basser PJ, Jones DK. Diffusion-tensor MRI: theory, experimental design and data
analysis — a technical review. NMR Biomed 2002; 15: 456–467.
11Beaulieu C. The basis of anisotropic water diffusion in the nervous system — a technical
review. NMR Biomed 2002; 15: 435–455.
12Assaf Y, Blumenfeld-Katzir T, Yovel Y, Basser PJ. AxCaliber: a method for measuring
axon diameter distribution from diffusion MRI. Magn Reson Med 2008; 59: 1347–1354.
13Ong HH, Wright AC, Wehrli SL, et al. Indirect measurement of regional axon diameter in
excised mouse spinal cord with q-space imaging: simulation and experimental studies. Neuroimage 2008; 40: 1619–1632.
14Schwartz ED, Cooper ET, Fan Y, et al. MRI diffusion coefficients in spinal cord correlate
15Schwartz ED, Cooper ET, Chin C, Wehrli S, Tessler A, Hackney DB. Ex vivo evaluation of
ADC values within spinal cord white matter tracts. AJNR Am J Neuroradiol 2005; 26: 390– 397.
16Takahashi M, Hackney DB, Zhang G, et al. Magnetic resonance microimaging of
intraaxonal water diffusion in live excised lamprey spinal cord. Proc Natl Acad Sci U S A 2002; 99: 16192– 16196.
17Gray H. Gray's anatomy: the anatomical basis of clinical practice. London:
Churchill-Livingstone, Elsevier; 2008.
18Ford JC, Hackney DB, Lavi E, Phillips M, Patel U. Dependence of apparent diffusion
coefficients on axonal spacing, membrane permeability, and diffusion time in spinal cord white matter. J Magn Reson Imaging 1998; 8: 775–782.
19Rossi C, Boss A, Lindig TM, et al. Diffusion tensor imaging of the spinal cord at 1.5 and
3.0 Tesla. Rofo 2007; 179: 219–224.
20Ng M, Hu Y, Wu E, Yang E, Luk K. Diffusion tensor-based fiber tracking in cervical spinal
cord with a 3T MRI. In: IEEE Southwest Symposium on Image Analysis and Interpretation, Los Alamitos, CA: IEEE Computer Society; 2006. p 76–80.
21Ardekani S, Selva L, Sayre J, Sinha U. Quantitative metrics for evaluating parallel
acquisition techniques in diffusion tensor imaging at 3 Tesla. Invest Radiol 2006; 41: 806– 814.
22Cohen-Adad J, Piche M, Rainville P, Benali H, Rossignol S. Impact of realignment on
spinal functional MRI time series. Conf Proc IEEE Eng Med Biol Soc 2007; 2007: 2126– 2129.
23Fillard P, Pennec X, Arsigny V, Ayache N. Clinical DT-MRI estimation, smoothing, and
fiber tracking with log-Euclidean metrics. IEEE Trans Med Imaging 2007; 26: 1472–1482.
24Pierpaoli C, Basser PJ. Toward a quantitative assessment of diffusion anisotropy. Magn
Reson Med 1996; 36: 893–906.
25Xu D, Mori S, Solaiyappan M, Zijl PCMV, Davatzikos C. A framework for callosal fiber
distribution analysis. Neuroimage 2002; 17: 1131–1143.
26Fillard P, Arsigny V, Pennec X, Ayache N. Clinical DT-MRI estimation, smoothing and
fiber tracking with log-Euclidean metrics. In: 3rd IEEE International Symposium on Biomedical Imaging: Nano to Macro; 2006. p 786–789.
27Van Hecke W, Leemans A, Sijbers J, Vandervliet E, Van Goethem J, Parizel PM. A
diffusion-related changes of the cervical spinal cord with aging. J Magn Reson Imaging 2008; 27: 978–991.
28Fenyes DA, Narayana PA. In vivo diffusion characteristics of rat spinal cord. Magn Reson
Imaging 1999; 17: 717–722.
29Madi S, Hasan KM, Narayana PA. Diffusion tensor imaging of in vivo and excised rat
spinal cord at 7 T with an icosahedral encoding scheme. Magn Reson Med 2005; 53: 118– 125.
30Moseley ME, Cohen Y, Kucharczyk J, et al. Diffusion-weighted MR imaging of anisotropic
water diffusion in cat central nervous system. Radiology 1990; 176: 439–445.
31Ellingson BM, Kurpad SN, Li S, Schmit BD. In vivo diffusion tensor imaging of the rat
spinal cord at 9.4T. J Magn Reson Imaging 2008; 27: 634–642.
32Gullapalli J, Krejza J, Schwartz ED. In vivo DTI evaluation of white matter tracts in rat
spinal cord. J Magn Reson Imaging 2006; 24: 231–234.
33Alexander AL, Lee JE, Wu Y, Field AS. Comparison of diffusion tensor imaging
measurements at 3.0 T versus 1.5 T with and without parallel imaging. Neuroimaging Clin N Am 2006; 16: 299–309, xi.
34Hunsche S, Moseley ME, Stoeter P, Hedehus M. Diffusion-tensor MR imaging at 1.5 and
3.0 T: initial observations. Radiology 2001; 221: 550–556.
35Song S, Sun S, Ju W, Lin S, Cross AH, Neufeld AH. Diffusion tensor imaging detects and
differentiates axon and myelin degeneration in mouse optic nerve after retinal ischemia. Neuroimage 2003; 20: 1714–1722.
36Wilm BJ, Gamper U, Henning A, Pruessmann KP, Kollias SS, Boesiger P.
Diffusion-weighted imaging of the entire spinal cord. NMR Biomed 2009; 22: 174–181.
37Roberts TP, Liu F, Kassner A, Mori S, Guha A. Fiber density index correlates with
reduced fractional anisotropy in white matter of patients with glioblastoma. AJNR Am J Neuroradiol 2005; 26: 2183–2186.
38Cohen-Adad J, Benali H, Hoge RD, Rossignol S. In vivo DTI of the healthy and injured cat
spinal cord at high spatial and angular resolution. Neuroimage 2008; 40: 685–697.
39Ducreux D, Lepeintre J, Fillard P, Loureiro C, Tadié M, Lasjaunias P. MR diffusion
tensor imaging and fiber tracking in 5 spinal cord astrocytomas. AJNR Am J Neuroradiol 2006; 27: 214–216.
40Facon D, Ozanne A, Fillard P, Lepeintre J, Tournoux-Facon C, Ducreux D. MR diffusion
tensor imaging and fiber tracking in spinal cord compression. AJNR Am J Neuroradiol 2005; 26: 1587–1594.
41Van de Moortele P, Pfeuffer J, Glover GH, Ugurbil K, Hu X. Respiration-induced B0
fluctuations and their spatial distribution in the human brain at 7 Tesla. Magn Reson Med
42van Gelderen P, de Zwart JA, Starewicz P, Hinks RS, Duyn JH. Real-time shimming to