INTRODUCTION
Species diversity plays an important role in pro-cesses related to ecosystem functioning. It is widely accepted that species diversity, which is defined as richness, abundance, and composition of species as well as interactions between species, promotes pro-duction and ecosystem stability (Chapin et al. 2000, Hooper et al. 2005, Duffy & Stachowicz 2006, Tilman et al. 2006, Worm et al. 2006). However, anthropogenic activities can affect community biodiversity directly by exploitation, pollution, and invasive species introduc-tion, and indirectly by modifying habitats and, more
globally, by affecting climate via greenhouse gas emis-sions (Worm et al. 2006). Exploitation of marine resources and of a trophic level in particular can greatly modify community structure, inducing a cas-cade effect on the food chain (Scheffer et al. 2005). In the North Atlantic, the intensive exploitation of top predators such as the Atlantic cod Gadus morhua and other groundfish predators in the 1980s led to a dra-matic reduction of this trophic level and, consequently, of its ecological role in structuring communities (Worm & Myers 2003). This top-down effect was proposed for the Eastern Scotian Shelf, where the rise of small pelagic fish and invertebrates like the snow crab
Chio-© Inter-Research 2010 · www.int-res.com *Email: alicebui@mac.com
Ichthyoplankton community structure in the
north-west Gulf of St. Lawrence (Canada): past and present
Alice O. V. Bui
1, 2,*, Patrick Ouellet
1, Martin Castonguay
1, Jean-Claude Brêthes
21Department of Fisheries and Oceans, Institut Maurice Lamontagne, 850 Route de la Mer, PO Box 1000, Mont-Joli,
Québec G5H 3Z4, Canada
2Institut des Sciences de la Mer de Rimouski, 300 Allée des Ursulines, Rimouski, Québec G5L 3A1, Canada
ABSTRACT: Biodiversity can play an important role in the stability and resilience of ecosystems when these are faced with environmental change or anthropogenic impacts. Historically, the northwest Gulf of St. Lawrence had high fish egg and larval productivity. To assess changes in the ichthyoplankton community of this region, data from sampling surveys that were carried out in spring from 1985 to 1987 were compared with data from spring 2005 to 2007. Significant differences in ichthyoplankton abundances between the 2 decades and sampling times (May versus June) were revealed by multivariate analyses (nMDS, ANOSIM, PERMANOVA, and SIMPER) and univariate (ANOVA) analyses. Total ichthyoplankton abundance was lower in the 2000s than during the mid-1980s. Although larval sandlance Ammodytes spp. abundances did not change significantly, other taxa, such as Stichaeidae larvae and H4B eggs (gadids and merlucciid hakes, rocklings, butterfish Peprilus triancanthus, windowpane Scophthalmus aquosus and Gulf Stream flounder Citharichthys arctifrons), became more abundant; the abundance of CHW eggs (cod Gadus morhua, haddock Melanogrammus aeglefinus, witch flounder Glyptocephalus cynoglossus), and redfish Sebastes spp. larvae generally declined by more than an order of magnitude. Greenland halibut Reinhardtius hip-poglossoides larvae also appeared in the 2000s assemblages. This dominance shift in the ichthyo-plankton community reflects the demise of large fish predators and the response of the non-commer-cial species. Our study provides much-needed new information concerning current biodiversity and productivity of the fish community in the Gulf of St. Lawrence and insights into changes influenced by groundfish collapse and environmental fluctuations.
KEY WORDS: Ichthyoplankton assemblages · Community change · Multivariate analyses · Regime shift · Gulf of St. Lawrence
noecetes opilio and the northern shrimp Pandalus borealis in the benthic community, and the decrease of large-bodied zooplankton (> 2 mm) were observed fol-lowing the decline of the Atlantic cod (Frank et al. 2005). Although marine ecosystems are subject to both bottom-up and top-down controls on variable spatio-temporal scales (Scheffer et al. 2005), Frank et al. (2006) found that, in the Northwest Atlantic, more productive southern ecosystems tend to be bottom-up regulated whereas less productive northern ecosys-tems, such as the northern Gulf of St. Lawrence, tend to be top-down controlled.
The water column of the Gulf of St. Lawrence is seasonally stratified. The cold intermediate layer (CIL) is a cold (~0°C) and salty water layer formed by local winter cooling and inflows of Labrador Shelf water; it overlays the deep layer that is relatively warmer and saltier. In summer, the CIL is constrained between 40 and 150 m, when a warm, low-salinity surface layer develops with seasonal heating (Saucier et al. 2003, Drinkwater & Gilbert 2004). Oceanographic condi-tions in the Gulf of St. Lawrence have shown impor-tant interannual fluctuations during the last 20 yr. In particular, a cooling event in the CIL was recorded from the mid-1980s to the mid-1990s due to a succes-sion of particularly cold winters coupled with strong cold-water inputs from the Labrador Shelf through the Strait of Belle Isle (Gilbert & Pettigrew 1997, Drink-water & Gilbert 2004). The cooling of the CIL likely affected the distribution and migration patterns of the northern Gulf cod stock (Castonguay et al. 1999) and created unfavorable conditions for cod egg develop-ment and survival (Ouellet 1997) as well as adult survival (Dutil & Lambert 2000). The cold-water intru-sions were correlated with zooplankton community changes in the lower Estuary and in the northwestern Gulf (Harvey & St-Pierre 2002). However, conditions were more stable in the deep layers, with little change being observed in average bottom (200–300 m) water temperatures since the mid 1980s, except for a few years of strong negative anomalies between 1990 and 1995 (Galbraith et al. 2009). Low oxygen concentra-tion is also a characteristic of the deep waters in the Estuary and in the Gulf. In the Estuary, mean O2
concentration is 65 µM (20.7% saturation) with little variability since 1984, compared to 125 µM (37.7% saturation) in the 1930s (Gilbert et al. 2005). Low O2 concentrations affect the growth and activity of
marine organisms and can become lethal below a species-specific threshold (Chabot & Dutil 1999). Such temperature and oxygen level fluctuations affect the distribution, productivity, and growth of ground-fish communities (Blanchard et al. 2005, Poulard & Blanchard 2005, Benoît & Swain 2008, Chabot & Claireaux 2008).
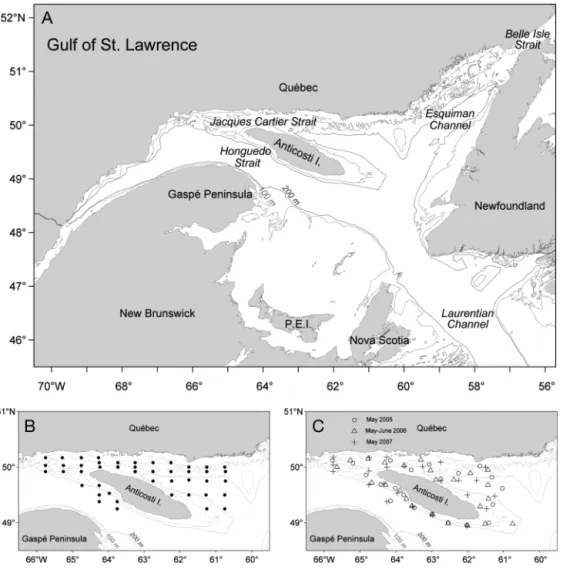
Historically, the northwest Gulf of St. Lawrence has proven to be an important area for the production of fish eggs and larvae, with 33 species having been recorded (Ouellet 2007). The region surrounding Anti-costi Island (Fig. 1A) was identified as 1 of the 10 eco-logically and bioeco-logically significant areas (EBSA) within the Estuary and Gulf of St. Lawrence (DFO 2007). It was suggested that specific hydrographic characteristics around the island create conditions for enhanced biological production and possibly the retention of fish eggs and larvae in the region (Iles & Sinclair 1982).
Ichthyoplankton sampling provides many advan-tages for describing fish communities. It offers the pos-sibility to sample and evaluate the abundance of a large portion of the species present in marine ecosys-tems with a simple method that requires only a plank-ton net (Sherman et al. 1984), assuming that sampling coincides with spawning periods. In the case of com-mercial species under moratorium, this method may provide fishery-independent abundance indicators as well as the possibility to estimate parental stock size (e.g. Saville & Schnack 1981, Grégoire 2000).
The objective of this study was to compare the ichthyo-plankton community structure of the northwest Gulf between 2 time periods: the 1980s and the 2000s. Nu-merous groundfish species spawn in spring. Given the importance of many fish species for the fishing industry in this part of Canada, an analysis of the current ground-fish community through ichthyoplankton sampling allowed us to assess the status of fish production and to improve our knowledge about the current biodiversity of the northwest Gulf of St. Lawrence. Our hypotheses were that the ichthyoplankton community structure has changed and, more precisely, that the abundance levels of Atlantic cod eggs and redfish larvae have decreased in the 2000s due to the reduction of these stocks, and that the abundance levels of other species have subsequently changed. The results are discussed in light of the hypoth-esis of top-down control on northern marine ecosystems and the recent history of environmental fluctuations in the northern Gulf of St. Lawrence.
MATERIALS AND METHODS
Sampling methodology. Ichthyoplankton samples were collected in May and June from 1985 to 1987 and from 2005 to 2007 in the northwest Gulf of St. Lawrence (Table 1, Fig. 1B,C). For the 2000s period, the main goal was to report on the spawning activity of the Atlantic cod in the northwest Gulf. The objectives were different for the 1980s cruises, which were large-scale surveys whose primary aim was to study the spatial structure and distribution of northern shrimp
larvae in the entire northern Gulf (Ouellet et al. 1990). Ichthyoplankton data from the 2000s were compared to a subset of stations from the 1980s so that the areas were comparable between the 2 decades. In the 1980s, stations were distributed along north–
south lines that were separated by ~40 km; stations along the lines were ~15 km apart (Fig. 1B). In the 2000s, fewer stations were sampled during each cruise than in the 1980s, but over-all, the spatial extent was comparable between the 2 periods except for the southeast Anticosti area (Fig. 1C). Moreover, for both decades, stations were distributed to sample the deep and shallow areas of the region.
The basic sampling protocol was the same for both decades. Ichthyoplank-ton were collected using 61 cm
dia-meter bongo nets with 333 µm mesh and flow dia-meters at the mouth of each to calculate the volume filtered. When possible, a double-oblique tow was carried out from the surface to 150 m. In shallower stations, the Table 1. Cruise dates and sampling effort. June 1985 and 1986 are considered
as June cruises although sampling started in May
Cruise No. of Sampling dates Median sampling Temperature (°C)
stations day of year mean ± SD
1985 Jun 40 May 20 – Jun 4 147.5 No data 1986 May 50 Apr 30 – May 12 126 –0.005 ± 0.462
Jun 52 May 26 – Jun 9 153 1.668 ± 0.624 1987 May 45 May 9 – May 19 134 0.292 ± 0.503 2005 May 21 May 9 – May 12 130.5 0.504 ± 0.324 2006 May 24 May 11 – May 14 132.5 1.831 ± 0.428 Jun 22 Jun 6 – Jun 8 158 3.269 ± 0.632 2007 May 24 May 15 – May 17 136 0.723 ± 0.352 Fig. 1. (A) The Gulf of St. Lawrence with the different channels and straits. (B) Distribution of stations during the 1980s (May 1987 shown) and (C) during the 2000s cruises: (s) May 2005, (n) May and June 2006, (+) May 2007. Lines represent the 100 and
double-oblique tow was carried out from the surface to ~10 m off the bottom. An additional double-oblique tow was done in the upper layer from the surface down to ~15 m for the 1980s cruises; this depth was increased to ~50 m for the 2000s cruises to improve the sampling of cod eggs (Ouellet 1997). Samples were immediately preserved in a 4% buffered formaldehyde and sea-water solution. Samples from one bongo were used for this study. To overcome potential identification differ-ences between decades, eggs and larvae that were identified from the 1980s cruises were verified for this study.
Temperatures. Temperature data were collected for all cruises except for June 1985. Temperatures were measured using a CTD profiler in June 1986, May 1987, and May 2007, an XBT probe in May 1986, and a temperature and depth data logger (Minilog, Vemco) in May 2005, May 2006, and June 2006. Mean temper-atures of the upper layer (5 to 50 m), where most fish eggs and larvae are found, were calculated for each cruise. The first 5 m were not included in the mean temperature calculation to reduce the variability caused by wind, tidal mixing, and solar heating. The first 50 m of the water column also represent a uniform layer for comparison of cruises to reduce the potential bias caused by a varying number of stations with dif-ferent depths among cruises.
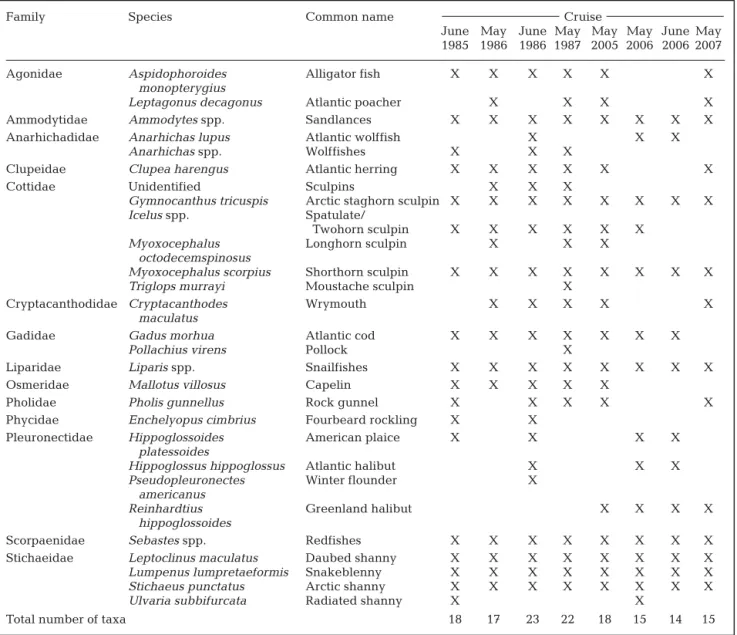
Ichthyoplankton community description. All fish eggs and larvae were identified to the lowest taxo-nomic level possible. Some taxa were not identifiable below the genus level, such as sandlances Ammodytes spp., sculpins of the genus Icelus spp. (spatulate or two-horn sculpins), snailfishes Liparis spp., and redfish Se-bastes spp.. Some larvae were damaged in the net; in such cases, identification was usually limited to the family (e.g. Cottidae, Stichaeidae) or genus level for wolffish Anarhichas spp. (Table 2). Because (1) the meristics of shorthorn sculpin Myoxocephalus scorpius and Arctic sculpin Myoxocephalus scorpioides (which co-occur in the Gulf) overlap, (2) the pigmentation pat-tern is described only for shorthorn sculpin larvae (Fa-hay 2007), and (3) there is no information about the spawning time of the Arctic sculpin (Scott & Scott 1988), these 2 species cannot be distinguished and are re-ported as Myoxocephalus scorpius. This is also the case for the Arctic shanny Stichaeus punctatus and fourline snakeblenny Eumesogrammus praecisus, which are both reported as Arctic shanny. Fish egg identification (Table 3) was verified using Markle & Frost’s (1985) identification key.
Fish egg and larval concentrations are expressed as the no. of ind. 10 m–2 following the standardization
equation of Richardson & Smith (1977). To balance the sampling effort between cruises, the information from only 1 bongo tow–1was used in the calculation.
To present an overall view of differences between decades, egg and larval abundances across stations were averaged for each cruise. Maps presenting the distribution of species abundances were produced to verify whether any pattern in the ichthyoplankton distribution within the study area could be identified (see the supplement at www.int-res.com/articles/suppl/ m412p189_supp.pdf).
Statistical analyses. All identifiable taxa were included in the analyses. Multivariate analyses were performed using PRIMER statistical software version 6 (PRIMER-E). Egg and larval concentrations for each taxon were averaged for each cruise. Averaged abun-dances were standardized by the total and then square root transformed to decrease the influence of common versus rare species (Clarke & Warwick 2001). To detect potential structure in the data, a non-metric multi-dimensional scaling (nMDS) ordination based on the Bray-Curtis similarity measure was performed with at least 50 restarts to reduce the stress level using the complete dataset (i.e. egg and larval data). Additional nMDS ordinations were performed using a subset of the data and with the same conditions as above to assess the sensitivity of the test to the depth of the sur-face tows and to the number of stations, both of which differ between the 2 decades. This was done by per-forming 1 nMDS based on surface tow (i.e. tows rang-ing from the surface to 15 or 50 m depth, and shallow water tows) data only and another based on a reduced number of stations for the 1980s (~21 stations in each 1980s cruise were chosen according to their proximity to the 2000s stations to eliminate any effect of sampling effort). Similarly, 2 more nMDS were carried out based on the egg data only and the larval data only to verify whether the higher number of eggs compared to the low number of larvae was influencing the community patterns revealed by the analyses for the 2 decades.
To test for ichthyoplankton community differences between the 2 decades, we performed 2 tests of taxon similarity: an analysis of similarities (ANOSIM) and a permutational multivariate analysis of variance (PER-MANOVA). Both tests use a random permutation proce-dure to generate an appropriate distribution of the test statistic (calculated R for the ANOSIM and calculated pseudo-F for the PERMANOVA) and p-values. The ANOSIM examines how replicate differences within groups compare to replicate differences between groups (groups are defined a priori and are the decades in this case) based on rank similarities (Clarke & Warwick 2001). The value of the resulting measure of the degree of separation (observed R) sets the importance of the dif-ference between groups. When R is close to 1, the a pri-ori groups are very distinct. ANOSIM were performed for each nMDS data selection using 9999 permutations, i.e. nMDS based on (1) the complete dataset including
Table 2. Larval fish taxa collected during each cruise
Family Species Common name Cruise
June May June May May May June May 1985 1986 1986 1987 2005 2006 2006 2007
Agonidae Aspidophoroides Alligator fish X X X X X X
monopterygius
Leptagonus decagonus Atlantic poacher X X X X
Ammodytidae Ammodytes spp. Sandlances X X X X X X X X
Anarhichadidae Anarhichas lupus Atlantic wolffish X X X
Anarhichas spp. Wolffishes X X X
Clupeidae Clupea harengus Atlantic herring X X X X X X
Cottidae Unidentified Sculpins X X X
Gymnocanthus tricuspis Arctic staghorn sculpin X X X X X X X X
Icelus spp. Spatulate/
Twohorn sculpin X X X X X X
Myoxocephalus Longhorn sculpin X X X
octodecemspinosus
Myoxocephalus scorpius Shorthorn sculpin X X X X X X X X
Triglops murrayi Moustache sculpin X
Cryptacanthodidae Cryptacanthodes Wrymouth X X X X X
maculatus
Gadidae Gadus morhua Atlantic cod X X X X X X X
Pollachius virens Pollock X
Liparidae Liparis spp. Snailfishes X X X X X X X X
Osmeridae Mallotus villosus Capelin X X X X X
Pholidae Pholis gunnellus Rock gunnel X X X X X
Phycidae Enchelyopus cimbrius Fourbeard rockling X X
Pleuronectidae Hippoglossoides American plaice X X X X
platessoides
Hippoglossus hippoglossus Atlantic halibut X X X
Pseudopleuronectes Winter flounder X
americanus
Reinhardtius Greenland halibut X X X X
hippoglossoides
Scorpaenidae Sebastes spp. Redfishes X X X X X X X X
Stichaeidae Leptoclinus maculatus Daubed shanny X X X X X X X X
Lumpenus lumpretaeformis Snakeblenny X X X X X X X X
Stichaeus punctatus Arctic shanny X X X X X X X X
Ulvaria subbifurcata Radiated shanny X X
Total number of taxa 18 17 23 22 18 15 14 15
Table 3. Fish egg species/group collected during each cruise
Egg group or species Common name Cruise
June May June May May May June May
1985 1986 1986 1987 2005 2006 2006 2007
CHW Cod, haddock, witch flounder X X X X X X X X
CYT Cunner, yellowtail flounder X X X X
H4B Gadids (other than cod, X X X X X X X X
haddock and pollock), merlucciid hakes, rocklings, butterfish, windowpane, Gulf Stream flounder
Enchelyopus cimbrius Fourbeard rockling X X X X X X
Gadus morhua Atlantic cod X X X X X X X
Glyptocephalus cynoglossus Witch flounder X
Hippoglossoides platessoides American plaice X X X X X X X X
Limanda ferruginea Yellowtail flounder X X
Scophthalmus aquosus Windowpane X
both egg and larval data, (2) egg data only, (3) larval data only, (4) surface-tow data only, and (5) dataset from an equal number of stations between decades only. Since sampling took place in May and June, some sampling time effects on the community (besides the decadal fect) can be expected. To eliminate the sampling time ef-fect when comparing decades (and vice versa), we chose a 2-way crossed ANOSIM since permutations are con-strained by sampling decade and sampling time in the crossed design. However, the removal of one factor when testing for the other reduces the number of real replicates (cruises) within each block (sampling time or decade groups), which can have potential effects on the sensitivity of the test. Therefore, we performed a 1-way ANOSIM for each factor to assess the potential signifi-cance of the results when the 2-way ANOSIM failed to detect significant differences between the tested groups. While the robustness of the ANOSIM is advanta-geous, it does not test for interactions between factors and thus provides no information on whether factor effects on assemblage differences are independent or are the result of a combination of both factors. How-ever, the PERMANOVA decomposes the effects into main effects and interactions. Like ANOVA, PER-MANOVA relies on sums of squares partitioning between and within groups from a distance or a dis-similarity matrix and on the interaction terms in the multivariate space to calculate an F statistic called pseudo-F (Anderson et al. 2008). As the PERMANOVA is distribution-free, the p-values are then obtained using a permutation procedure; like the ANOSIM, PERMANOVA assumes that the samples are exchangeable under a true null hypothesis implying that the multivariate observations are independent and identically distributed (Anderson et al. 2008). In the PERMANOVA, however, more assumptions are made in more complex designs by fitting an additive linear model to the multivariate samples in the chosen resemblance measure (Anderson 2005, Anderson et al. 2008). It therefore assumes that the effects of factors and their interactions can be modelled meaningfully and that errors are independent and identically distrib-uted in the space of the chosen resemblance measure (Anderson et al. 2008). These further assumptions con-fer more power to the PERMANOVA, which comple-ments the ANOSIM. PERMANOVA were performed using 9999 permutations.
Subsequently, a similarity breakdown analysis implemented in the SIMPER procedure was carried out to interpret the origin of group differences that were previously identified by the ANOSIM (Clarke & Warwick 2001). SIMPER determines the percentage contribution of taxa that are responsible for the ichthyoplankton assemblage dissimilarity between groups as well as the percentage contribution of taxa
that are responsible for the assemblage similarity within each group. Graphs of average abundance of each species for each cruise were produced to show the direction of dissimilarity between the 2 periods and to help with the ecological interpretation of results. One-way ANOVA were performed to test for signifi-cant differences in abundance between decades as well as between sampling times for the species that contributed the most to the group dissimilarities as identified by the SIMPER test. To decrease the hetero-geneity in species abundance between groups, a log(x+1) transformation was applied to the data before performing the tests.
RESULTS
Egg and larval assemblages
A maximum of 7 fish egg groups were recorded in June 1985 and June 1986 for the 1980s cruises, while a maximum of 6 groups were recorded in May and June 2006 for the 2000s cruises. The highest number of lar-val fish taxa was recorded in June 1986 (23 taxa) for the 1980s cruises and in May 2005 (18 taxa) in the 2000s. All identified taxa are listed in Tables 2 & 3.
Overall, the spring fish egg community of the northwest Gulf was mainly composed of 4 dominant taxa: CHW (cod, haddock Melanogrammus aeglefi-nus, witch flounder Glyptocephalus cynoglossus), American plaice Hippoglossoides platessoides, H4B (eggs of gadids and merlucciid hakes, rocklings, but-terfish Peprilus triancanthus, windowpane Scophthal-mus aquosus and Gulf Stream flounder Citharichthys arctifrons), and fourbeard rockling (Fig. 2A). Unlike fish eggs, the larval community was composed of a large number of rare taxa and a low number of abun-dant taxa (no more than 5 larval taxa accounted for > 3% of the overall abundance of a cruise) (Fig. 2B). Dominant taxa mainly included larvae of sandlance Ammodytes spp., redfish Sebastes spp., the Stichaei-dae family (e.g. Arctic shanny Stichaeus punctatus, daubed shanny Leptoclinus maculatus, and snake-blenny Lumpenus lumpretaeformis), snailfish Liparis spp., and Arctic staghorn sculpin Gymnocanthus tri-cuspis (Fig. 2B).
A large number of Atlantic herring Clupea harengus larvae (1028 larvae in the surface tow and 2840 larvae in the deep tow) was collected at a single station in June 1986, and the contribution of this single station ranked this species as one of the dominant ichthy-oplankton for that cruise. In all other cruises, herring was typically found in low numbers (usually 1–2 larvae cruise–1, but 7 larvae in May 1987). In the 1980s,
> 3% of the overall larval abundance and were large (total length: 27–64 mm in May 1986 and 24–79 mm in May 1987), sug-gesting that they hatched the year before and spent the winter in the Gulf. In the 2000s, capelin larvae were also quite large, with total length ranging from 20 to 36 mm.
Multivariate and univariate analyses The nMDS identified 2 types of ichthyo-plankton assemblages: one based on the decade (1980s or 2000s) and the other based on sampling time (May or June) (Fig. 3). The nMDS ordination revealed a low stress level (i.e. < 0.1), making the results of the analysis reliable for drawing ecological interpretations using the 2-dimensional plot. The nMDS based on egg data only and on larval data only (Fig. 4A,B) displayed a pattern that is slightly different from the main nMDS presented in Fig. 3. For the nMDS based on the egg data only, not only did some cruises fall on the same point (e.g. May 1986 and May 1987, May 2006 and May 2007, June 1985 and June 1986), but the points were distributed around a circle similar to the so-called degenerate solu-tions that originate from a disjunction of the data (Clarke & Warwick 2001). Such degenerate solutions could result from the within-group dissimilarity being smaller than any between-group dissimilarity, leaving the nMDS with no indication of the distance between groups (Clarke & War-wick 2001).
For the nMDS based on larval data only, the interdecadal groups are less clearly separated in the 2-dimensional plot, but the stress is also very low. The nMDS based on surface tow data only and on an even number of stations across cruises also had a very good stress level (< 0.05) and revealed a pattern that is similar to the nMDS based on both egg and larval data shown in Fig. 3 (Fig. 4C,D). The main structure is thus hardly affected by differ-ences in the number of stations sampled in each decade or by the depth range of the surface tows.
The results of the 2-way ANOSIM for decadal effects based on both the egg and larval data, the surface tow data only, or an
0 50 100 150 200 250 300 Other species Atlantic cod Fourbeard rockling H4B American plaice CHW J06 M06 M05 J85 M87 M86 0 10 20 30 40 50 60 70 80 90 Other species
Arctic staghorn sculpin Capelin Snakeblenny Snailfish Daubed shanny American plaice Arctic shanny Herring Sandlance Redfish J–06 (158) M–07 (136) M–06 (132.5) M–05 (130.5) J–86 (153) J–85 (147.5) M–87 (134) M–86 (126) / / / / / /
A
B
Abundance (no. 10 m –2) A bundance (no. 10 m –2)Cruise (median day number)
Fig. 2. Fish taxa making up > 3% of the total average abundance of the (A) eggs and (B) larvae for each cruise, ordered according to the median sam-pling day of the year for each decade (1980s, 2000s) (H4B: eggs of gadids and merlucciid hakes, rocklings, butterfish, windowpane and Gulf Stream
flounder; CHW: cod, haddock, and witch flounder eggs)
Fig. 3. Non-metric multidimensional scaling ordination plot of the ichthyo-plankton assemblage (using both egg and larval data from both deep and shallow tows) of the 8 cruises based on the square root transformed averaged abundances and Bray-Curtis similarities. (z) 1980s, (M) 2000s.
equal number of stations for each cruise reinforce the conclusion of significant assemblage differences be-tween decades, with high R-values (i.e. groups are very distinct) (Table 4). Interestingly, both 1-way and 2-way ANOSIM for decadal effects failed to detect significant differences for analyses based on larval data only. However, the R-value (0.672) was relatively high in the 2-way ANOSIM. This evidence suggests that the 2000s larval assemblage is distinct from the 1980s as-semblage. The 2-way ANOSIM for sampling time ef-fects revealed no significant results (Table 4), likely
be-cause, as previously stated, the number of possible per-mutations in the 2-way ANOSIM was too low to get sig-nificance at 5%. In contrast, sigsig-nificance was achieved in most 1-way ANOSIM, likely because a higher num-ber of replicates within each block was considered. However, this overestimates the true residual variabil-ity, thereby diminishing the true value of R in the 1-way ANOSIM. On the other hand, the 2-way ANOSIM re-moves the effect of one factor when testing for the other, and thus calculates the true R-values (Clarke & Warwick 2001). The results presented in Table 4 clearly Table 4. Analysis of similarities (ANOSIM) tests: R- and p-values for decadal and sampling time tests. *Significant results
(p < 0.05)
Factor 2-way 1-way
Decade Sampling time Decade Sampling time
R p R p R p R p
Egg and larval data 0.933 0.033* 0.86 0.083 – – 0.692 0.018*
Larval data only 0.672 0.067 1 0.083 0.229 0.2 0.744 0.018*
Egg data only 0.731 0.1 0.442 0.333 0.708 0.029* 0.6 0.036*
Surface tow data only 1 0.033* 1 0.083 – – 0.682 0.018*
Equal number of 0.798 0.033* 1 0.083 – – 0.713 0.018*
stations between cruises
Fig. 4. 2D-nMDS ordination plot of the ichthyoplankton assemblage of the 8 cruises based on square root transformed averaged abundances and Bray-Curtis similarities: (A) egg data only; (B) larval data only; (C) surface tow data only; (D) equal number of
indicate the higher R-values of the 2-way compared to the 1-way ANOSIM; in some cases, the R-values of the former reached the maximum value of 1 for analyses based on larval data only, surface tow data only, and an equal number of stations between cruises, indicating that the groups are clearly distinct. However, a lower R-value was observed in the 2-way ANOSIM for sampling time differences based on the egg data only. The egg assemblage differences between sampling times (R = 0.442) might not be as important as egg assemblage dif-ferences between decades (R = 0.731); nevertheless, re-sults are significant, as demonstrated by the 1-way ANOSIM for both factors.
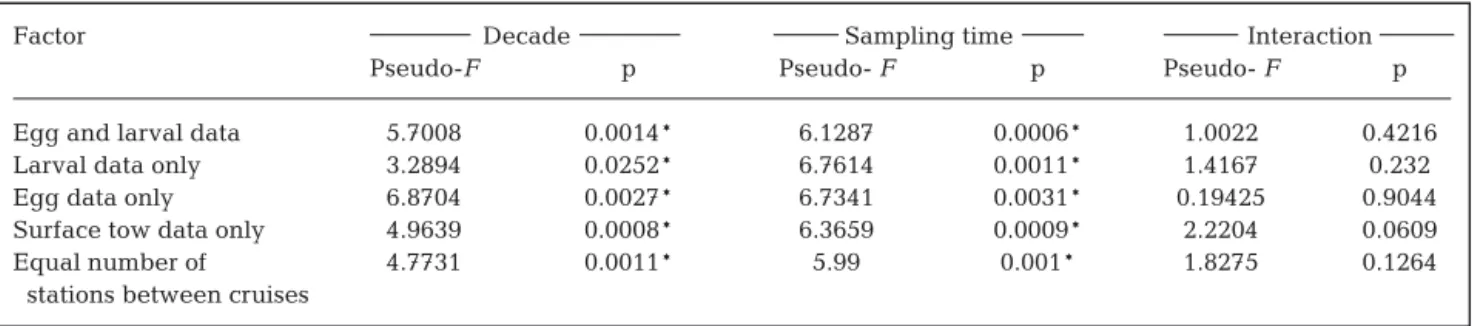
The PERMANOVA revealed significant results for all analyses performed, with no significant interactions. Despite the low degrees of freedom, pseudo-F values were large enough to give clear results, allowing us to reject the null hypothesis of no
differ-ences between groups (Table 5). In gen-eral, the PERMANOVA agreed with the ANOSIM, confirming previous conclu-sions. One exception was the analysis of decadal differences based on larval data only, where the more powerful PERMA-NOVA detected significant results at the 5% level whereas the ANOSIM did not (Table 5). Altogether, these results sug-gest that the decadal assemblage differ-ences seem to be driven by both the fish egg and larval abundances. However, the PERMANOVA results suggest that sampling time assemblage differences are clearly influenced by both fish egg and larval abundances.
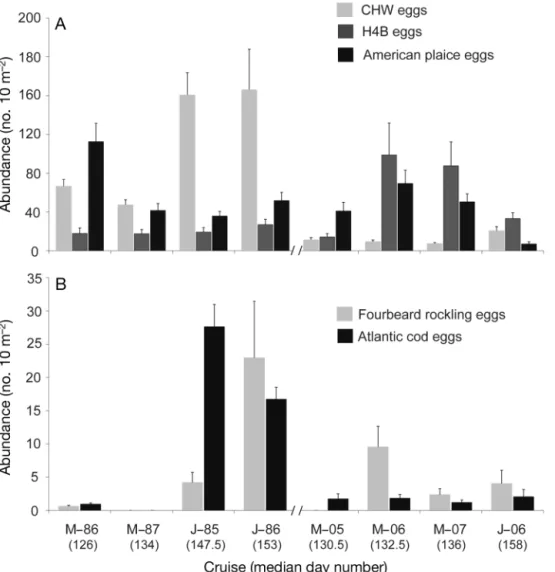
The SIMPER test identified the spe-cies that contributed the most to the as-semblage differences between decades and sampling times (Table 6). Fish eggs had a strong contribution to the decadal assemblage dissimilarities, with CHW being the main contributor (17.4%) fol-lowed by H4B (14.5%), American plaice
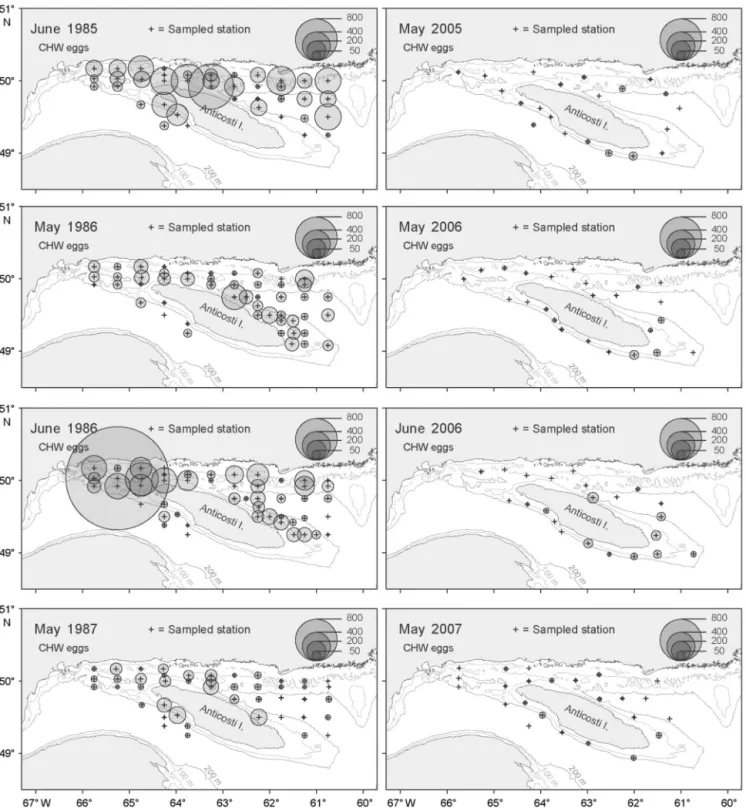
eggs (5.2%), fourbeard rockling eggs (5.1%), and Atlantic cod eggs (4.1%) (Table 6). These contributions could be explained by higher abundances of eggs of CHW, American plaice, Atlantic cod, and fourbeard rockling in the 1980s than in the 2000s, whereas H4B eggs were more abundant in the 2000s (Fig. 5). This is supported by the 1-way ANOVA, which were signifi-cant for all egg groups tested except for fourbeard rockling (Table 7). The case of CHW eggs is of particu-lar interest given the historical importance of Atlantic cod (cod eggs are included in the CHW group) in the northern Gulf ecosystem. In Fig. 6, we show that in the 1980s, cod eggs were more abundant in the Jacques Cartier Strait and west of the Island, especially in June; however, the dramatic reduction in egg density between the 2 decades was observed over the entire sampling area.
Table 5. Two-way PERMANOVA tests: pseudo-F and p-values for both decadal and sampling time factors. *Significant results (p < 0.05)
Factor Decade Sampling time Interaction
Pseudo-F p Pseudo- F p Pseudo- F p
Egg and larval data 5.7008 0.0014* 6.1287 0.0006* 1.0022 0.4216
Larval data only 3.2894 0.0252* 6.7614 0.0011* 1.4167 0.232
Egg data only 6.8704 0.0027* 6.7341 0.0031* 0.19425 0.9044
Surface tow data only 4.9639 0.0008* 6.3659 0.0009* 2.2204 0.0609
Equal number of 4.7731 0.0011* 5.99 0.001* 1.8275 0.1264
stations between cruises
Table 6. Similarity percentages (SIMPER) test of the contribution (%) of the dif-ferent taxa to the decadal (1980s–2000s) and to the sampling time (May–June) dissimilarities in ichthyoplankton assemblage (90% cut-off for low contribution)
Decade Sampling time
Average dissimilarity: 32.73% Average dissimilarity: 33.02% Species Contribution Species Contribution CHW eggs 17.39 American plaice eggs 14.61
H4B eggs 14.5 Redfish 12.49
Arctic shanny 9.28 CHW eggs 8.84
Sandlance 6.1 Atlantic cod eggs 8.16 American plaice eggs 5.24 Fourbeard rockling eggs 7.12 Fourbeard rockling eggs 5.11 Sand lance 6.96
Snailfish 4.36 H4B eggs 4.83
Daubed shanny 4.07 Arctic shanny 4.76 Atlantic cod eggs 4.06 American plaice 4.7
Capelin 3.2 Atlantic herring 3.33
Redfish 2.86 Capelin 3.2
Snakeblenny 2.73 Shorthorn sculpin 1.99 Arctic staghorn sculpin 2.18 Snailfish 1.96 Atlantic herring 2.05 Snakeblenny 1.89 Greenland halibut 1.89 Radiated shanny 1.82 Spatulate/Twohorn sculpin 1.87 Daubed shanny 1.67 American plaice 1.41 Atlantic cod 1.17
Shorthorn sculpin 1.4 CYT eggs 1.16
Larval species contributing to the de-cadal assemblage dissimilarities includ-ed the Arctic shanny (9.28%) and other species of the Stichaeidae family (i.e. snakeblenny and daubed shanny lar-vae contributed 7.8% of the total), sandlance (6.1%), snailfish (4.3%), ca-pelin (3.2%), redfish (2.9%), and Arctic staghorn sculpin (2.2%) (Table 6). Sandlance and redfish larval abun-dances were generally higher in the 1980s (Fig. 7A), although differences between decades were not significant for sandlance larvae (ANOVA, p > 0.05) (Table 7). In contrast, Stichaeidae lar-vae (i.e. Arctic shanny, snakeblenny, and daubed shanny) as well as snail-fish larvae were more abundant in the Table 7. One-way ANOVA of species abundance differences (identified by the
SIMPER test) that contributed most to the dissimilarities between decades and sampling times. *Significant results (p < 0.05)
Species Decade Sampling time
F p F p
CHW eggs 256.631 < 0.001* 13.377 < 0.001* H4B eggs 12.378 < 0.001* 9.345 0.002* American plaice eggs 11.534 0.001* 13.391 < 0.001* Fourbeard rockling eggs 0.001 0.977 26.731 < 0.001* Atlantic cod eggs 53.864 < 0.001* 383.221 < 0.001* Sandlance larvae 0.116 0.733 0.512 0.474 Redfish larvae 26.322 < 0.001* 197.984 < 0.001* Arctic shanny larvae 27.835 < 0.001* 23.305 < 0.001* Daubed shanny larvae 17.463 < 0.001* 1.878 0.171 Snakeblenny larvae 6.952 0.009* 11.294 0.001* Snailfish larvae 15.686 < 0.001* 0.096 0.757 Arctic staghorn sculpin 3.368 0.067 0.058 0.81 Capelin 13.368 < 0.001* 21.485 < 0.001*
Fig. 5. Mean (± SE) (A) abundance of CHW, H4B, and American plaice eggs and (B) fourbeard rockling and Atlantic cod eggs ordered according to the median sampling day of the year for each decade (1980s, 2000s). CHW: cod, haddock, and witch
2000s than in the 1980s (ANOVA, p < 0.05; Table 7, Fig. 7B). Maximum abundances of capelin were re-corded in the 1980s (more precisely, in May 1986 and in May 1987), and ANOVA were significant for both decadal and sampling time differences. Unlike Atlan-tic herring larvae, whose contribution to decadal dis-similarity came from a high abundance at one station
in the 1980s, a higher number of capelin larvae were more evenly distributed across the entire sampled area in both decades. The contribution of Arctic staghorn sculpin larvae (high abundance in May 2005 as op-posed to the relatively smaller abundances recorded in all other cruises) to the decadal differences were not significant (ANOVA; Table 7, Fig. 8). Greenland
but Reinhardtius hippoglossoides larvae were only found in the 2000s cruises and contributed a small pro-portion (1.9%) to the decadal assemblage differences (Fig. 8). However, a few (4) larvae were caught in the 1980s cruises but were not considered because they were found outside the study area.
Fish eggs also contributed strongly to the sampling time dissimilarities. The SIMPER analysis identified American plaice eggs as the main contributor (14.6%) to the sampling time assemblage differences (Table 6). Other important contributors included CHW eggs (8.8%), Atlantic cod eggs (8.2%), and fourbeard rock-ling eggs (7.1%). CHW eggs were more abundant in May, whereas Atlantic cod and fourbeard rockling eggs were more abundant in June (Fig. 5). Among the larval species that contributed the most to sampling time dissimilarities were redfish (12.5%), sandlance (7.0%), American plaice (4.7%), and capelin (3.2%) (Table 6). Larval Stichaeidae contributed 10.1% to sampling time dissimilarities (with a contribution of
4.8% for Arctic shanny larvae). June communities had higher abundances of redfish and American plaice larvae than May communities (ANOVAs, p < 0.05; Table 7), with maxima being recorded in June 1985 for redfish larvae and in June 1986 and June 2006 for American plaice larvae (Figs. 7A & 8). Higher abun-dances of sandlance, capelin, and Stichaeidae larvae were found for May cruises (Figs. 7 & 8), and ANOVA were significant for capelin, Arctic shanny, and snake-blenny (Table 7). However, ANOVA for sampling time differences were not significant for sandlance and daubed shanny (Table 7).
Temperatures
Mean temperatures of the upper layer for each cruise are presented in Table 1. On average, water temperatures were higher in the 2000s than in the 1980s. May and June 2006 had the highest mean
tem-Fig. 7. Mean (± SE) abundance of (A) sandlance and redfish larvae and (B) Stichaeidae and snailfish larvae ordered according to the median sampling day of the year for each decade (1980s, 2000s)
peratures for the May and June cruises, respectively. The lowest mean temperatures were recorded for May 1986 in the 1980s and May 2005 for the 2000s.
DISCUSSION
The spring ichthyoplankton community composition in the Gulf of St. Lawrence is closely related to time on different scales. Analyses revealed significant differ-ences between decades as well as between months within a given year. Since sampling took place in May and June, eggs and larvae of groundfish species, which spawn early in spring in the Gulf (de Lafontaine 1979, Scott & Scott 1988), made up most of the ichthyo-plankton.
Decadal differences
The significant assemblage differences between decades that were revealed by multivariate and uni-variate tests confirmed that the ichthyoplankton com-munity structure of the northwest Gulf has changed over time. These decadal differences reflect important changes in the relative contribution of early life stages of commercial species, especially CHW, American plaice, and Atlantic cod eggs as well as redfish larvae. The Atlantic cod and redfish collapsed in the early 1990s in the Northwest Atlantic. As a result, the cod fishery in the northern Gulf was closed from 1994 to 1996 and has not yet recovered (Shelton et al. 2006). The annual bottom trawl survey conducted by the Department of Fisheries and Oceans, Canada (DFO),
has recorded abundance fluctuations of fish species in the northern Gulf since 1990. Among the most abun-dant species in survey catches are commercial species such as the Atlantic cod, redfish, American plaice, Greenland halibut, and other small-bodied species such as herring and capelin. With the exception of Greenland halibut, groundfish predators showed a general declining trend in abundance over time, with a more pronounced decline in redfish and Atlantic cod (Savenkoff et al. 2007). These trends are in agreement with our results. Ichthyoplankton data show decreases in abundance of over an order of magnitude between the 1980s and the 2000s for CHW eggs and Atlantic cod eggs and for redfish larvae. American plaice egg abundances decreased significantly as well, although less drastically. In addition, Greenland halibut larvae were present in larger proportion in the study area in the 2000s, which is consistent with the biomass in-crease of this species as revealed by research surveys (Savenkoff et al. 2007).
Interestingly, most non-commercial small demersal fishes occurred in higher abundance in the 2000s sam-ples. The exception was sandlance, whose abundance did not change significantly between decades. The non-commercial fish larvae that were present in higher abundances in recent cruises were mainly from the Stichaeidae family (mostly the Arctic shanny), snail-fishes, and the H4B group. The H4B group included eggs of gadids and merlucciid hakes, rocklings, butter-fish Peprilus triacanthus, windowpane Scophthalmus aquosus and Gulf Stream flounder Citharichthys arc-tifrons (Markle & Frost 1985). Many Gadidae are regu-larly caught in the annual groundfish survey as well as Merlucciidae (mostly silver hake Merluccius bilinearis) Fig. 8. Mean (± SE) abundance of Arctic staghorn sculpin, capelin, American plaice, and Greenland halibut larvae ordered
(Dutil et al. 2006). Although the spawning time is not well known for these species in the Gulf, white hake Urophycis tenuis has been reported to spawn starting in late spring in other regions of the North Atlantic, whereas fourbeard rockling seems to have an earlier spawning time (Scott & Scott 1988). H4B eggs that could be identified to the species level were all fourbeard rockling, suggesting that H4B eggs could almost all be fourbeard rockling eggs. Similarly, given the historical dominance of cod in the Gulf of St. Lawrence, the influence of the CHW group in the com-munity difference is most likely the result of cod eggs by themselves. Therefore, 2 sources of variation (i.e. cod eggs and larvae) are considered to be of different origins (i.e. different species) in the analyses. The diffi-culty of identifying H4B and CHW eggs to the species level remains an obstacle to a more precise community description as well as a limitation for the nMDS. Indeed, group level identification reduces the number of egg taxa. Therefore, 2 cruises have a greater chance of sharing a similar species composition. This creates very small within-group dissimilarities compared to between-group dissimilarities. The geometric distribu-tion of the nMDS based on egg data only could result from such a disjunction in the data, where some cruises are too similar to others in terms of abundance and species composition, making the signal of a possible factor effect hard to detect by the nMDS in the 2-dimensional configuration.
In contrast, 1-way ANOSIM and 2-way PER-MANOVA were able to detect the effect of both factors (i.e. decade and sampling time) in the case of tests based on egg data only. This was not the case for tests based on larval data only due to the low number of replicate samples and the consequent low number of possible permutations. This was especially true for the ANOSIM R-values, which, although high, could not achieve the 5% significance level in some cases and decreased the power of the test. PERMANOVA were not affected by the low degrees of freedom resulting from the small number of possible permutations since the pseudo-F values were large enough to be signifi-cant at 5%. PERMANOVA is more powerful than ANOSIM because it makes more assumptions in more complex designs (it fits the full linear additive model to the distance matrix) and is a semi-parametric test (Anderson 2005). ANOSIM, which is purely nonpara-metric, is more robust. The use of both tests together was successful in identifying differences in the ichthy-oplankton community between decades and between sampling times.
Stichaeidae, snailfish, fourbeard rockling (and other species whose eggs are included in the H4B group), and sandlance are potential forage species for ground-fish predators such as cod, redground-fish, and Greenland
hal-ibut. In the North Atlantic, it has been suggested that the collapse of the cod, and the subsequent lower pre-dation pressure from this species had a positive effect on shrimp, capelin, and herring abundance (Worm & Myers 2003). A recent study in the southern Gulf that examined marine fish species composition from 1971 to 2005 found that small-bodied demersal fishes increased in abundance following the decline of the large piscivorous fishes (Benoît & Swain 2008). The collapse of the cod and other large predators in the northern Gulf induced a regime shift from an ecosys-tem that is dominated by large demersal fishes and small-bodied forage species to one that is dominated by small-bodied forage species (Savenkoff et al. 2007). However, evidence of an increase in abundance fol-lowing the decline of large predators was inconclusive for pelagic species. Capelin larvae caught in the 1980s were large, and although our results indicate signifi-cantly lower numbers in the 2000s, the bongo net does not adequately sample such large larvae; hence, our results neither support nor undermine trophic cascade hypotheses involving increases in pelagic fishes (Frank et al. 2005).
The decadal increase in the early life stages of the non-commercial species that was observed in this study likely reflects a higher abundance of adults that in turn could be a consequence of the decline of their predators. This result suggests a release from predator control, as reported by Frank et al. (2006) for the north-ern regions of the Northwest Atlantic including the northwest Gulf, which are low productivity ecosystems that tend to be top-down regulated.
An alternative explanation for these changes in the community could be that changes in the environmental conditions, or changes in water mass characteristics, e.g. temperature conditions at the bottom, which affect growth, egg maturation, and spawning time, recently favoured small-bodied demersal fishes. Unfortunately, temperature data that were available in this study were too limited to allow investigation of spatial and temporal associations between ichthyoplankton spe-cies and physical variables at a fine scale (no data for June 1985, no CTD data for May and June 2006). These data were instead used only as an indicator of changes in environmental conditions that might influ-ence the ichthyoplankton community. Moreover, our objective was to examine changes that may have occurred in the ichthyoplankton over time in relation to the documented changes in the Gulf ecosystem. An overview of the oceanographic conditions in the Gulf of St. Lawrence is produced annually by the DFO. For some physical oceanographic components (e.g. water temperatures, ice cover), the time series go back to the mid 1970s (Galbraith et al. 2009). Over that period, the average water temperature in the deep layer (300 m) in
our study area shows no clear long-term trend. With the exception of 2 yr of strong negative anomalies in 1990 and 1991, the average deep-water temperature north of Anticosti Island was similar between the 2 periods investigated (Galbraith et al. 2009). For the water layer between 150 and 300 m, the cooling of the water masses that was observed between 1990 and 1995 was more severe; however, conditions have returned to normal since the late 1990s, and the aver-age temperatures between 2005 and 2007 were similar to temperatures between 1985 and 1987. Hypoxic con-dition in the deep waters of the Gulf is another impor-tant factor that could affect demersal fish distribution and biology. Historical data show that oxygen concen-trations declined in the deep waters between the early 1970s and 1985 and remained low but stable at ~20% saturation since then; thus, oxygen concentrations were about the same for the 2 time periods considered. Overall, there is little support for the idea that changes in the physical environment played an important role in the observed shift in dominance within the ichthyo-plankton community.
Our sampling detected the same trends in abun-dance of eggs and larvae of groundfish predators as did the DFO annual research surveys. In addition to information on commercial species, ichthyoplankton sampling provides information on non-commercial species. This represents an additional advantage of this study, since the trawl used in the annual bottom trawl surveys in the northern Gulf until 2003 could not efficiently sample small fish species such as Stichaei-dae (Bourdages et al. 2007) and, therefore, population levels for these species cannot be estimated. In con-trast, the gear used in DFO’s annual research surveys in the southern Gulf was better able to capture small fish species. As a result, Benoît & Swain (2008) were able to detect the same upward trend in small demer-sals. Such similar observations from independent studies add credibility to ichthyoplankton sampling as a method to detect community structure changes over time.
Sampling time differences
Sampling time changes in community composition are expected at latitudes like that of the northern Gulf (de Lafontaine et al. 1984), where changes in commu-nity composition can occur rapidly with egg develop-ment and eventual hatching as the season progresses. Indeed, we observed interannual changes in commu-nity composition that were linked to different sampling times within the spring season, with significant differ-ences being revealed between the May and June as-semblages. Among the main contributors to these
dif-ferences were redfish larvae and fish eggs. Redfish lar-vae were more abundant in June cruises for both decades. The vast majority of eggs sampled were American plaice and the CHW and H4B groups. Our results showed that CHW eggs were more abundant later in the season, American plaice egg abundance was higher in May than in June, and larval abundance increased in June. For June cruises, a larger number of eggs could be identified to the species level (e.g. Atlantic cod and fourbeard rockling). The pigmenta-tion pattern of the more developed embryo allowed a greater level of precision in identification. A large pro-portion of fourbeard rockling eggs were present in the May 2006 egg assemblage, which is early in compari-son with the other cruises. The relatively warmer tem-peratures recorded in 2006 might have favored egg development, explaining the earlier appearance of the embryo. Other species have even earlier spawning times than the Atlantic cod and the American plaice: species of the Stichaeidae family and snailfish start spawning in winter (Scott & Scott 1988). This could ex-plain the higher abundance of larval Arctic shanny, daubed shanny, snakeblenny, and snailfishes as early as May. Arctic shanny larvae were present in greater abundance in June in the 1980s and in May in the 2000s. According to temperature data, the surface layer was colder in the 1980s than in the 2000s. Warmer conditions in May could also have influenced spawning time (later in the 1980s and earlier in the 2000s), development time, or early stage survival of these species.
CONCLUSION
The overall average ichthyoplankton abundance was higher in the 1980s than in the 2000s. Ichthyo-plankton community composition has also changed between the 2 decades, with a decrease in large fish predators due to overfishing and a resulting increase in small demersal fishes. The observed change in the ichthyoplankton community dominance is unlikely to be a response to a change in environmental condi-tions. Moreover, variations in the copepod communi-ties in the adjacent region of the northwest Gulf of St. Lawrence have been detected. Notably, Calanus hyperboreus and Microcalanus spp. significantly increased from 1997 to 2007 in the St. Lawrence estu-ary (S. Plourde, DFO, IML, pers. comm.). On the Scot-ian Shelf, the abundance of Calanus hyperboreus, which partly originate from the Gulf of St. Lawrence, increased in the early 1990s, then decreased after 1994 (Sameoto 2001). The response of fish populations to these ecosystem changes may differ among species. Food availability during the early stages is crucial for
recruitment success (Hjort 1914, Cushing 1990). In the southern Gulf of St. Lawrence, year-class strength of the Atlantic mackerel Scomber scombrus has been linked to a high production of the copepod nauplii that mackerel larvae selectively prey on (Castonguay et al. 2008). It would be interesting to extend this study to the zooplankton community and investigate the links between changes in copepod community structure and ichthyoplankton abundance in the northwest Gulf of St. Lawrence.
Acknowledgements. We thank L. van Guelpen from the
Atlantic Reference Centre for sharing his larval fish identifi-cation expertise; P. Archambault (Institut des sciences de la mer de Rimouski, QC, Canada), and especially K. R. Clarke (Plymouth Marine Laboratory, UK) for advice on multivariate analyses; and P. Allard, L. Beaulieu, F. Lussier, and J.-F. St-Pierre as well as crew members who participated in data collection aboard the vessels ‘Calanus II’, ‘Saint-Malo’, and ‘L’Échourie’ between 2005 and 2007. L. Devine’s comments as well as those of 3 anonymous referees improved the manu-script. A.O.V.B. was supported by DFO’s Fisheries Science Collaboration Program.
LITERATURE CITED
Anderson MJ (2005) PERMANOVA: a FORTRAN computer program for permutational multivariate analysis of vari-ance. Department of Statistics, University of Auckland Anderson MJ, Gorley RN, Clarke KR (2008) PERMANOVA+
for PRIMER: guide to software and statistical methods. PRIMER-E, Plymouth
Benoît HP, Swain DP (2008) Impacts of environmental change and direct and indirect harvesting effects on the dynamics of a marine fish community. Can J Fish Aquat Sci 65: 2088–2104
Blanchard JL, Dulvy NK, Jennings S, Ellis JR, Pinnegar JK, Tidd A, Kell LT (2005) Do climate and fishing influence size-based indicators of Celtic Sea fish community struc-ture? ICES J Mar Sci 62:405–411
Bourdages H, Savard L, Archambault D, Valois S (2007) Results from the August 2004 and 2005 comparative fish-ing experiments in the northern Gulf of St. Lawrence between the CCGS Alfred Needler and the CCGS Teleost. Can Tech Rep Fish Aquat Sci 2750
Castonguay M, Rollet C, Fréchet A, Gagnon P, Gilbert D, Brêthes JC (1999) Distribution changes of Atlantic cod (Gadus morhua L.) in the Northern Gulf of St. Lawrence in relation to an oceanic cooling. ICES J Mar Sci 56:333–344 Castonguay M, Plourde S, Robert D, Runge JA, Fortier L (2008) Copepod production drives recruitment in a marine fish. Can J Fish Aquat Sci 65:1528–1531
Chabot D, Claireaux G (2008) Environmental hypoxia as a metabolic constraint on fish: the case of Atlantic cod,
Gadus morhua. Mar Pollut Bull 57:287–294
Chabot D, Dutil JD (1999) Reduced growth of Atlantic cod in non-lethal hypoxic conditions. J Fish Biol 55:472–491 Chapin III FS, Zavaleta ES, Eviner VT, Naylor RL and others
(2000) Consequences of changing biodiversity. Nature 405:234–242
Clarke KR, Warwick RM (2001) Change in marine communi-ties: an approach to statistical analysis and interpretation, 2nd edn. PRIMER-E, Plymouth
Cushing DH (1990) Plankton production and year-class strength in fish populations: an update of the match/mis-match hypothesis. Adv Mar Biol 26:249–294
de Lafontaine Y (1979) Distribution spatio-temporelle de l’ichtyoplancton dans l’estuaire et le nord-ouest du golfe du Saint-Laurent. Thèse de Maîtrise en Sciences Océano-graphiques, Université du Québec à Rimouski
de Lafontaine Y, Sinclair M, Messieh SN, Lambert JD, El Sabh MI (1984) Structure océanographique et distribution spa-tio-temporelle d’oeufs et de larves de poissons dans l’estu-aire maritime et la partie ouest du golfe du Saint-Laurent. Sci Tech Eau 17:43–50
DFO (Department of Fisheries and Oceans) (2007) Ecologi-cally and biologiEcologi-cally significant areas (EBSA) in the Estu-ary and Gulf of St. Lawrence: identification and character-ization. DFO, Can Sci Advis Sec, Sci Advis Rep 2007/016 Drinkwater KF, Gilbert D (2004) Hydrographic variability in the waters of the Gulf of St. Lawrence, the Scotian Shelf and the eastern Gulf of Maine (NAFO Subarea 4) during 1991–2000. J Northwest Atl Fish Sci 34:85–101
Duffy JE, Stachowicz JJ (2006) Why biodiversity is important to oceanography: potential roles of genetics, species, and trophic diversity in pelagic ecosystem processes. Mar Ecol Prog Ser 311:179–189
Dutil JD, Lambert Y (2000) Natural mortality from poor condi-tion in Atlantic cod (Gadus morhua). Can J Fish Aquat Sci 57:826–836
Dutil JD, Miller R, Nozères C, Bernier B, Bernier D, Gascon D (2006) Révision des identifications de poissons faites lors des relevés scientifiques annuels d’évaluation de l’abon-dance des poissons de fond et de la crevette nordique dans l’estuaire et le nord du golf du Saint-Laurent. Rapp Manus Can Sci Halieut Aquat 2760
Fahay MP (2007) Early stages of fishes in the western North Atlantic Ocean (Davis Strait, Southern Greenland and Flemish Cap to Cape Hatteras). NAFO, Dartmouth, Nova Scotia
Frank KT, Petrie B, Choi JS, Leggett WC (2005) Trophic cas-cades in a formerly cod-dominated ecosystem. Science 308:1621–1623
Frank KT, Petrie B, Shackell NL, Choi JS (2006) Reconciling differences in trophic control in mid-latitude marine ecosystems. Ecol Lett 9:1096–1105
Galbraith PS, Pettipas RG, Chassé J, Gilbert D and others (2009) Physical oceanographic conditions in the Gulf of St. Lawrence in 2008. Can Sci Advis Sec, Res Doc 2009/14 Gilbert D, Pettigrew B (1997) Interannual variability (1948–
1994) of the CIL core temperature in the Gulf of St. Lawrence. Can J Fish Aquat Sci 54(Suppl. 1):51–57 Gilbert D, Sundby B, Gobeil C, Mucci A, Tremblay GH (2005)
A seventy-two-year record of diminishing deep-water oxygen in the St. Lawrence Estuary: the northwest Atlantic connection. Limnol Oceanogr 50:1654–1666 Grégoire F (2000) The Atlantic mackerel (Scomber scombrus
L.) of NAFO subareas 2 to 6. DFO, Can Stock Assess Secr, Res Doc 2000/021
Harvey M, St-Pierre JF (2002) Oceanographic conditions in the Estuary and the Gulf of St. Lawrence during 2001: zooplank-ton. DFO, Can Stock Assess Secr, Res Doc 2002/46 Hjort J (1914) Fluctuations in the great fisheries of northern
Europe viewed in light of biological research. Rapp P-V Reùn Cons Int Explor Mer 20:1–228
Hooper DU, Chapin FS, Ewel JJ, Hector A and others (2005) Effects of biodiversity on ecosystem functioning: a consen-sus of current knowledge. Ecol Monogr 75:3–35
Iles TD, Sinclair M (1982) Atlantic herring: stock discreteness and abundance. Science 215:627–633
➤
➤
➤
➤
➤
➤
➤
➤
➤
➤
➤
➤
➤
➤
➤
➤
➤
➤
➤
➤
Markle DF, Frost LA (1985) Comparative morphology, sea-sonality, and a key to planktonic fish eggs from the Nova Scotian shelf. Can J Zool 63:246–257
Ouellet P (1997) Characteristics and vertical distribution of Atlantic cod (Gadus morhua) eggs in the Northern Gulf of St. Lawrence, and the possible effect of cold water tem-perature on recruitment. Can J Fish Aquat Sci 54:211–223 Ouellet P (2007) Contribution to the identification of ecologi-cally and biologiecologi-cally significant areas (EBSA) for the Estuary and the Gulf of St. Lawrence: the fish eggs and larvae and crustacean decapods larvae layer. DFO, Can Sci Advis Sec, Res Doc 2007/011
Ouellet P, Lefaivre D, Koutitonsky V (1990) Distribution of shrimp (Pandalus borealis) larvae and hydrographic pat-tern in the Northern Gulf of St. Lawrence. Can J Fish Aquat Sci 47:2068–2078
Poulard JC, Blanchard F (2005) The impact of climate change on the fish community structure of the eastern continental shelf of the Bay of Biscay. ICES J Mar Sci 62:1436–1443 Richardson SL, Smith PE (1977) Standard techniques for
pelagic fish egg and larva surveys. FAO Fish Tech Pap 175 Sameoto D (2001) Decadal changes in phytoplankton color index and selected calanoid copepods in continuous plankton recorder data from the Scotian Shelf. Can J Fish Aquat Sci 58:749–761
Saucier FJ, Roy F, Gilbert D, Pellerin P, Ritchie H (2003) Mod-eling the formation and circulation processes of water masses and sea ice in the Gulf of St. Lawrence, Canada. J Geophys Res 108(C8):3269, doi:10.1029/2000JC000686
Savenkoff C, Castonguay M, Chabot D, Hammill MO, Bourdages H, Morissette L (2007) Changes in the northern Gulf of St. Lawrence ecosystem estimated by inverse mod-elling: evidence of a fishery-induced regime shift? Estuar Coast Shelf Sci 73:711–724
Saville A, Schnack D (1981) Some thoughts on the current sta-tus of studies of fish egg and larval distribution and abun-dance. Rapp P-V Reùn Cons Int Explor Mer 178:153–157 Scheffer M, Carpenter S, de Young B (2005) Cascading effects of overfishing marine systems. Trends Ecol Evol 20: 579–581
Scott WB, Scott MG (1988) Atlantic fishes of Canada. Can Bull Fish Aquat Sci 219
Shelton PA, Sinclair AF, Chouinard GA, Mohn R, Duplisea DE (2006) Fishing under low productivity conditions is further delaying recovery of Northwest Atlantic cod (Gadus
morhua). Can J Fish Aquat Sci 63:235–238
Sherman K, Lasker R, Richards W, Kendall AWJ (1984) Ichthyoplankton and fish recruitment studies in large marine ecosystems. Mar Fish Rev 45:1–25
Tilman D, Reich PB, Knops JMH (2006) Biodiversity and ecosystem stability in a decade-long grassland experi-ment. Nature 441:629–632
Worm B, Myers RA (2003) Meta-analysis of the cod –shrimp interaction reveals top-down control in oceanic food webs. Ecology 84:162–173
Worm B, Barbier EB, Beaumont N, Duffy JE and others (2006) Impacts of biodiversity loss on ocean ecosystem services. Science 314:787–790
Editorial responsibility: Alejandro Gallego, Aberdeen, UK
Submitted: October 23, 2009; Accepted: June 2, 2010 Proofs received from author(s): August 12, 2010
View publication stats View publication stats