Application of polymerization-based amplification
in point-of-care diagnostics
by MASS
Shefali Lathwal
M.S. Chemical Engineering Practice
Massachusetts Institute of Technology, 2013 M. Tech. Process Engineering and Design & B. Tech. Chemical Engineering (Dual Degree)
Indian Institute of Technology, Delhi, 2011
Submitted to the Department of Chemical Engineering in Partial Fulfillment of the Requirements for the Degree of
Doctor of Philosophy in Chemical Engineering at the
MASSACHUSETTS INSTITUTE OF TECHNOLOGY JUNE 2016
2016 Massachusetts Institute of Technology. All rights reserved.
I Signature of Author:... ACHUSETS INSTITUTE OF TECHNOLOGY
JUN 0 62016
IBRARIES
ARCHIVES
Signature redacted
...
Department of Chemical Engineering
M V11 2016
Signature redacted
C e rtifie d b y : ...
Hadley D. Sikes Assistant Professor of Chemical Engineering
/n A Thesis Supervisor
Accepted by:...
tSignature
redactedi
Richard D. Braatz Edward R. Gilliland Professor of Chemical Engineering Chairman, Committee for Graduate Students
Application of polymerization-based amplification in point-of-care diagnostics
by
Shefali Lathwal
Submitted to the Department of Chemical Engineering on May 11, 2016 in Partial Fulfillment of the Requirements for the Degree of
Doctor of Philosophy in Chemical Engineering
Abstract
Diagnostic tests in resource-limited settings require technologies that are affordable and easy-to-use with minimal infrastructure. Colorimetric detection methods that provide results that are readable by eye, without reliance on specialized and expensive equipment, have great utility in these settings. Existing colorimetric methods based on enzymatic reactions and gold nanoparticles often produce results that must be read within a specified time interval to ensure their validity. In many instances, a user has to wait several minutes for the color to develop. Moreover, the result can be interpreted incorrectly because of low visual contrast. Therefore, a colorimetric detection technology that produces bright and unambiguous readout within a time interval of a few seconds to less than two minutes, and removes the burden of accurate time keeping from the user can be very beneficial in low-resource settings.
Photo-initiated polymerization-based amplification (PBA) is a technology that allows detection of a surface-bound analyte through co-localization of a visible-light photoinitiator with the analyte present on the surface. In the presence of an appropriate dose of light and monomers, a subsequent free radical polymerization reaction results in formation of an interfacial hydrogel in areas where the initiator has been localized. In this thesis, we modified the eosin/tertiary amine-based PBA technology, which had previously been developed on transparent glass surfaces, for use with cellulose-based (paper) surfaces. Using Plasmodium falciparum histidine-rich protein as an example, we showed that paper-based PBA allowed high-contrast visual detection of proteins with a limit-of-detection of single digit nM concentration (-7 nM) in complex matrices such as human serum and plasma purified from blood samples through the use of a hand-operated microfluidic device. The paper-based immunoassay required only 10 pL sample per test and the total time for signal amplification, from illumination to colorimetric detection, was 2-2.5 minutes per test. The method provided quantitative information regarding analyte levels when combined with cellphone-based imaging. It also allowed decoupling of the capture of analyte on the surface from the signal amplification and visualization steps. We showed that in comparison with enzymatic amplification methods and silver deposition on gold nanoparticles, PBA-based readout on paper was cheaper, easier to perceive at its limit-of-detection, and had the lowest incidence of false readouts due to timing errors.
In addition to developing PBA for use in paper devices, we combined PBA with a dilution array approach for quantifying analyte levels by counting number of visible polymer spots on a biochip. We used an empirical design approach that did not depend
on measurement of equilibrium and kinetic binding parameters of the antibodies used in the assay and provided a dynamic range of three orders of magnitude, 70 pM to 70 nM, for visual quantification of the analyte. We also built a portable, light-weight, and customizable LED-based device with automated timer functionality for use with PBA assays in point-of-care settings.
Thesis Supervisor: Hadley D. Sikes
Acknowledgements
I would like to express my sincere thanks to everyone whose encouragement and
support made the work in this thesis possible.
First of all, I would like to thank my thesis advisor, Dr. Hadley Sikes, for giving me the opportunity to work on this project and for her encouragement, mentorship, and support throughout this work. She helped set up many collaborations that became integral to my work and guided me through the ups and downs that usually come with collaborations. I am very grateful that she also gave me valuable career advice and encouraged me to be ambitious. I would also like to thank my committee members Dr. Christopher Love and Dr. Michael Rubner for their feedback, encouragement, and for providing guidance that helped shape this thesis.
I thank Prof. G. M. Whitesides for his huge part in the paper-based PBA project and for
his boundless enthusiasm for solving global health problems. I learned something new in every interaction with him. Thank you to Dr. Abraham Badu-Tawiah with whom I worked closely for over a year. I would also like to thank Dr. Tatyana Shatova of Jensen lab whose microfluidic device allowed us to do validation with blood samples, and David Dellal and Jos6 Gomez-Marquez of the D-lab for helping us design a better illumination device for PBA.
I truly feel privileged to have known and worked with the past and current members of
the Sikes Lab. I want to thank Kaja Kaastrup for teaching me the ins and outs of polymerization, for her support, both professionally and in personal life, and for putting up with all the silly ordering questions and knowing where everything in the lab was! Brandon Heimer was the first person I met from the lab and I want to thank him for introducing me to the lab, for teaching me how to pipette properly, for helping me with countless experimental techniques, and for introducing me to WBUR. Kara Huang has always inspired me with her hard work and her straight-forward attitude; her feedback in group meetings has been extremely valuable and I want to thank her for being a wonderful friend and colleague. I would like to thank Joseph Lim for generously sharing half his bench when I started in the lab, for many amazing discussions about global health and life in general, and for rubbing off his enthusiasm for food on me. I want to thank Eric Miller for being my late night companion in the lab and for being my go-to person for bouncing ideas off of, Alan Aguirre Soto for being willing to discuss everything, work related or otherwise, and for being my coffee buddy, Brooke Tam for helping turn our office green and for making many days better with her baking, Kassi Stein for her very insightful critique of the work in group meetings, JiSam Wong for complementing the experimental work with his efforts in modeling the PBA system, and Troy Langford for helping with unfamiliar equipment in the lab. I would also like to acknowledge the newest members of the Sikes Lab, Emma Yee and Ki-Joo Sung, for continuing on the friendly and warm culture of the lab that I came to rely on.
I would also like to acknowledge my friends, Nikita Jain, Ritu Singh, Sohil Bhagat,
Ritika, Jyoti Singh, Aanchal Jain, Abhinav Prasoon, Nitin Sethiya, Manavi Abrol, Neha Chawla, and Palak Vij for keeping me in touch with life and world outside of graduate school during my time at MIT.
I would like to thank both my brothers, Amit Lathwal and Sumit Lathwal, for always
Sangwan for many interesting discussions related to my work and more, and Priyanka Sangwan for her support. My niece Milli (Anusha), and my nephews, Hanu (Ayush) and Mitthhu (Shaurya), always make me smile and bring joy in my life and for that I am truly grateful.
The acknowledgements would not be complete without mentioning my partner and my best friend, Gaurav Dhama, who not only stood by me across continents for more than five years, but also believed in me more than I would have thought possible. His belief, more than anything else, gave me the strength to keep pushing. Thank you, for making me smile when everything appeared to be going wrong and for your incredible patience. You bring me more happiness than I can ever express in words and you played a huge part in my being able to write this thesis today.
Lastly, I would not be here today without the support and love of my parents, Santosh Lathwal and Dr. Om Prakash Lathwal, and the sacrifices they have made. I feel incredibly privileged and proud to be their daughter and I am forever grateful for their constant encouragement and belief in me.
Table of Contents
A bstract... 3 Acknowledgements... 5 List of Figures... 11 List of Tables ... 15 Introduction... 171.1 Need for POC diagnostic tests... 19
1.1.1 Desirable characteristics in a POC diagnostic test... 20
1.1.2 Limitations of current colorimetric detection technologies in POC s e ttin g s ... . 2 0 1.2 Polymerization-based amplification as a sensing method in diagnostic te s ts ... . . 2 1 1.3 Eosin-tertiary amine-based PBA... 22
1.4 Transitioning to POC diagnostic tests with PBA ... 23
1.4 .1 T est surface ... . 23
1.4.2 Type of readout - qualitative/quantitative... 23
1.4.3 Portability of the light source ... 23
1.5 T hesis ove rview ... . 24
Polymerization-based signal amplification for paper-based assays ... 25
2 .1 A b stra ct... . . 2 7 2 .2 Introd uctio n ... . 2 9 2.3 Development of pH indicator-based readout ... 30
2.3.1 Phenolphthalein-based visualization ... 31
2.3.2 Thymolphthalein-based visualization... 32
2.4 Materials and methods for development and characterization of paper-based immunoassay for diagnosis of malaria ... 33
2 .4 .1 M ate ria ls ... . . 3 3 2.4.2 Preparation of aldehyde-functionalized paper... 33
2.4.3 Preparation of eosin-conjugated reporter antibody ... 35
2.4.4 Preparation of buffers and stock solutions ... 35
2.4.5 Capture of PfHRP2 on paper... 36
2.4.6 Detecting the presence of PfHRP2... 37
2.4.7 Fluorescence imaging ... 37
2.4.8 Polymerization-based amplification (PBA) on paper ... 38
2.4.9 Visualization and imaging of interfacial hydrogels on paper ... 38
2.4.11 Storage experiments ... 38
2.5 Results and discussion ... 40
2.5.1 Paper-based immunoassay for diagnosis of malaria57... .. .. .. ... . . 40
2.5.2 Optim ization of the im m unoassay ... 40
2.5.3 Lim it-of-detection ... 45
2.5.4 Detection of PfHRP2 in serum and blood sam ples ... 48
2.5.5 Storage experiments ... 49
2.5.6 Stability of color on paper after addition of NaOH for visualization .... 51
2.5.7 Effect of am bient light during imaging ... 52
2.6 Conclusions ... 55
Assessment of colorimetric amplification methods in a paper-based im m unoassay ... 57
3.1 Abstract... 59
3.2 Introduction ... 61
3.3 Materials and Methods... 64
3.3.1 Materials ... 64
3.3.2 Preparation of paper surfaces ... 64
3.3.3 Preparation of detection reagents ... 65
3.3.4 Im m unoassay ... 67
3.3.5 Generation of colorimetric results... 67
3.3.6 Imaging and image analysis... 68
3.4 Results and Discussion... 70
3.4.1 Effect of time on the appearance of color... 70
3.4.2 Implication of time-dependent colorimetric readout on test performance... 75
3.4.3 Lim it of detection ... 76
3.4.4 Quantifying ease-of-perception ... 78
3.5 Conclusions ... 81
A method for designing instrument-free quantitative immunoassays... 85
4.1 Abstract... 87
4.2 Introduction ... 89
4.3 Materials and Methods... 91
4.3.1 Materials ... 91
4.3.2 Preparation of test surfaces... 91
4.3.3 Preparation of eosin-conjugates... 92
4.3.5 Fluorescence im aging ... 93
4.3.6 Quantification of fluorescence intensity and curve fitting... 93
4.3.7 Polym erization-based am plification (PBA) ... 94
4.4 Results and Discussion... 95
4.4.1 The Concept: Using PBA with dilution arrays to quantify analytes... 95
4.4.2 The design approach... 96
4.4.3 Calibration curve for the capture antibody... 99
4.4.4 Initial layout with fluorescence readout... 100
4.4.5 Revised layout with colorim etric readout... 103
4.4.6 Com parison with visual quantification literature ... 105
4.5 Conclusions ... 107
Designing a portable light source for polymerization-based amplification.... 109
5 .1 A b s tra c t ... 1 1 1 5.2 Introduction ... 113
5.3 M ethods ... 114
5.3.1 Preparation of surfaces ... 114
5.3.2 Spotting biotinylated antibody... 114
5.4 Design of the device ... 115
5.4.1 General device architecture... 115
5.4.2 Analog circuit ... 115
5.4.3 Digital circuit ... 116
5.4.4 Characterization of the light source ... 116
5.4.5 Power source... 117
5 .4 .6 F ra m e ... 1 1 8 5.4.7 Perform ance in PBA ... 119
5.5. Discussion... 119
5.6 Conclusions ... 120
Conclusions and Future Directions... 121
6.1 Sum m ary... 123
6.1.1 Technology development for PBA in POC diagnostics ... 123
6.1.2 Clinical paper-based immunoassay for diagnosis of malaria ... 125
6.2 Future Research directions... 125
6.2.2 Paper-based nucleic-acid am plification tests ... 125
6.2.3 Exploration of alternative initiation chem istry ... 126
List of Figures
Figure 1-1: Description of steps in the diagnostic cycle after presentation of symptoms
by a patient and the effect of location of testing on time-to-diagnosis... 19
Figure 1-2: Examples of abnormalities in colorimetric readout for POC lateral flow immunoassays for malaria detection ... 21 Figure 1-3: Schematic of an immunoassay with detection based on
photopolymerization-based amplification... 22 Figure 1-4: Photoinitiator, coinitiator and monomers for polymerization-based
a m p lificatio n ... . . 2 2
Figure 2-1: Swelling the hydrogel with a dye solution on paper. ... 30
Figure 2-2: Positive and negative PBA readouts on paper using pH indicators, phenolphthalein and thymolphthalein ... 31
Figure 2-3: Equilibrium between colorless and pink isomers of phenolphthalein as a functio n of p H . ... . . 3 1
Figure 2-4: UV-visible absorption spectrum of aqueous amplification solution with (dashed line) and without (solid black line) pH adjustment. ... 32
Figure 2-5: Chemical structure of thymolphthalein... 32 Figure 2-6: Preparation of aldehyde-functionalized hydrophilic test zones on paper for
covalent immobilization of amine-containing molecules... 34 Figure 2-7: Characterization of aldehyde-functionalized paper using 2,4
dinitrophenylhydrazine (2,4-DNP) ... 34 Figure 2-8 Preparation and characterization of eosin-conjugated anti-PfHRP2 antibody.
... 3 6 Figure 2-9: Using a paper immunoassay and polymerization-based amplification to
detect P fH R P 2 ... . . 4 1
Figure 2-10: Varying the concentration and the incubation time of the capture antibody solution for im m unoassay on paper... 42 Figure 2-11: Varying the concentration and the incubation time of the eosin-conjugated
reporter antibody solution for immunoassay on paper. ... 43 Figure 2-12: Varying the incubation time of the sample containing PfHRP2 for
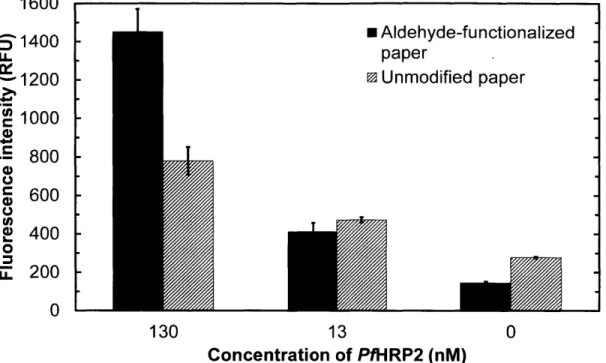
im m unoassay on paper.. ... 43 Figure 2-13: Mean fluorescence intensity values for the detection of PfHRP2 on
aldehyde-functionalized and unmodified chromatography paper. ... 44 Figure 2-14: Fluorescence intensity measurements for PfHRP2 detection on paper
using three different reporter antibody solutions with an average of 3.7, 7 and 15
Figure 2-15: Detection of PfHRP2 (0-130 nM) in a buffered solution by using polymerization-based amplification on paper. (A) Representative images of the colorimetric results for detection of various concentrations of PfHRP2... 47 Figure 2-16: Colorimetric detection of PfHRP2 (0-130 nM) in human serum using
paper-ba se d P B A ... . . 4 8
Figure 2-17: Colorimetric detection of PfHRP2 (0-130 nM) in human blood using paper-base d P B A ... . . 4 9
Figure 2-18: Colorimetric detection of positive (130 nM PfHRP2) and negative (0 nM
PfHRP2) surfaces stored in air, at room temperature, in a closed drawer for 0-13 0 d a y s ... . . 5 0
Figure 2-19: Colorimetric detection of positive (130 nM PfHRP2) and negative (0 nM PfHRP2) surfaces stored in an oven at 45'C, and in a humid chamber and polymerized after the indicated number of days... 50 Figure 2-20: Colorimetric detection of positive (130 nM PfHRP2) and negative (0 nM
PfHRP2) after exposure to real-world environmental conditions... 51 Figure 2-21: Effect of lamination on the persistence of color for thick hydrogel films.
Images showing the colorimetric response for detection of 130 nM PfHRP2 on p a p e r... . . 5 2
Figure 2-22: Effect of lamination on the persistence of color for thin hydrogel films. 152 Figure 2-23: Effect of variability in lighting conditions during imaging on quantification of
co lo rim etric inte nsity. ... . . 54
Figure 2-24: Effect of standardizing lighting conditions with a desk lamp during imaging on quantification of colorimetric intensity... 55 Figure 3-1: Colorimetric sensing mechanisms in a sandwich immunoassay. ... 62
Figure 3-2: Schematic of the colorimetric sensing mechanisms tested in the study..63 Figure 3-3: UV-visible absorption spectrum of EITC conjugated to streptavidin (2.8 EITC
molecules per streptavidin molecule). ... 66
Figure 3-4: Preparation and characterization of biotinylated reporter antibody... 66 Figure 3-5: Time course for color generation on negative and the positive surfaces..71 Figure 3-6: Quantifying the percentage change in the colorimetric intensity of the
negative controls with time and the difference in intensities between the positive surfaces and negative surfaces... 72
Figure 3-7: Effect of exposure to ambient indoor light on self-nucleation of silver... 73 Figure 3-8: Surfaces tested with gold nanoparticles, with and without silver
a m p lifica tio n ... . . 7 3
Figure 3-9: Importance of illumination time in PBA. ... 75
Figure 3-11: Quantifying the colorimetric results for dilution series of all four colorimetric
am plification m ethods... 77
Figure 3-12: Using three different methods to report the change in intensity in RGB color space for surfaces tested with ALP-BCIP/NBT. ... 78
Figure 3-13: Quantification of perception near the limit-of-detection. For each colo rim etric m ethod ,... . 79
Figure 3-14: Effect of device on quantification of RGB images... 80
Figure 3-15: Imaging wet and dry surfaces. ... 80
Figure 3-16: Effect of hue and background color on visual perception.. ... 81
Figure 4-1: UV-visible absorption spectrum of EITC conjugated to streptavidin (3.2 EITC molecules per streptavidin molecule). ... 92
Figure 4-2: UV-visible absorption spectrum of EITC conjugated to capture antibody (4 EITC molecules per IgG molecule)... 93
Figure 4-3: Steps in the detection of an analyte using polymerization-based amplification (PBA) and the conceptual framework for using PBA to quantify analytes by counting spots ... 97
Figure 4-4: A schematic of the workflow for application of the visual quantification m ethod in a clinical assay... 98
Figure 4-5: Process of designing a biochip for visual quantification of analytes. ... 98
Figure 4-6: Determining the relationship between spotting solution concentration (nM) and the surface density (F, moles per pm2) of capture antibody molecules covalently coupled to activated agarose surfaces.. ... 100
Figure 4-7: Measurement of reversible, non-covalent binding curves to enable design of a biochip for maximal dynamic range.. ... 101
Figure 4-8: Measurement of threshold photoinitiator density in fluorescence units.. 103
Figure 4-9: Colorimetric readout obtained using PBA on biochip surfaces tested with four different concentrations of analyte, 70 pM, 700 pM, 7 nM, and 70 nM 105 Figure 5-1: Schematic of the device architecture for the low-cost device for illumination in P B A a s s a y s . ... 1 1 5 Figure 5-2: Analog circuit for manual operation of LEDs... 116
Figure 5-3: Digital circuit for automated operation of LED using an in-built timer.. 116
Figure 5-4 Characterization of the LED used to build the portable illumination source and its comparison with ampliPHOX reader... 117
Figure 5-5: Ratio of intensity of light when powered by a battery to the intensity of light w hen pow ered w ith an AC source... 118
Figure 5-6: Portable analog light device... 118
Figure 5-7: Front view of the initial prototype of the portable digital device with the attached LC D scree n ... 118
Figure 5-8: Comparison of polymerization readout obtained using AmpliPHOX, and H iP o w e r L E D . ... 1 1 9
List of Tables
Table 2-1: Procedure for quantification of colorimetric result using ImageJ... 39
Table 2-2: Calculated colorimetric intensity values for each concentration of PfHRP2 (n = 8 ).. ... . . 4 7
Table 3-1: Positive controls separated into red, green and blue channels... 69 Table 3-2: An example calculation of ACIE values from images of positive and negative
surfaces captured with a cellphone ... 70
Table 3-3: Cost contribution of different colorimetric methods per hundred tests .... 74 Table 3-4: Detailed cost of each reagent for different colorimetric methods ... 74 Table 3-5: A comparison of the main characteristics of different colorimetric methods82 Table 4-1: Fitted parameters for immobilization of capture antibody on the surfacel 00
Table 4-2: Fitted parameters for binding of 70 nM analyte to the capture molecules printed w ith initial layout on the biochip. ... 101
Table 4-3: Fitted parameters for binding of 7 nM analyte to the capture molecules printed w ith initial layout on the biochip. ... 101
Table 4-4: Fitted parameters for binding of 700 pM analyte to the capture molecules printed w ith initial layout on the biochip... 102 Table 4-5: Fitted parameters for binding of 70 pM analyte to the capture molecules
printed w ith initial layout on the biochip... 102 Table 4-6: Predicted spotting solution concentrations of capture antibody for a biochip
containing six positions and designed to differentiate between 70 pM, 700 pM, 7 nM, and 70 nM analyte concentrations in solution ... 104 Table 5-1: Initial cost estimates of the analog and digital prototypes... 120
Chapter 1:
1.1 Need for POC diagnostic tests
Infectious diseases are one of the leading causes of death in developing countries in the world.' This high burden of disease can be attributed to many factors including lack of access to healthcare systems and unaffordability of existing healthcare
2,3
infrastructure. In the infectious disease management cycle, diagnostic tests represent the first infrastructural challenge. In addition, the diagnostic cycle can take anywhere from a few hours to a few months depending on the disease and the diagnostic test being used. Therefore, technologies that lower the cost of diagnostic tests, and allow these tests to be conducted closer to the point-of-care (POC) with a faster time-to-result have the potential to be extremely impactful in improving health outcomes in resource-limited settings. Fig. 1-1 shows the time-scale and typical steps involved in diagnostic testing in a clinical laboratory and the impact of using POC tests in reducing time-to-diagnosis.4 Patient Physician Test requet Interpretation i. I D),;pecilhst) I clinical sam piing
Laboratory report
-Km
Clinical (presumptive) diagnosis
Spmesent toOn-site analysis
molecular microbiology O-ieaayi
laboratory Rapid POC diagnostics (molecular diagnostics) Faster healthcare decision 1-24 hours 4-' laboratory Quality control and validation Test tegisiaton conrrnat on of result 24+ h Microbiology 1$+ h testing
Figure 1-1: Description of steps in the diagnostic cycle after presentation of symptoms by a patient and the effect of location of testing on time-to-diagnosis. (Reproduced from Bissonnette, L. and Bergeron, M.G., JPM, 2012, 2(2), 50-70; doi:10.3390/jpm2020050 under the terms and conditions of the Creative Commons Attribution license.)
I
Time 0 h 1h 6 h -UJ1.1.1 Desirable characteristics in a POC diagnostic test
Several characteristics have been identified for a POC diagnostic test to be useful in resource-limited settings. The World Health organization (WHO) has defined some of the ideal characteristics under the acronym ASSURED5:
- Affordable - Sensitive e Specific " User-friendly e Rapid time-to-result " Equipment-free
e Delivered to those who need it
The above characteristics only provide general guidelines for POC tests, while the specifics are usually defined according to the prevalence of the disease and the type of test - molecular, serological, etc.6'7 Lateral flow immunoassays are one of the most widely recognizable example of POC tests.8-10 These tests typically provide results through the presence or absence of a colored line that can be seen by the unaided eye. Visual, colorimetric interpretation of results is one of the key reasons for widespread use of these tests. Despite the success of lateral flow tests in certain markets such as pregnancy tests, their uptake in POC testing of infectious diseases has been limited.3 Some of the factors that limit the use of colorimetric tests in POC testing are discussed in the following section.
1.1.2 Limitations of current colorimetric detection technologies in POC settings
Colorimetric detection technologies are extremely useful in POC settings because they allow result interpretation without the requirement of additional infrastructure or equipment, which is one of the key characteristics of an ideal POC test. The most common technology used for producing colorimetric results in lateral flow tests uses gold nanoparticles conjugated to proteins.10 An example of different types of anomalies in the colorimetric readout using gold nanoparticles in lateral flow assays is shown in Fig. 1-2.11 Other technologies such as enzymatic amplification, which are widely used in laboratories, also find limited use in POC tests because of non-uniform color changes, susceptibility of readout to temperature, low visual contrast between positive and negative results,1 3 and dependence of color on the time of readout. Many colorimetric
POC tests require users to compare the results visually to a reference chart and/or to distinguish between shades of color,1 2 which introduces subjectivity in result
Red hii ckgrmn ii
Fi r .U 1l U
thAi cti Ar~
InripIair mrtion
LI~iIZ
EIPiii
rzza
LZ~ZIJ
EZ~IZ1
?Fasty~, tukut t r-t Iline-'Difts ttiiP Uhet
nc t ees in
!iwlb iiudu'A'
LIZZIE
LZZXI
Figure 1-2: Examples of abnormalities in colorimetric readout for POC lateral flow immunoassays for malaria detection (Reproduced with permission-from World Health Organization report, Malaria rapid diagnostic test performance: Summary results of WHO product testing of malaria RDTs: Round 1-5 (2008-2013) )
1.2 Polymerization-based amplification as a sensing method in diagnostic tests
Polymerization-based amplification is a signal amplification and detection method that can be used to grow interfacial polymer films through localization of initiator molecules on a surface1 4-31. Several polymerization chemistries such as atom-transfer radical polymerization,1 417''3' reversible addition-fragmentation chain transfer polymerization ,20 ,232 enzyme-mediated redox polymerization, 4 and photo-initiated
polymerization 5,16,19,21 22,25,27,29 have been used for polymerization-based amplification.
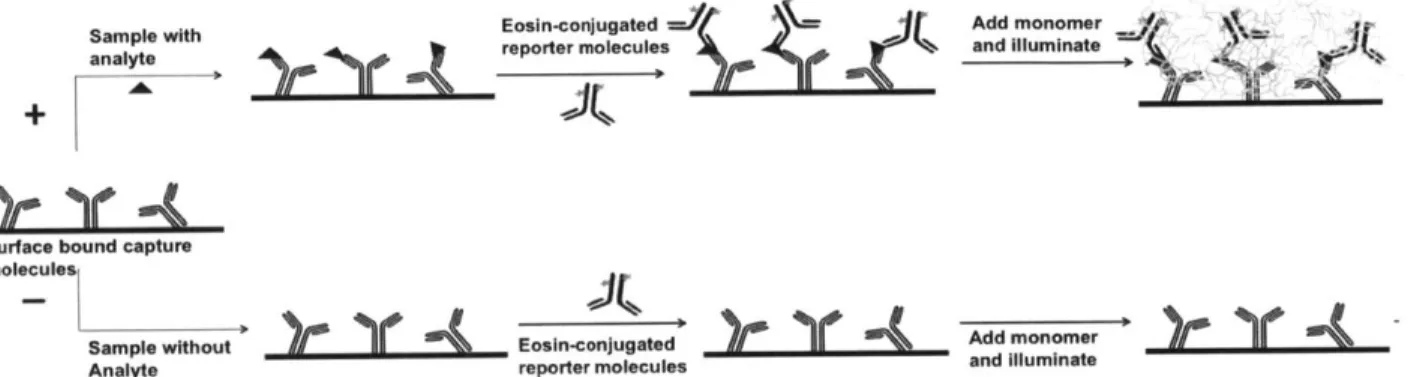
Out of these methods, photo-initiated methods have emerged as the most promising candidate for use in diagnostic tests because of several features that will be discussed in the following sections. In this document, the term polymerization-based amplification (PBA) is exclusively used to refer to photo-initiated polymerization reactions. The development and key characteristics of PBA have recently been reviewed.32 Briefly, PBA has been adapted for detection of specific biomolecules such as proteins28 and nucleic acids.303 In such assays, photoinitiators can be localized to regions where specific molecular binding events have occurred through covalent coupling of the photoinitiator to one of the affinity reagents used in the assay. When the photoinitiator molecules are supplied with an appropriate dose of light in the presence of acrylate monomers, they initiate a free-radical polymerization reaction to generate an interfacial hydrogel. The result of the polymerization process is the formation of a hydrogel only in areas where the local concentration of the photoinitiator near a binding surface is
sufficient to overcome competing inhibition reactions, and to initiate polymerization. An
Sampl withEosin-conjugated -j Add monomer A, t'
Sa with p orter lecules and illuminate
analyte rpre
Surface bound capture molecules
Sample without Y Eosin-conjugated Add monomer
Analyte reporter molecules and illuminate
Figure 1-3: Schematic of an immunoassay with detection based on photopolymerization-based amplification
1.3 Eosin-tertiary amine-based PBA
This section summarizes the current understanding of the mechanism for co-polymerization of the acrylate monomers, PEGDA and VP, using an eosin/tertiary amine photoinitiation system. The molecular structures of the reaction components are shown in Figure 1-4. A) Br Br B) HO 0 0 Br Br -OH C-OH 11 C) D) 0
KCH
2 0Figure 1-4: Photoinitiator, coinitiator and monomers for polymerization-based amplification
(A) eosin Y, (B) triethanolamine (TEA), (C) 1-vinyl-2-pyrrolidinone (VP), and (D) poly(ethylene glycol) diacrylate (PEGDA)
The use of xanthene dyes in photoinitiation systems has been studied extensively. 34-36 The eosin/tertiary amine photoinitiation system in particular has historically been used for the polymerization of acrylate monomers for encapsulation of cells.37 When irradiated with green light, the excited triplet state of eosin accepts an electron from
TEA. The TEA radical cation then loses a proton to generate the initiating TEA
radical.36,38 39 The initiating radical can then react with an acrylate monomer (PEGDA or VP) to generate a propagating polymer chain. The termination of the polymer chains can occur either through combination or disproportionation reactions between the radical ends of the growing polymer chains. The initiating radical or the radical terminus of a growing polymer chain can also react with the dissolved oxygen present in the system to generate less reactive peroxide radicals. The peroxide radicals are unreactive towards further propagation and thus terminate the growth of the polymer chains.4
Therefore, the free radical polymerization reactions in PBA were previously carried out under oxygen-free conditions by purging the system with an inert gas. However, Avens et al. recently proposed a mechanism by which a series of disproportionation termination reactions between the semi-reduced eosin radicals and peroxide radicals can cyclically regenerate eosin and the polymerization reaction can proceed in the presence of oxygen.41 This observation was used to develop a PBA system that is
capable of generating interfacial polymers without purging the system.29 This
eosin/tertiary system that could be used without purging was used as the basis for development of PBA technology for POC diagnostic tests in this work. It should be noted that the reaction kinetics and the precise reaction mechanism of the eosin-based polymerization reaction in the presence of oxygen is still under active investigation. 4 4
1.4 Transitioning to POC diagnostic tests with PBA
The eosin-based PBA system has several characteristics that make it suitable for use in POC diagnostic tests:
1. Use of commodity chemicals that are inexpensive and stable under ambient
conditions.
2. Use of visible LED-based light for photoinitiation reaction
3. Formation of interfacial hydrogel that can be visualized with the unaided eye
4. Demonstrated adaptability with many different sample types
5. Polymerization under ambient conditions, without purging 6. Rapid polymerization time (seconds to minutes)
Despite these advantages, several technological barriers had to be overcome in taking the eosin-tertiary amine based PBA system from laboratory to point-of-care settings as discussed in the following sections.
1.4.1 Test surface
The majority of PBA work had previously been done on glass-based surfaces, primarily self-assembled monolayer modified glass surfaces. These surfaces were expensive and fragile. Therefore, an inexpensive surface was needed for PBA-based POC tests.
1.4.2 Type of readout - qualitative/quantitative
Several different readout methods such as profilometry, fluorescence, and colorimetric detection had previously been used with PBA. Of the above methods, colorimetric readout was compatible with diagnostic tests in low-resource settings as a qualitative yes/no method. Since many diagnostic tests require quantitative results for making clinical decision, the use of PBA for quantitative readout in POC settings needed to be evaluated.
1.4.3 Portability of the light source
The LED light source used for the recent work in PBA was AmpliPHOX Reader, which is manufactured commercially by InDevR and costs approximately $5000. Therefore, a
portable and low-cost light source was one of the essential requirements for translation of PBA technology to POC settings.
1.5 Thesis overview
PBA has the potential to address the limitations of colorimetric detection technologies that are currently used in POC diagnostic tests. Therefore, the aim of this thesis was to modify and adapt the existing eosin/tertiary amine-based PBA system for use with diagnostic tests at POC, to identify and improve aspects of PBA technology that make it easier to interpret results from the perspective of an untrained user of a POC device, and to demonstrate the utility of a PBA-based test for a clinically relevant analyte that is a biomarker for an infectious disease. We also wanted to explore the potential of using the threshold nature of PBA to obtain quantitative results without additional imaging. This thesis is organized into six chapters. The first chapter provides an overview of the need for developing POC diagnostic tests for infectious diseases and specifically focuses on the current technologies to general colorimetric results in immunoassays. The chapter also provides brief background of polymerization-based amplification technology and advantages and challenges for integration with POC diagnostic technologies. Chapter 2 describes the development of visualization method for PBA on paper-surfaces and development of a paper-based immunoassay for detection of malaria using the newly developed paper-based PBA. Chapter 3 describes a side-by-side rigorous comparison of PBA with existing methods for generating colorimetric results on paper devices, namely silver deposition, catalyzed by gold-nanoparticles and enzymatic amplification. This chapter highlights the importance of defining visual limit-of-detection as well as the importance of reporting the kinetics of color development of colorimetric technologies that are designed for use in field settings. Chapter 4 discusses the development of a general method for visually quantifying the amount of analyte in a sample by counting number of spots. Chapter 5 discusses the design of a low-cost and portable light source that can be used in field-assays for PBA. Finally, Chapter 6 summarizes the main results of the thesis and lays out scope for future research.
Chapter 2:
Polymerization-based signal amplification for
paper-based assays
2.1 Abstract
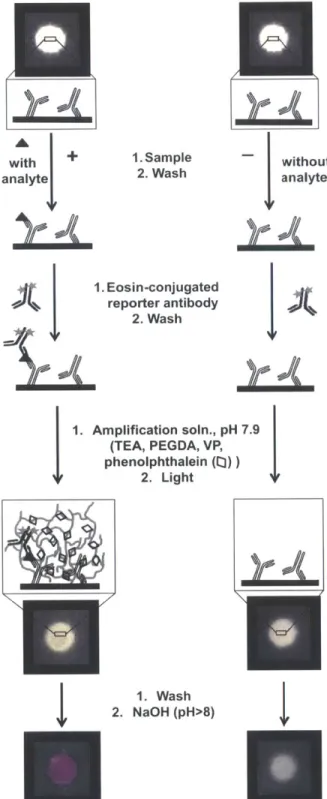
Diagnostic tests in resource-limited settings require technologies that are affordable and easy to use with minimal infrastructure. Colorimetric detection methods that produce results that are readable by eye, without reliance on specialized and expensive equipment, have great utility in these settings. We report a colorimetric method that integrates a paper-based immunoassay with a rapid, visible-light-induced polymerization to provide high visual contrast between a positive and a negative result. Using Plasmodium falciparum histidine-rich protein 2 as an example, we demonstrate that this method allows visual detection of proteins in complex matrices such as human serum and provides quantitative information regarding analyte levels when combined with cellphone-based imaging. It also allows the user to decouple the capture of analyte from signal amplification and visualization steps.
Parts of this chapter have been adapted or reprinted from:
Badu-Tawiah, A.K.,* Lathwal, S.,* Kaastrup, K., AI-Sayah, M., Christodouleas, D.C., Smith, B.S., Whitesides, G.M., and Sikes, H.D. Polymerization-based signal amplification for paper-based immunoassays, Lab on a Chip, 2015, 15 (3): 655-659. Shatova, T.A., Lathwal, S., Engle, M.R., Sikes, H.D., and Jensen, K.F., Portable, constriction-expansion blood plasma separation and polymerization-based malaria detection, In revision (Analytical Chemistry)
2.2 Introduction
Analytical devices made of cellulosic materials (e.g. filter and chromatography paper) are attractive for resource-limited settings (RLS) because of their low cost,45-47 ease of fabrication,47 and porous structure that facilitates capillary flow. 2D and 3D microfluidic paper-based analytical devices (pPADs) have been developed and used for detection of small molecules,46 metals,48 and proteins. 3 45'46 A crucial component of an analytical
test is the mechanism that allows users to read out the results of a test. A wide range of visualization mechanisms are available for use with paper surfaces,49 but POC tests in RLS are constrained by cost and limited infrastructure. Colorimetric methods based on enzymatic reactions or gold nanoparticles (AuNP) are, therefore, widely used in paper-based POC tests because they provide an equipment-free readout.49 These methods sometimes produce low visual contrast between a positive and a negative result13,50 that
leads to subjectivity in interpretation of the result by the user, along with decreases in accuracy and sensitivity. Color development after capture of the analyte from a patient sample by a bioactive cellulose surface can require intervals from 30 minutes for enzymatic reactions51 to 20-30 minutes for AuNP-based sensing with silver enhancement13 and can give a false negative result if read prematurely. These tests can also give a false positive result if read a few minutes after a specified end time.52 The
motivation for this work was to develop a polymerization-based colorimetric sensing method for use with paper immunoassays to address these limitations of existing colorimetric methods.
A polymerization response can be coupled to detection of an analyte using a method
termed polymerization-based amplification (PBA).15,16,27,29 In PBA, photoinitiators are
localized to regions where specific molecular binding events have occurred through covalent coupling of the photoinitiator to one of the affinity reagents used in the assay. When the photoinitiator molecules are supplied with an appropriate dose of light in the presence of acrylate monomers, they initiate a free-radical polymerization reaction to generate an interfacial hydrogel. The result of the polymerization process is the formation of a hydrogel only in areas where the local concentration of the photoinitiator near a binding surface is sufficient to overcome competing inhibition reactions, and to initiate polymerization. PBA is rapid with a reaction time of less than 100 seconds and can be performed in air, without the need for oxygen removal via purging,29 by using an eosin/tertiary amine initiation system that can overcome oxygen inhibition through an eosin regeneration mechanism.4 1 The reactants and key elementary reactions in the
overall polymerization reaction are described briefly in Section 1.3 and by Wong et al. PBA was previously developed using bioactive glass surfaces and the colorless hydrogel was swollen with a dye solution to aid visualization by eye.27,29 However, the
swelling method could not be used with paper because dyes adhere non-specifically to paper. This non-specific adhesion led to low contrast between the hydrogel and the background (Fig. 2-1). In this work, we have adapted PBA to detect molecular binding events on a paper surface. We developed a new visualization method by using the
pH-dependent color change of a pH indicator to detect the formation of the hydrogel. We have successfully used this polymerization method to generate colorimetric results, easily perceptible to the unaided eye, for the immune-detection of Plasmodium falciparum histidine-rich protein 2 (PfHRP2) on modified chromatography paper. PfHRP2 is a soluble protein released into the blood stream during infection by Plasmodium falciparum. It is a well-established biomarker for falciparum infection and several commercial diagnostic tests are based on its detection.
A) Paper surface with hydrogel B) Paper surface without hydrogel
Figure 2-1: Swelling the hydrogel with a dye solution on paper. Visualization on paper (A) with hydrogel, and (B) without hydrogel, by swelling with a dye solution. The dye solution adheres non-specifically to paper, thus the colorimetric result is similar regardless of the presence of the hydrogel.
2.3 Development of pH indicator-based readout
In order to visualize the presence of hydrogel on paper surfaces, we developed a pH-indicator based method. We modified the amplification solution by adding a pH pH-indicator to the solution prior to polymerization. As the pH-indicator-containing amplification solution is illuminated with light and hydrogel forms, the pH indicator gets physically trapped in the cross linked network. Once a hydrogel is formed on the surface, an acidic or basic solution can be added to induce a pH change causing a change in the color of the pH indicator. We tested various pH indicators and identified certain key characteristics for a pH indicator to be compatible as a visualization agent for paper-based PBA:
- The pH indicator should be soluble in the aqueous solution in a concentration (0 -100 pM - 1 mM) that is high enough to obtain a bright color visible to the
unaided eye.
* At the concentrations required to obtain bright color change, the pH indicator should cause minimal interference with the photoinitiation and polymerization chemistry prior to and during the illumination period. Ideally, this condition implies that the pH indicator should be colorless in the aqueous amplification solution and should have minimal interactions with other components present in the solution.
We found two different pH indicators, phenolphthalein and thymolphthalein, that satisfied the above criteria and used them to generate pink and blue colorimetric
Phenolohthalein hymolphthaloir Positive
r eadout
Negative readou t
Figure 2-2: Positive and negative PBA readouts on paper using pH indicators, phenolphthalein and thymolphthalein.
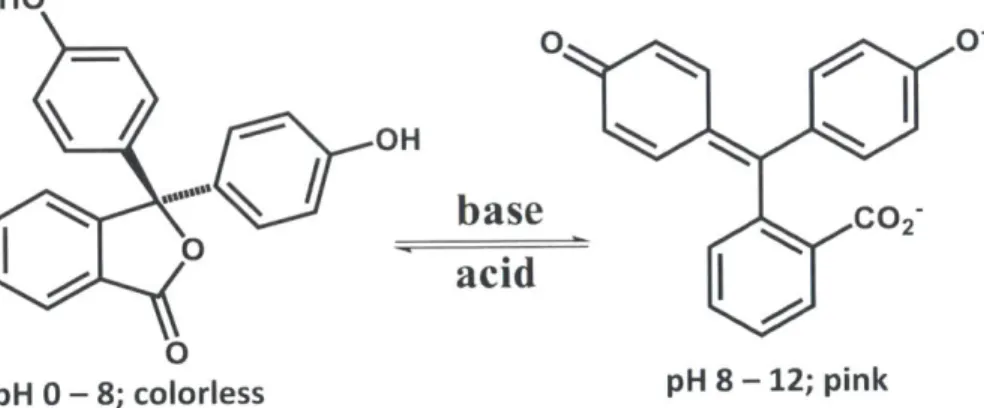
2.3.1 Phenolphthalein-based visualization
Phenolphthalein, a weak acid, is colorless at a pH less than 8. As the pH increases above 8, the equilibrium shifts in favor of the pink dianionic form (Figure 2-3). The amplification solution used for phenolphthalein-based PBA readout (Figure 2-2) consisted of 150 mM triethanolamine (TEA), 200 mM (poly)ethyleneglycol diacrylate
(PEGDA), 100 mM 1-vinyl-2-pyrrolidinone (VP), 1.6 mM phenolphthalein, 0.35 pM free
eosin, 20 mM hydrochloric acid (HCI) and 10 v/v% ethanol. The addition of HCl was essential for successful and reproducible polymerization in this system.
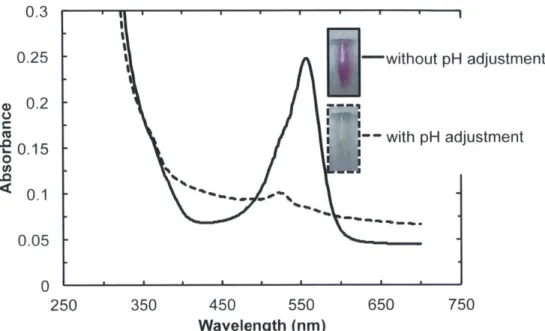
The amplification solution without HCI is basic with a pH of 9.3 because of the presence of TEA. If phenolphthalein is added to the amplification solution without pH adjustment, it is predominantly present in its dianionic state that absorbs strongly at the excitation wavelength of eosin, and thus competes with eosin for absorption of light during the initiation step. Therefore, HCI was added to adjust the pH of the solution to 7.9. At this
pH, phenolphthalein is present in its acidic, colorless form and does not interfere with
the absorption of light by eosin. We confirmed the state of phenolphthalein before and after adjustment of the pH using UV-visible spectroscopy (Fig. 2-4). The concentration of phenolphthalein added to the solution was maximized within the limits of solubility to provide an intense colorimetric response.
HO OH
base
C02 0 _acid
0 pH 0 - 8; colorless pH 8 - 12; pinkFigure 2-3: Equilibrium between colorless and pink isomers of phenolphthalein as a function of pH.
i-witho I---. -with __J 0.25 0.2 0.15 0 0. 1 0.05 0 250 I ut pH adjustment pH 650 adjustment 750
Figure 2-4: UV-visible absorption spectrum of aqueous amplification solution and without (solid black line) pH adjustment.
with (dashed line)
2.3.2 Thymolphthalein-based visualization
Thymolphthalein is colorless at a pH less than 9.3 and blue at higher pH It belongs to the same family as phenolphthalein but has additional alkyl side chains (Fig. 2-5) that lower its solubility in aqueous solutions compared to phenolphthalein. Therefore, to incorporate sufficiently high concentration of thymolphthalein in the aquesous amplification solution, the amount of PEGDA and ethanol were increased. The amplification solution used for thymolphthalein-based PBA readout (Figure 2-2) consisted of 150 mM triethanolamine (TEA), 400 mM (poly)ethyleneglycol diacrylate
(PEGDA), 100 mM 1-vinyl-2-pyrrolidinone (VP), 0.9 mM thymolphthalein, 0.5 pM free
eosin, 20 mM hydrochloric acid (HCI) and 20 v/v% ethanol.
HO oH
Figure 2-5: Chemical structure of thymolphthalein
0.3
450 550 Wavelength (nm) 350
2.4 Materials and methods for development and characterization of paper-based immunoassay for diagnosis of malaria
2.4.1 Materials
Whatman No. 1 chromatography paper, Iyophilized bovine serum albumin (BSA) and glycerol were purchased from VWR (Radnor, PA, USA). Gel blot paper (GB003, 15 cm
x 20 cm) was obtained from Whatman, Inc. (Sanford, ME, USA). Potassium periodate,
poly(ethylene glycol) diacrylate (Mn=575) (PEGDA), triethanolamine (TEA), 1-vinyl-2-pyrrolidinone (VP), eosin Y disodium salt, 2,4-dinitrophenylhydrazine, 1oX phosphate buffered saline (PBS), phenolphthalein, Tween@ 20 and sterile-filtered US-origin human serum (from human male AB plasma) were purchased from Sigma Aldrich (St. Louis, MO, USA) and used without further purification. Eosin 5-isothiocyanate (EITC) was
purchased from Marker Gene Technology (Eugene, OR, USA).
Tris(hydroxymethyl)aminomethane (Tris) and sodium chloride were purchased via VWR from Avantor Performance Materials (Center Valley, PA, USA), respectively. Lyophilized Plasmodium falciparum histidine-rich protein 2 (PfHRP2) was purchased from CTK Biotech (San Diego, CA, USA). The anti-PfHRP2 IgG monoclonal antibodies (capture and reporter) were purchased from Arista Biologicals Inc. (Allentown, PA,
USA). ABMAL-0444 (Clone 44) was used as the capture antibody and ABMAL-0445
(Clone 45) was used as the reporter antibody. UltraCruZTM Micro G-25 Spin Columns were purchased from Santa Cruz Biotechnology, Inc. (Santa Cruz, CA, USA) and PD-10 Desalting Columns were purchased from GE Healthcare Bio-Sciences (Pittsburgh, PA,
USA).
2.4.2 Preparation of aldehyde-functionalized paper
Paper with aldehyde functional groups was prepared by soaking sheets (3" x 8") of
Whatman No. 1 chromatography paper in a 0.03 M K104 solution at 65 C for 2 hours
(Fig. 2-6A).54 After the reaction, the sheets were washed three times by dipping them in fresh deionized water (diH2O) for one minute each and pouring off the water at the end. After the last wash had been poured out, the sheets were blotted with paper towels and dried in a desiccator for at least 12 hours. Each dry sheet was taped to a regular 8" x
11'" A4 printing paper and a wax mask containing circular wax-free regions (3 mm in
diameter) was printed on them using a solid ink printer set to the default parameters for photo-quality printing. The A4 paper was removed and the printed sheets were placed in an oven (150 0C) for 90 seconds. As a result of the heat, the wax melted and spread
through the thickness of the paper55 and created circular (2 mm in diameter) hydrophilic test zones separated by hydrophobic wax barriers(Fig. 2-6B). The presence of the aldehyde groups in the test zones allowed us to covalently immobilize amine-containing molecules (such as the anti-PfHRP2 capture antibody in this study) to the surface of the paper through a Schiff-base linkage (Fig. 2-6C). The presence of the aldehyde groups in the test zones was confirmed by adding 2 pL of 2,4-dinitrophenylhydrazine and observing the change in color from yellow to orange (Fig. 2-7). The sheets of aldehyde-functionalized paper were stored in a desiccator until use.
A) 0.03 M K104, 65 0C, 2 h El B) wax printing C) H 2N r OH OH HO 0 00 O HO OH OHH CH HC-7, 0 H O OH H 1 OOH O r OH CH HC-7-- 0 0 0 HO OH
Figure 2-6: Preparation of aldehyde-functionalized hydrophilic test zones on paper for covalent immobilization of amine-containing molecules. (A) An aqueous solution of potassium periodate was used to selectively oxidize the C2-C3 vicinal hydroxyl groups in the glucose unit of cellulose to give a dialdehyde product (aldehyde-functionalized paper). (B) The modified paper was printed with wax and heated to create hydrophilic test zones surrounded by hydrophobic wax barriers. (C) Amine groups on a molecule (e.g. amine groups of the lysine residues of an antibody) can form a Schiff base linkage with the aldehyde groups to covalently immobilize the molecules on the surface of the paper.
(A) Colorimetric test for carbonyl compounds
NO2 NO2 0 R N2H W + NO2-O NHNH2 -. NO2 'C NHN( aldehyde 2,4-dinitrophenylhydrazine Yellow 2,4-dinitrophenylhydrazone Orange
(B) Confirmation of functionalization of paper using 2.4-dinitrophenylhydrazine
Unmodified paper Yellow
Aldehyde-functionalized paper Orange
Figure 2-7: Characterization of aldehyde-functionalized paper using 2,4 dinitrophenylhydrazine (2,4-DNP). (A) Schematic of the reaction of 2,4-DNP with an aldehyde moiety of the aldehyde-functionalized paper. (B) Results after unmodified and aldehyde-aldehyde-functionalized paper are reacted with 2,4-DNP. Aldehyde-functionalized paper reacts to give a deep orange color and unmodified
2.4.3 Preparation of eosin-conjugated reporter antibody
The method of conjugation of EITC to proteins has been described previously.16,29The final protocol for conjugating eosin to the anti-PfHRP2 reporter antibody in the immunoassay is described below. EITC (1 mg) was dissolved in 100 pL of DMSO. 20
pL of the above solution was mixed with a 400 pL solution (5.3 mg/mL) of the reporter
antibody in 0.1 M sodium bicarbonate buffer (pH 9.0) to give a total reaction volume of 420 pL. The reaction mixture was protected from light and placed at 4 C for five hours. During the reaction, the isothiocyanate functional group of EITC reacts with the amine group of the lysine residues of the antibody to form a thiourea bond (Fig. 2-8A). At the end of the reaction, the excess EITC was separated from the eosin-conjugated reporter antibody by size-exclusion columns with a Sephadex matrix (PD-10 Desalting Column and Micro G-25 Spin-Column).
UV-visible absorbance spectroscopy was used to determine the average number of eosin molecules coupled to each reporter antibody molecule by taking an absorbance scan of the eosin-conjugated reporter antibody (Fig. 2-8B) and using the following equation:
nEITC/fRep.Ab. - (Abs525EEITC,52 5)/[tAbs2 80 - (Abs52s5EEITC,2801EEITC,525)l/ERep.Ab,280] where nEITCiS the number of molecules of eosin, nRep.Abis the number of molecules of the reporter antibody, Abs280and Abs525 are the measured absorbance values at 280
nm and 525 nm, respectively, EEITC,525 = 90,200 M-1cm-', EEITC,280 = 26,800 M-1cm-1 and
ERep.Ab,280 = 280,200 M-1cm1. The purified and characterized eosin-conjugated reporter antibody, containing an average of 7 eosin molecules per reporter antibody molecules, was diluted to make 50% v/v glycerol stock and stored in 10 pL aliquots at -20 C until use. The conjugation reaction protocol was obtained by optimizing the total reaction time and the molar ratio of eosin to the reporter antibody in the reaction mixture to obtain the desired number of eosin molecules per reporter antibody molecule.
2.4.4 Preparation of buffers and stock solutions
100 mL of 1oX PBS was diluted with 900 mL of diH20 to make 1X PBS solution. 1 g
BSA was dissolved in 100 mL of 1X PBS to make a 1%w/v BSA solution (1% PBSA).
3.025 g Tris and 4.28 g NaCl were added to 450 mL diH20 and the pH was adjusted to
7.5 by adding 2N HCI to give a 50 mM Tris-CI solution (1X TBS). 1 mg lyophilized PfHRP2 was dissolved in 200 pL of 2% PBSA to get 64 pM (5 mg mL-1) stock solution.
1.5 pL aliquots of the above solution were stored at -80 0C. The capture antibody, as
Br Br HO 0 0 Br Br C -OH S=C=N 330 Br Br HO 0 ' Br Br C -OH 0 R-HN-C-NH s1 S 430 530 Wavelength (nm) 630
Figure 2-8 Preparation and characterization of eosin-conjugated anti-PfHRP2 antibody. (A) Schematic of the reaction between an isothiocyanate group on eosin 5-isothiocyanate and an amine group of a lysine residue of the reporter antibody to form a thiourea bond. (B) A typical UV-visible absorption spectrum for purified, eosin-conjugated anti-PfHRP2 reporter antibody.
2.4.5 Capture of PfHRP2 on paper
The hydrophilic test zones of the aldehyde-functionalized paper were used for the detection of PfHRP2 using a sandwich immunoassay. For ease-of-use, strips of paper containing four test zones each (2.8 cm x 1.5 cm) were cut from the sheets of the
oxidized chromatography paper. We used a flow-through system5 1 where both the top and the bottom surfaces of the test zones were open to the atmosphere. Therefore, during the incubation steps, the paper strips had to be suspended in air to prevent wicking of the solutions from the test zone. This layout was accomplished by placing each end of a paper strip on the lid of a 0.5 ml centrifuge tube that was fitted inside the frame of an empty pipette-tip box. Each tube extended upwards from the frame and created a raised support for the paper strip. The test zones on each paper strip were thus completely suspended in air between two supports. Multiple centrifuge tubes were fitted into one pipette-tip box to enable simultaneous incubation of 10 strips of paper (40 test zones) in every box. The boxes were kept humid by partially filling them with diH20 and keeping their lids closed during the incubation steps. The test zones to be prepared for the immunoassay were placed on supports, as described above, inside a humid
A) R -NH 2 + B) 0.4 Eosin Antibody+eosin absorbance absorbance (525nm) -(280nm) 0.3 9 0.2 .0 0.1 0 230
pipette-tip box. A stock solution of the capture antibody was diluted to 67 pM (1 mg/ml) using 1X PBS and glycerol was added to a final concentration of 10%v/v. 2 pL of the above solution was added to each test zone and incubated overnight. After the incubation, the remaining solution of the capture antibody on the surface was wicked by bringing the bottom of the test zone in contact with a blotting paper. Each test zone was then washed with 40 pL of 1X PBS (two washes of 20 pL each (2 x 20pL)) by adding
the wash solution to the top of the test zone and pressing the bottom surface against a blotting paper to wick the solution. To block the excess aldehyde groups against non-specific binding of proteins, each test zone was then incubated with 10 pL of 1X TBS in a humid pipette-tip box. The excess solution was wicked on the blotting paper and the test zones were washed with 40 pL of 1X PBS (2 x 20 pL). Following the wash, 10 pL
solution of PfHRP2 (prepared in either 1% PBSA or human serum) was pipetted on a test zone and incubated in a humid pipette-tip box for 30 minutes. For experiments in buffer, PfHRP2 solutions were prepared by adding 1 pL stock solution of PfHRP2 to 499
pL of 1% PBSA to make a 130 nM solution - the highest concentration used in the
experiments. The 130 nM solution was diluted further with 1% PBSA to get the lower concentrations. For experiments in human serum, the solutions were prepared as above using undiluted serum instead of PBSA. For negative control, a test zone was incubated with 10 pL of either 1% PBSA or undiluted human serum, without any PfHRP2, for the same duration. At the end of the incubation, the excess solution was wicked on a blotting paper and each test zone was washed with 40 pL of 1X PBS (2 x 20 pL).
2.4.6 Detecting the presence of PtHRP2
A 330 nM (50 pg/mL) solution of the eosin conjugated reporter antibody (with 7 eosin
molecules per antibody) was prepared using 1% PBSA. Each test zone that was contacted with a sample (with or without PfHRP2) was incubated with 5 pL of the above solution in a humid pipette-tip box covered in foil for 30 minutes. At the end, the excess solution was wicked and each test zone was washed sequentially with PBST (1X PBS, 0.1%v/v Tween-20) (1 x 20 pL), 1X PBS (1 x 20 pL) and diH20 (1 x 20 pL). The presence of PfHRP2 was detected by measuring the fluorescence of eosin, followed by polymerization-based amplification.
2.4.7 Fluorescence imaging
Fluorescence microscopy was used to detect the presence of eosin on the surface of the paper during the development of the immunoassay. Each test zone was imaged using an Olympus IX81 microscope with a 4X objective lens, a 1OX eyepiece lens, and a Semrock TxRed-4040C filter set using an exposure time of one second. Lumen 200 with a Prior Lumen Bulb (Item #P-LM200BI) was used as the source of light. The mean fluorescence intensity of each test zone was calculated by averaging the constituent pixel intensities using ImageJ (a public domain, Java-based image processing software).