Any correspondence concerning this service should be sent
to the repository administrator: [email protected]
This is an author’s version published in:
http://oatao.univ-toulouse.fr/22384
Official URL
https://trec.nist.gov/pubs/trec26/papers/IRIT2-RT.pdf
Open Archive Toulouse Archive Ouverte
OATAO is an open access repository that collects the work of Toulouse
researchers and makes it freely available over the web where possible
To cite this version: Hubert, Gilles and Moreno, José and
Pinel-Sauvagnat, Karen and Pitarch, Yoann Some thoughts from IRIT about the
scenario A of the TREC RTS 2016 and 2017 tracks. (2017) In: 26th Text
REtrieval Conference (TREC 2017), 15 November 2017 - 17 November
2017 (Gaithersburg, Maryland, United States).
Some thoughts from IRIT about the scenario A of the
TREC RTS 2016 and 2017 tracks
⋆Gilles Hubert, Jose G. Moreno, Karen Pinel-Sauvagnat and Yoann Pitarch {gilles.hubert, jose.moreno, karen.sauvagnat, yoann.pitarch}@irit.fr,
Universit´e de Toulouse UPS-IRIT, 118 route de Narbonne F- 31062 Toulouse cedex 9
Abstract. The TREC Real-Time Summarization (RTS) track provides a framework for evaluating systems monitoring the Twitter stream and pushing tweets to users according to given profiles. It includes metrics, files, settings and hypothesis provided by the organizers. In this work, we perform a thorough analysis of each component of the framework used for batch evaluation of scenario A in 2016 and 2017. We found some weaknesses of the metrics and took advantage of these limitations to submit our official run in the 2017 edition. The good evaluation results validate our findings. This paper also gives clear recommendations to fairly reuse the collection.
1
Introduction
A common usage of Twitter is to watch other users’ tweets and never post anything. This usage scenario considers Twitter as a real time information source by scanning incessantly the tweet stream. The users adopting this usage aim to catch new (information they did not hear about before), fresh (information that appeared very recently) and precise (information that concerns them) information. There is growing interest in systems that could address these issues by providing information that satisfy this type of users with respect to their information needs.
The TREC campaign took an interest in the evaluation of such systems through various tracks and notably the ongoing Real-Time Summarization (RTS) track. As usual in infor-mation retrieval and evaluation campaigns, the researchers who tackle the issues on which focuses a track test their approaches using the framework provided for the track during the campaign period. Many researchers also test their solutions using the framework after the campaign period.
Our participations to these successive tracks have motivated a thorough analysis of the provided evaluation frameworks. This paper presents our main findings about the batch evalu-ation of the scenario A of the 2016 and 2017 benchmarks. On the one hand, it highlights some limitations of the provided evaluation framework with respect to the organizers’ settings. On the other hand, it identifies precautions to take when reusing the evaluation framework af-ter the campaign period. Leaving aside these precautions would lead to erroneous evaluation results and invalidate conclusions on system performance.
The remainder of this paper is organized as follows. Section 2 presents an overview of the TREC RTS track while Section 3 describes the metrics defined for the evaluations of systems corresponding to the track scenario A. The limitations highlighted on the evaluation framework are discussed in Sections 5 and 6. Section 8 introduces the precautions to take to obtain valid results when reusing the evaluation framework after the TREC campaign. Finally, Section 9 concludes the paper.
⋆This is an extended version of our paper ”Everything You Always Wanted to Know About TREC RTS* (*But Were Afraid to Ask)” [3].
2
Overview of the TREC RTS Scenario A
Introduced in 2016 and continued in 2017, the RTS track merges some previous TREC tracks: the Microblog (MB) track ran from 2010 to 2015 and the Temporal Summarization (TS) track run from 2013 to 2015. It intends to promote the development of systems that automatically monitor a document stream to keep the user up-to-date on topics of interest, by proposing a framework to evaluate such systems. The track considers two scenarios: scenario A – Push notifications – and scenario B – Email digest. The scenario A corresponds to the systems intended to send immediately the posts identified as relevant. The scenario B corresponds to systems intended to send once a day a summarization of the relevant posts of the day. This paper sheds some light on the evaluation framework defined for the scenario A.
Table 1: Statistics of scenario A in 2016 and 2017. Times are provided in UTC in order to have fixed time intervals regardless the participant location.
Year Evaluation period # judged topics # competitors 2016 From 02/08/2016 00:00:00 to 11/08/2016 23:59:59 56 41 2017 From 29/07/2017 00:00:00 to 05/08/2017 23:59:59 97 41
Each participant to the task must process a publicly accessible sample provided by Twitter which corresponds to the 1 % of the total available tweets. The evaluation period is partitioned in days, making 8 or 10 days long the evaluation window. To identify relevant tweets, a set of profiles is provided. Each profile (called topic in the TREC jargon) is composed of a title, a description and a narrative of the interest profiles. Table 1 provides some statistics about the 2016 and 2017 tasks. Each system must push at most 10 tweets per profile per day to a central system called the broker. Note that silence of a system is a desired effect when there are no relevant tweets during a day.
Two ways of evaluation were performed: online judgments and batch judgments. The earlier was performed during the evaluation period and the latter was performed once the challenge was over. Some works studied these two ways of evaluation and showed they are correlated [8, 10]. This work is interested only in the latter due to the reusability problems already identified in the earlier one [9]. In order to perform the batch judgments, a pool of tweets was built using all the pushed tweets in both scenarios A and B. The combined set of tweets was annotated following a two-step methodology. Given a tweet, assessors first assigned a relevance score. In all editions of this task, three levels of relevance (not relevant, relevant and very relevant) were considered. However without loss of generality, we consider only two levels of relevance to simplify our study, i.e., relevant tweets are considered as very relevant. Then, a unique cluster1 was assigned to each relevant tweet. A tweet is considered
relevant if its content is related to one profile. The clusters were found following the Tweet Timeline Generation (TTG) approach [11] which takes into account the creation timestamp to sort relevant tweets. Tweets are examined one per one traveling from past to future. A new cluster is created if the current tweet content is substantially dissimilar to all the previous tweets seen. All clusters are then considered equally important in the evaluation metrics.
3
Metrics
The RTS track in its guidelines asks for effectiveness (tweet quality) and efficiency (no la-tency). As participant systems might favour effectiveness or efficiency depending on their
1
approaches, the organizers decided from 2016 to compute metrics for quality and latency separately [6].
3.1 Notations and Preliminary Definition
The notations used in this paper are summarized in Table 2.
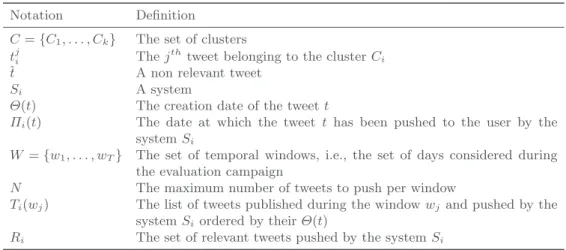
Table 2: Notations used throughout the paper Notation Definition
C= {C1, . . . , Ck} The set of clusters
tji The jthtweet belonging to the cluster Ci t A non relevant tweet
Si A system
Θ(t) The creation date of the tweet t
Πi(t) The date at which the tweet t has been pushed to the user by the system Si
W = {w1, . . . , wT} The set of temporal windows, i.e., the set of days considered during the evaluation campaign
N The maximum number of tweets to push per window
Ti(wj) The list of tweets published during the window wjand pushed by the system Si ordered by their Θ(t)
Ri The set of relevant tweets pushed by the system Si
A key concept for all the metrics is how relevance is defined. A tweet is considered as relevant for a system Si if it satisfies two criteria: it is contained in a relevant cluster and
it is the first tweet returned by Si for this cluster. Once a tweet from a cluster has been
retrieved, all the other tweets from the same cluster are redundant and automatically become not relevant [4]. This implies that the relevance of a tweet is system-dependent.
3.2 Gain-Oriented Metrics
Gain. The three metrics proposed to evaluate quality are based on the concept of gain, i.e., the usefulness of a tweet in the list of the tweets pushed by the system. The way the gain is evaluated is thus decisive. Given a time window wj and Ti(wj), i.e., the tweets returned by
the system Si published during wj, the gain G(wj, Si) is evaluated as follows:
G(Si, wj) =
X
t∈Ti(wj)
g(t) (1)
where g(t) is the gain of the tweet t: g(t) = 1 if the tweet is relevant, g(t) = 0 otherwise, i.e., t is non relevant or redundant. It should be noted that this definition has been clarified from [1, 6] by specifying that the tweets considered during wj are picked using Θ(t) rather than
Πi(t). We now detail the official metrics that rely on the gain.
Expected gain. The expected gain metric, denoted by EG, is adapted from [2]. Given a time window wj, it is evaluated as:
EG(wj, Si) =
1 |Ti(wj)|
where |Ti(wj)| is the number of tweets returned by Si and published during wj.
An important question about this metric is how to score systems during the so-called silent days, i.e., the days where no relevant tweets are published. Some variants of the EG metric have been introduced differing on how the silent days are considered:
– EG-0 in which systems receive a gain of 0 during the silent days no matter the tweets they returned.
– EG-1 in which systems receive a gain of 1 during the silent days when they do not return any tweet published during the day, 0 otherwise. It should be noted that this definition has been slightly extended from [6] to perfectly fit with the evaluation tool. This will be further discussed in Section 5.
– EG-p in which the proportion of tweets returned during a silent day is considered: a system receives a score of N−|t|N , where |t| is the number of non-relevant tweets published during the day and returned by the system. For instance, if a system pushes one tweet published during the day but not relevant (instead of 0), it gets a score of 0.9; two non-relevant tweets imply a score of 0.8, etc. Similarly to EG-1, this definition has been slightly extended.
The way the silent days are considered is crucial, since a huge impact of silent vs. eventful days is observed in the evaluation [10].
Normalized Cumulative Gain. Given a time window wj, the nCG metric is evaluated as
follows:
nCG(wj, Si) =
1
Z · G(Si, wj) (3) Z is the maximum possible gain (given the N tweets per day limit). As for EG, three variants are considered regarding how the silent days are taken into account: nCG-1, nCG-0, and nCG-p.
Gain Minus Pain. The GMP metric evaluates the utility of the run: GMP (Si, wj) = α
X
G(Si, wj) − (1 − α) · P (Si, wj) (4)
The gain Gain G(Si, wj) is computed in the same manner as above, the pain P (Si, wj) is
the number of non-relevant tweets published during wj and returned by the system Si, and α
controls the balance between the two. Three α settings were considered: 0.33, 0.50, and 0.66.
3.3 Latency-Oriented Metric The latency metric is defined as:
Latency(Sk) = X t(·)i ∈Rk Πk(t (·) i ) − Θ(t 1 i) (5)
where t(·)i is the oldest tweet pushed by the system Sk for the cluster Ci.
In other terms, latency is evaluated only for tweets contributing to the gain as the difference between the time a tweet was pushed and the first tweet in the semantic cluster that the tweet belongs to.
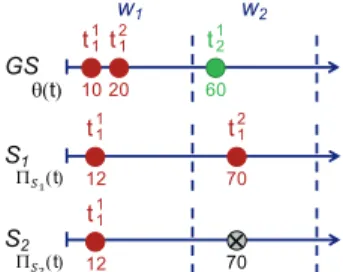
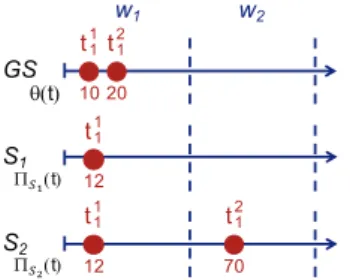
!" #" $" !%" #!" #&" !" θ(') %( #!"##" "# #" !# %" !)" #*" "$ !( *" !!( !$" !+" %$ %# %& %' %( '!! Π!"(') Π!#(') '#! '*! '!! ' # ! ' * ! ' ! # '!* '!& '!# '!* '!# '!* '*!
Fig. 1: Examples of runs retrieved by S1and S2as well as the associated ground truth (GS). In this
example, a time window wilasts 50 seconds.
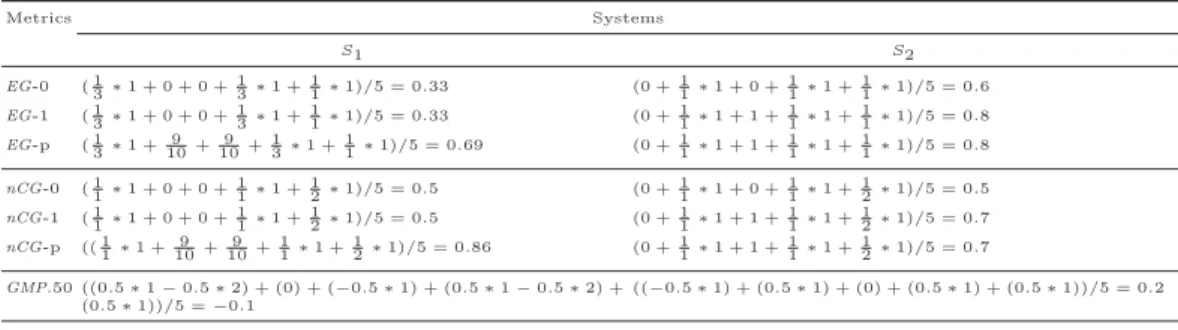
Table 3: Behaviours of the studied metrics with respect to the metrics.
Metrics Systems S1 S2 EG-0 ( 13 ∗1 + 0 + 0 + 13 ∗1 + 11 ∗1)/5 = 0.33 (0 + 11 ∗1 + 0 + 11 ∗1 + 11 ∗1)/5 = 0.6 EG-1 ( 13 ∗1 + 0 + 0 + 13 ∗1 + 11 ∗1)/5 = 0.33 (0 + 11 ∗1 + 1 + 11 ∗1 + 11 ∗1)/5 = 0.8 EG-p ( 13 ∗1 + 910+ 910+ 13 ∗1 + 11 ∗1)/5 = 0.69 (0 + 11 ∗1 + 1 + 11 ∗1 + 11 ∗1)/5 = 0.8 nCG-0 ( 11 ∗1 + 0 + 0 + 11 ∗1 + 12 ∗1)/5 = 0.5 (0 + 11 ∗1 + 0 + 11 ∗1 + 12 ∗1)/5 = 0.5 nCG-1 ( 11 ∗1 + 0 + 0 + 11 ∗1 + 12 ∗1)/5 = 0.5 (0 + 11 ∗1 + 1 + 11 ∗1 + 12 ∗1)/5 = 0.7 nCG-p (( 11 ∗1 + 910+ 910+ 11 ∗1 + 12 ∗1)/5 = 0.86 (0 + 11 ∗1 + 1 + 11 ∗1 + 12 ∗1)/5 = 0.7 GMP.50 ((0.5 ∗ 1 − 0.5 ∗ 2) + (0) + (−0.5 ∗ 1) + (0.5 ∗ 1 − 0.5 ∗ 2) + (0.5 ∗ 1))/5 = −0.1 ((−0.5 ∗ 1) + (0.5 ∗ 1) + (0) + (0.5 ∗ 1) + (0.5 ∗ 1))/5 = 0.2 Latency 2 + 10 + 20 = 32 65 + 40 + 10 = 115 3.4 Metrics Exemplifications
Fig. 1 and Table 3 run through some examples of systems and the way the official metrics are calculated. The results presented in Table 3 are decomposed and were checked using the 2016 and 2017 official evaluation tools of the track2.
In the EG family of metrics, the gain in a time window is divided by the number of tweets returned by the system and published during the time window. For instance and considering the system S1, the gain in the time window w1is divided by 3 while it is divided by 1 in w2.
In the nCG family of metrics, the gain in a time window is divided by the optimal gain. For
instance, in the time window w5the optimal gain is 2 (2 new clusters C3and C4), but neither
S1 nor S2 reach this optimal gain.
If we now consider the silent days, EG-1 and nCG-1 reward the systems for returning
no tweets, and strongly penalize them otherwise. For instance, S1 breaks the silence during
w3 and thus obtains a score of 0 for this window. The silent days can be different from one
system to another: S1 breaks the silence during w2 since t31 is not relevant in this case (the
C1 cluster has already been retrieved), whereas this is not the case for S2 for which C1 was
not retrieved at this time. Conversely, S1 and S2 receive a score of 0 for w3 considering the
EG-0 and nCG-0 metrics, whereas S2 has a perfect behavior during this window. Whatever
the systems return, the silent days are associated with a score of 0, and it never hurts to push
tweets. The “silent days effect” is lowered for the evaluation of EG-p et nCG-p: S1 receives
a score of 9/10 on w2 and w3 (whereas it receives a score of 0 for EG-0, nCG-0, EG-1, and
nCG-1 metrics).
2
Official evaluation tools are available at http://trec.nist.gov/data/rts2016.html (2016) and
For all the gain-oriented metrics, a tweet participates to the gain of the time window on which it was published (and not on which it was pushed by the systems). As a consequence, if we consider the system S2 and the window w5, the t12 tweet participates to the gain of
w4 (which is the window in which it was published). S2 has thus a non-zero score for w4
whereas it did not return any tweet. Another point to discuss relates to redundant tweets. As expected, t21 returned by S1 during w1 is considered as not relevant, only t11 participates to
the gain.
At last, the Latency metric is evaluated independently of the time windows as the differ-ence between the first tweet found in the cluster by the system and the publication date of the first tweet in the cluster in the gold standard. A side effect of this metric is that a perfect latency can be obtained without returning any relevant tweets.
3.5 Metric Integration in the Evaluation Framework
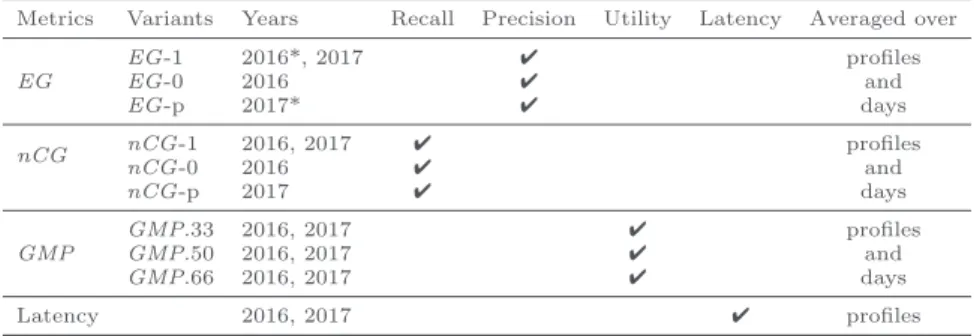
Table 4: Official metrics for the 2016 and 2017 tracks. The primary metric for each year is denoted with *.
Metrics Variants Years Recall Precision Utility Latency Averaged over EG EG-1 2016*, 2017 ✔ profiles EG-0 2016 ✔ and EG-p 2017* ✔ days nCG nCG-1 2016, 2017 ✔ profiles nCG-0 2016 ✔ and nCG-p 2017 ✔ days GMP GMP.33 2016, 2017 ✔ profiles GMP.50 2016, 2017 ✔ and GMP.66 2016, 2017 ✔ days Latency 2016, 2017 ✔ profiles
Table 4 provides additional information about the metrics. The EG metrics attempt to capture precision while the nCG ones are recall-oriented. The GMP metrics aim to fill the gap between these two contradictory objectives and thus represent a trade-off between precision and recall. As stated in [8], EG-0 and nCG-0 metrics are poorly formulated metrics and were thus abandoned in 2017. The gain-oriented metrics are computed for each interest profile and each window wj. The score for a competitor is the mean of the scores for each day over all the
profiles. Since each profile contains the same number of days, there is no distinction between micro- vs. macro-averages. The EG-1 and EG-p metrics were respectively considered as the official metrics in 2016 and 2017.
4
Hypotheses and Settings of the Evaluation Framework
The metric evaluation is based on two hypotheses assumed by the organizers. H1 – Redundant information is non relevant.As mentioned in [6]:
Once a tweet from a cluster is retrieved, all other tweets from the same cluster automatically become not relevant. This penalizes systems for returning redundant information.
H2 – A perfect daily score is obtained when silence is respected. As mentioned in [6]:
In the EG-1 and nCG-1 variants of the metrics, on a “silent day”, the system receives a score of one (i.e., perfect score) if it does not push any tweets, or zero otherwise. Note that since relevance is dependent, it implies that the silent days are system-dependent as well. Moreover, we would like to shed some light on two settings of the frame-work.
S1 – N = 10. This consists in forcing the systems to push a maximum of only 10 tweets per day and per profile. There is a twofold explanation for the value chosen for this parameter: first, to impose to the systems a realistic limit to the number of daily tweets that could be desired by a user and second, to impose a reasonable limit for the annotation phase.
S2 – Evaluation window. For the gain-oriented metrics, whatever the Πi(t) value for a
tweet, only Θ(t) is considered for the evaluation of G(·, ·) (see equation 1). In other terms, each returned tweet is sent back to its emission window. This can affect the systems that use buffering-based strategies as suggested by the guidelines. This setting is implicitly defined by the organizers since the latency metric is calculated separately from the main metrics.
5
Metrics Adequacy under RTS Hypotheses
We now refute the aforementioned hypotheses through 2 counterexamples.
H1.Considering the example of Fig. 2 and Table 5, the system S2 has higher scores than S1
on the EG metrics, whereas both return results supposed as equivalent (the first tweet of the
cluster C1 during w1 and respectively a redundant and non relevant tweet during w2). S1 is
more penalized for returning a redundant tweet than a non relevant one. This thus violates H1. !" #" !" θ($) "# %" !& %" "$ %$ %# &" !& Π!"($) Π!#($) $!& $!! $!! $!! $&! $&!
Fig. 2: Examples of runs retrieved
by S1 and S2 as well as the
asso-ciated ground truth (GS) with re-spect to H1. In this example, a time
window wilasts 50 seconds.
Metrics Systems S1 S2 EG-0 ( 12 ∗1 + 0)/2 = 0.25 ( 11 ∗1 + 0)/2 = 0.5 EG-1 ( 12 ∗1 + 0)/2 = 0.25 ( 11 ∗1 + 0)/2 = 0.5 EG-p ( 12 ∗1 + 0)/2 = 0.25 ( 11 ∗1 + 0)/2 = 0.5 nCG-0 ( 11 ∗1 + 11 ∗0)/2 = 0.5 ( 11 ∗1 + 0)/2 = 0.5 nCG-1 ( 11 ∗1 + 0)/2 = 0.5 ( 11 ∗1 + 0)/2 = 0.5 nCG-p ( 11 ∗1 + 0/2 = 0.5 ( 11 ∗1 + 0)/2 = 0.5 GMP.50 ((0.5 ∗ 1 − 0.5 ∗ 1) + (0))/2 = 0 ((0.5 ∗ 1) + (−0.5 ∗ 1))/2 = 0 Latency 2 2
Table 5: Behaviours of the studied metrics with respect to H1.
H2.Considering the example of Fig. 3 and Table 6, w2 is a silent day for both systems. S2
breaks the silence with t2
1 and however obtains a perfect score on this day, as S1 which did
!" !" θ(#) #$ #% $" #!!# $ ! "$ !$ Π!"(#) #!! !$ %" "% Π!#(#) #!! # $ !
Fig. 3: Examples of runs retrieved
by S1 and S2 as well as the
asso-ciated ground truth (GS) with re-spect to H2. In this example, a time
window wilasts 50 seconds.
Metrics Systems S1 S2 EG-0 ( 11 ∗1 + 0)/2 = 0.5 ( 12 ∗1 + 0)/2 = 0.25 EG-1 ( 11 ∗1 + 1)/2 = 1 ( 12 ∗1 + 1)/2 = 0.75 EG-p ( 11 ∗1 + 1)/2 = 1 ( 12 ∗1 + 1)/2 = 0.75 nCG-0 ( 11 ∗1 + 0)/2 = 0.5 ( 11 ∗1 + 0)/2 = 0.5 nCG-1 ( 11 ∗1 + 1)/2 = 1 ( 11 ∗1 + 1)/2 = 1 nCG-p ( 11 ∗1 + 1)/2 = 1 ( 11 ∗1 + 1)/2 = 1 GMP.50 ((0.5 ∗ 1) + (0))/2 = 0.25 ((0.5 ∗ 1 − 0.5 ∗ 1) + (0))/2 = 0 Latency 2 2
Table 6: Behaviours of the studied metrics with respect to H2.
These two counterexamples are a side effect of S2.
6
Discussion of the RTS Settings
S1. Allowing up to 10 tweets to be pushed per profile per day is an arbitrary limit of the
task. In this section, we wonder how much the 2016 official metric would have been impacted by a modification of this value. With this aim in mind, we adopt the following methodology. Given N ∈ {1..10}, we apply three distinct strategies to restrict the 2016 official runs to push
only N tweets per profile per day and then calculate the average value of the EG-1 metric3.
The three strategies are as follows:
– In the First strategy, the first N tweets according to their pushing date are considered.
This strategy intuitively simulates a change in the setting but no self-adaptation of the systems to this tighter constraint.
– In the Gold strategy, N tweets are chosen to maximize the number of clusters and thus
the official metric. Given a window wj, a profile p, and a system Si, if N is greater than
the number of clusters retrieved by Si during wj for p, non-relevant tweets, i.e., either
redundant or irrelevant tweets, are pushed to fulfill our requirement. Contrary to the
Firststrategy, this strategy simulates a self-adaptation of the systems under this tighter
constraint.
– In the Random strategy, N tweets are randomly chosen. To overcome any bias in the
sampling, 100 random draws were performed and the EG-1 metric values for all these 100 runs were then averaged. This strategy represents a fair compromise between the naive
Firstand the optimal Gold strategies.
It should be noted that if less than N tweets have been pushed by a system Si for a profile
p during a window wj, the set returned by any strategy is the same as the original set of
pushed tweets. Finally, to fairly evaluate the impact of varying N , we compare the results obtained by these strategies to the average value of EG-1 in the official runs. The impact of the window size on the aforementioned strategies is shown in Fig. 4. Several strong conclusions can be drawn from these results. First, whatever the strategy, it is always beneficial to return very few tweets reinforcing the idea that EG-1 is essentially a precision-oriented metric. This conclusion is obviously even more true for the Gold strategy. Second, the performances of the First and Random strategies are very close suggesting that relevant tweets retrieved by
3
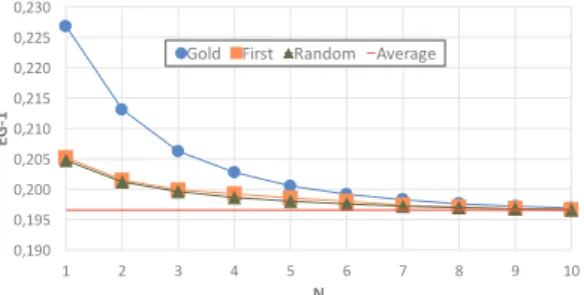
the systems are uniformly distributed over the time window. Last but not least, pushing only one tweet adopting a very basic strategy, i.e., either the Random or the First one, without any guarantees that this tweet is relevant, provides similar or better results than pushing 3 or more tweets using a sophisticated strategy such as the Gold one, i.e., in which the number of retrieved clusters is maximized. This very interesting result reinforces our claim about the regrettable non-consideration of the coverage in the official metric. This point will be further discussed in Section 9. !"#$! !"#$% !"&!! !"&!% !"&#! !"&#% !"&&! !"&&% !"&'! # & ' ( % ) * + $ #! ! " #$ % ,-./ 01234 567/-8 9:;26<;
Fig. 4: Impact of S1 on the EG-1 metric
S2.While the side effect of S2 have been assessed in Section 3, we now focus on its practical consequences during the TREC RTS 2016 track. For this purpose, we simulated an alternative evaluation framework in which the tweets are not sent back to their publication window.
We observe from these statistics that:
– very few tweets have been pushed in another window than their creation window. Specif-ically, this concerns only 0.12 % (53/45751) of the pushed tweets all the systems taken together.
– these 53 tweets have been pushed by 8 different systems over the 41 runs. Notably, one of these systems have pushed 42 tweets among the 53 tweets while the other 7 systems have pushed only 1 or 2 tweets outside their creation window.
– due to the rarity of these push window gaps, there is no differences in the rankings whatever the date taken into account for the evaluation.
Note that S2 could theoretically impact the performances of the systems, but this situation is not observed in the 2016 runs. Moreover, S2 may send back tweets to a window without any restrictions and making it greater than N , calling into question S1.
7
Experimental validation of the metrics limitations
We submitted to the 2017 official track one baseline run which exploited the above-discussed conclusions about the evaluation metrics. Its principle is as follows: after a standard prepro-cessing step, i.e., stopwords removal and stemming, the first tweet of the day containing all the query terms is returned. We thus return at most one tweet per day and per profile.
The results of our run for mobile and batch evaluation are respectively presented in Tables 7 and 8. Our run, although being very simple, can be considered as a very strong baseline. We are ranked 2nd and 4th for the mobile and batch evaluation, while maintaining latency as low as possible.
These a posteriori results clearly confirm the need for a deeper reflection and discussion about the official batch metrics and their possible biases. Since mobile evaluation also seems to be concerned by the bias, we advocate for its inclusion in future discussions.
Run Online utility (strict) Online utility (lenient) τ eτ Ps Pl 1st participant run -93 -25 1 1 0.4337 0.4822 IRIT-Run1-14 -198 -46 1 1 0.4200 0.4814 3rd participant run -262 -66 296 31 0.4140 0.4783 Average -1507 -1071 6742 5580 0.3043 0.3699 Median -805 -456 102 35 0.3403 0.4174
Table 7: Official results of our system (run IRIT-Run1-14) and median for Scenario A (mobile evalu-ation). The mean (τ ) and median (eτ) latency of submitted tweets in seconds. Strict (Ps) and lenient (Pl) precision. Average metrics were calculated using the 41 participant scores.
Run EG-p EG-1 nCG-p nCG-1 GMP.33 GMP.50 GMP.66 τ eτ 1st participant run 0.3630 0.2088 0.2808 0.1266 -0.2720 -0.1566 -0.0479 119374 56744 2nd participant run 0.3318 0.1811 0.2610 0.1102 -0.3118 -0.1936 -0.0824 116649 49154 3rd participant run 0.3226 0.2622 0.2489 0.1886 -0.1952 -0.1105 -0.0308 118653 55781 IRIT-Run1-14 0.2918 0.2571 0.2321 0.1974 -0.1195 -0.0615 -0.0070 67555 1 5th participant run 0.2907 0.2571 0.2285 0.1949 -0.1190 -0.0622 -0.0087 126484 60685 Average 0.2273 0.18740 0.2187 0.1787 -0.5106 -0.3501 -0.1990 77911 13175 Median 0.2194 0.1951 0.2095 0.1826 -0.2630 -0.1707 -0.0839 71463 80 Table 8: Official results of our system (run IRIT-Run1-14) and median for Scenario A (batch evalu-ation). The mean (τ ) and median (eτ) latency of submitted tweets in seconds. Average metrics were calculated using the 41 participant scores.
8
Reusability of the Test Collection
In order to enable comparison of new solutions against the TREC RTS 2016 and 2017 results, the organizers publicly provide an evaluation script as well as 3 ground truth files: (i) the qrels file that contains the relevance level of each tweet from the pool, (ii) the cluster file that gives cluster for each profile and (iii) the epoch file that contains the publication date of tweets from the pool.
We conducted a standard “leaved-one out” analysis to evaluate the reusability of the 2016 collection. To do so, we simulated a rerun setup for all the 41 runs submitted during 2016 and evaluated them using the official metric, EG-1. The ground truth files, i.e., cluster, qrels, and epoch files, were created for each runias if it has not taken part in the track by removing its
unique tweets. For each of these new 41 evaluation files, an alternative rankingi was obtained
using the EG-1 metric. The official ranking of each runi was then compared to this new
rankingi in order to determine how effective would have been this runi in a rerun setup.
The position of each runi in the rankingi showed either improvement or no variability with
respect to its position in the original ranking, resulting in an average gain of 2.1 positions. This very surprising result has motivated a deep analysis of the evaluation tool. We observed a very odd behavior on how the unassessed tweets, i.e., the tweets that are not referenced in the ground truth files, are considered. Indeed, such tweets are simply ignored instead of being considered as irrelevant as traditionally done in classical evaluation setups. This point is even more problematic since the way the runs deal with the silent days is crucial for the calculation of gain-oriented metrics. By decreasing the number of tweets per profile/day and increasing chances to respect the silent days, the performances of new runs in the rerun setup are artificially increased. This situation is only attenuated, but still not solved, thanks to the introduction of the EG-p and nCG-p metrics in 2017. However, ignoring the tweets that must be considered as not relevant will still increase the score obtained by those metrics during the
silent days. This bias in the (re)evaluation can be solved by including all the tweets of the Twitter stream during the evaluation period (11.5 M tweets) in the epoch file. In this case, our results showed a different ranking behaviour. None of the runs improved its position in its respective ranking, dealing with an average lost of 0.6 positions when compared to their original position.
Regarding the settings, we would like to draw attention to the fact that S1 is under the responsibility of each user of this collection. This setting was automatically handled by the organizers through the broker during the task. Not respecting this limit during the rerunning leads to underestimated performance since the gain is calculated only over the first 10 tweets but it is normalized by the total number of tweets, which could be greater than 10. Contrary to S1, S2 is always applied without user intervention.
Finally, users of the collection must consider analysis and remarks presented in Sections 5 and 6 because they are also valid under the rerun setup. We confirm the reusability of the 2016 and 2017 collections only under the aforementioned conditions, in particular, use of a complete epoch file and strict application of S1.
9
Recommendation and Conclusion
To conclude, we would like to summarize our main findings in this paper:
– we clarified some definitions and assumptions of the track guidelines. We highlight here two of them, which are not clearly stated in the guidelines and overviews of the track although crucial for a good understanding of the evaluation framework. Only a deep analysis of the evaluation tool lead us to these conclusions, causing us to believe that some participants may not be conscious of these findings:
• the evaluation window used in EG and nCG metrics is not the window corresponding to the tweet push-timestamp. Each returned tweet is sent back to its emission window, which significantly impacts the way metrics are evaluated.
• silent days are system-dependent. This is thus non-sense to elaborate approaches that try to detect silent days independently of already returned tweets.
– we shed the light on the fact that coverage is not really evaluated by the official metrics. The systems would better return few tweets that are very likely relevant to optimize the metrics. Trying to maximize the coverage and thus returning many tweets will probably lead to a result degradation. As a consequence, when developing a system for the track, all the improvements against the metrics should be compared to a very simple run returning at most one tweet per time window. This behavior of the results has already been noticed by the track organizers [7], but this was credited to misconfigurations of the systems that returned very few tweets. On the contrary, we do think that, given the metrics and the way the silent days are considered, systems should return few tweets to be top-ranked. This unusual behavior of the metrics is not observed on the other traditionally-used precision-oriented metrics such as P@K and MAP. Our official results on the 2017 track confirm these findings. We submitted a baseline run returning the first tweet of the day containing all the query terms (i.e., at most one tweet per profile and per day was returned). This very simple baseline allowed us to be ranked 2ndon the mobile evaluation and 4th (out
of 41 participants) on the batch one of Scenario A [5].
– Concerning the reusability of the collection, we found a problem on the epoch file used in evaluation. In case of rerun, researchers should add all their tweets to the official epoch file, which is not mentioned in the evaluation tool documentation. Otherwise, the results are largely over-evaluated since the evaluation does not consider the non-relevant tweets that are absent from the epoch file. As this problem has never been mentioned before
by track organizers or participants, it is very likely that some already-published research papers using the TREC RTS collection as evaluation framework report over-evaluated results.
In future and concerning the metrics, since the track will be pursued in 2018, we suggest to focus on the relative importance of clusters. For instance, let us consider the 2017 profile RTS60 entitled “Beyonce’s babies”. The very famous photo posted on Instagram in which Beyonce officially announced the names of the twins with their first image is a crucial infor-mation for this profile. Other inforinfor-mation such as the name of the nurse is also relevant but less crucial.
With equal numbers of retrieved clusters, the systems that find the cluster about this first announcement should thus be more rewarded than the systems that do not find it.
Separating latency and effectiveness should also be (re)considered. In 2015 the TREC mi-croblog track included a very first version of the task (named Scenario A - Push notification) where a latency penalty was applied to the EG metric [4]. The metric has been given up since 2016 to understand the potential tradeoffs between quality and latency. However, we think that separating latency and gain metrics may lead to some side effects that could be avoided with a single-point metric.
References
1. Trec 2017 evaluation guidelines. http://trecrts.github.io/TREC2017-RTS-guidelines.html (2017) 2. Aslam, J., Diaz, F., Ekstrand-Abueg, M., McCreadie, R., Pavlu, V., Sakai, T.: Trec 2015 temporal
summarization track overview. Tech. rep. (2015)
3. Hubert, G., Moreno, J.G., Pinel-Sauvagnat, K., Pitarch, Y.: Everything you always wanted to know about trec rts*(* but were afraid to ask). arXiv preprint arXiv:1712.04671 (2017) 4. Lin, J., Efron, M., Wang, Y., Sherman, G., Voorhees, E.V.: Overview of the trec-2015 microblog
track (2015)
5. Lin, J., Mohammed, S., Sequiera, R., Tan, L., Ghelani, N., Abualsaud, M., McCreadie, R., Milajevs, D., Voorhees, E.: Overview of the trec 2017 real-time summarization track (notebook draft). In: Pre-Proceedings of the 26th Text REtrieval Conference, TREC (2017)
6. Lin, J., Roegiest, A., Tan, L., McCreadie, R., Voorhees, E., Diaz, F.: Overview of the trec 2016 real-time summarization track. In: Proceedings of the 25th Text REtrieval Conference, TREC. vol. 16 (2016)
7. Qian, X., Lin, J., Roegiest, A.: Interleaved evaluation for retrospective summarization and prospective notification on document streams. In: Proceedings of the 39th International ACM SIGIR Conference. pp. 175–184. SIGIR ’16 (2016)
8. Roegiest, A., Tan, L., Lin, J.: Online in-situ interleaved evaluation of real-time push notification systems. In: Proceedings of the 40th International ACM SIGIR Conference. pp. 415–424. SIGIR ’17 (2017)
9. Tan, L., Baruah, G., Lin, J.: On the reusability of ”living labs” test collections: A case study of real-time summarization. In: Proceedings of the 40th International ACM SIGIR Conference. pp. 793–796. SIGIR ’17 (2017)
10. Tan, L., Roegiest, A., Lin, J., Clarke, C.L.: An exploration of evaluation metrics for mobile push notifications. In: Proceedings of the 39th International ACM SIGIR Conference. pp. 741–744. SIGIR ’16 (2016)
11. Wang, Y., Sherman, G., Lin, J., Efron, M.: Assessor differences and user preferences in tweet timeline generation. In: Proceedings of the 38th International ACM SIGIR Conference. pp. 615– 624. SIGIR ’15 (2015)