Official URL
https://doi.org/10.1109/IGSC48788.2019.8957206
Any correspondence concerning this service should be sent
to the repository administrator:
[email protected]
This is an author’s version published in:
http://oatao.univ-toulouse.fr/26377
Open Archive Toulouse Archive Ouverte
OATAO is an open access repository that collects the work of Toulouse
researchers and makes it freely available over the web where possible
To cite this version: Seguela, Morgan and Mokadem, Riad and
Pierson, Jean-Marc Comparing energy-aware vs. cost-aware data
replication strategy.
(2020) In: 10th International Green and Sustainable
Computing Conference (IGSC 2019), 21 October 2019 - 24 October 2019
(Alexandria, United States).
Comparing energy-aware vs. cost-aware data replication strategy
Morgan S´egu´ela, Riad Mokadem, Jean-Marc Pierson
Institut de Recherche en Informatique de Toulouse (IRIT) Universit´e de Toulouse, France
Email:{morgan.seguela, riad.mokadem, jean-marc.pierson}@irit.fr
Abstract—The sharp increase of the overall data amount makes their access and processing harder. Data replication is a well known technique that helps to decrease access time and improve reliability. In the context of Cloud Databases, most of data replication strategies do not answer simultaneously to performance and provider’s profit with an awareness on energy consumption. In this paper, we compare different data replication strategies. Some of them intend to reduce the overall energy consumption when others intend to maximize the profit. We highlight that very few data replication strategies figure out simultaneously solutions for those issues even if there is a high demand from industries to reduce energy consumption and carbon footprint. We finally analyse why and how the race for profit and energy savings should be researched together.
Keywords-Cloud, Data Replication, Profit, Energy consump-tion
I. INTRODUCTION
For over three decades, the amount of available data has dramatically increased as new companies are gathering more and more information. From social network to pictures of stars, the need for storage is growing within the five continents. However, companies and users need to get access to all of these data items as quickly as possible and from any place in the world. Data replication is a technique that has been studied for many years in order to meet these needs, from parallel database systems [1] to the most recent architecture, Cloud Computing [2]. In fact, data replication strategies have been set up to increase availability [3], to de-crease response time [4] and to reduce energy consumption [5]. These strategies answer to four questions [6] : Which data to replicate? When to replicate? How many replicas? And where to replicate?
Even if data replication strategies have been studied for numerous infrastructures, each has its own characteristics that creates differences between strategies. Cloud computing also has its own specific attributes. One of the most singular attributes is the agreement made between the provider and the tenant, known as the Service Level Agreement (SLA). Mainly, a SLA contains different Service Level Objectives (SLO) and penalties for the breach of an objective [7]. These penalties are applied by refunding a part of the tenant rent. There also exists several types of cloud models depending on their usage [8]. One is the public cloud, driven by powerful IT companies like Google or Amazon.
These powerful IT companies are facing several issues such as making profit in order to make investments. For this aim, the provider shares their resources, e.g., CPU, storage and bandwidth, in an elastic way among several tenants [9] according to the Pay-As-You-Go pricing model, i.e., tenants only pay what they consume. Public cloud computing growth can be highlighted by this segment in IT companies. For instance, Amazon Web Service revenues has grown by 50% from 7.88 to 12.22 billion dollars between 2015 and 2016 [10]. Another issue these companies are facing, is the reduction of energy consumption and carbon footprint that take more and more importance through global warming. Several works in the literature deal with these issues [11]. Besides, some companies are already moving forward in this field. According to the GreenPeace report of 2017 [12], Apple is leading in this Green Energy consumption race, with 83% of their energy resources coming from renewable energy.
Some data replication strategies were proposed in order to deal with the energy consumption and carbon footprint issues. Some of them take the reduction of energy con-sumption as an objective when other are trying to reduce the carbon footprint by replicating in greener data centers (DC). Other strategies deal with the profit issue. They aim to reduce the cost of data transfer or data storage. Only a few of these strategies simultaneously address these objectives [13]. They take into account the profit made by the reduction of energy consumption and try to link energy consumption with the profit objective. The purpose of this paper is to compare a profit-driven data replication strategy to other strategies designed to save energy. This comparison should lead to criticisms of these opposite objectives that should not be opposed to each other.
The rest of this paper is structured as follow. We begin by a state of the art of data replication strategies that takes into account energy consumption or expenditure. Then, we unveil our energy consumption model, that is used to compare different data replication strategies. Finally, we conclude this article and talk about future works.
II. STATE OF THE ART
Several surveys have been conducted about data repli-cation in cloud computing. Some of them studied data replication strategies from a global point of view. [14]
studies 15 different strategies with numerous approaches. They also propose a taxonomy that divides strategies in 2 groups: Static and Dynamic. They point out that there is no strategy trying to optimize for performance, avail-ability, energy consumption, and cost issues at the same time. An answer was given by [15] that provides another survey also based on 15 strategies. The authors affirmed that saying that strategies have to consider goals and find trade-off between opposite objectives, e.g., performance and energy consumption. Another survey, [16], studies on how performance is taken into account over 6 data replication strategies. A different kind of survey has been proposed by [17] that has made a systematic literature review.
Only surveys interested on global goals have pointed out energy consumption issues. Nevertheless, they did not take into account the profit made by the provider. Dealing with the economical aspect, numerous data replication strategies have been studied since the beginning of cloud computing. One of the first to take into account this economical aspect is [18]. The authors try to reduce as much as possible data replication costs. In fact, this strategy is based on the reliabil-ity of a data storage and tries to delay as much as possible replication in order to keep the same probability of hard disk failure during a certain amount of time. More recently, a strategy used the cost of data centers to take into account different aspect of DCs [19]. This strategy uses a multi-tier hierarchical cloud data center. The DC on the top is more reliable and has better performance. It has a higher cost than bottom tier DC where data center are less performing and a higher probability of failure, which costs less. It manages the trade off between replication cost and performance. Another way to take cost into account is given by [20], where replica placement depends on the quality of services and the monetary information of each node. This strategy create a new replica only if the QoS is broken. A certain number of replicas are created depending on the remaining space for the service provider and the importance of the data. Depending on the trade-off between performance within the QoS, and monetary cost, they propose several solutions to find the right number of replicas and the right placement for each one of them. Other strategies take into account the provider profit as decision criterion when replicating. In the proposed strategy in [6], data replication is triggered in order to simultaneously satisfy both the QoS for the tenant and the profit for the provider. Both revenues and expenditures of the provider are estimated when the expenditures include the replication cost. However, the energy consumption is taken into account only through a constant that also includes wages, taxes and so on.
An interesting data replication strategy was given by [13]. It takes into account at first sight energy consumption in order to reduce request monetary cost. In fact, the profit formulated in this paper is about the difference between the state with no replication and the state with this strategy. In
order to answer to the energy consumption issue, various strategies have been proposed. One of the older ones is [21] that proposes a Multi-Objective Replication Management strategy. This paper considers data replication as a trade-off between different goals such as availability, service time, workload, energy consumption and mean latency. A function to minimize is proposed for each objective. Then, they regrouped these functions in a total objective function where each goal is weighted. Another strategy proposed by [5], aims to model and reduce energy consumption and network usage. This strategy is based on a three tier fat tree architecture, and models the energy and bandwidth consumption at each level. The replication is triggered when the number of accesses to a data is higher than a threshold. Then it tries to replicate on lower level databases (DC or rack) if they consume less energy and bandwidth than higher level databases (Central, DC). [22] proposes an another way to reduce energy consumption. This strategy is based on two lists that represent the warmth of the data. If a data is too hot, which means too accessed, the replica manager will replicate this data. This replication occurs to spread the workload between storage clusters and this is where the reduction of energy consumption happens. They use an Advanced Configuration and Power Interface (ACPI), with different sleep states for clusters to reduce their need of power when idle. Thus, the goal is to maximize the workload of a few clusters to put in sleep state the others. [23] also takes into account the energy consumption. It aims to reduce carbon emissions, with the knowledge of the carbon footprint of each energy sources, and the mix of each sources the DC uses. It tries to find the optimal number of replicas depending on the placement to minimize their carbon footprint when reading and writing data. Even if this strategy only cares about carbon footprints, the reduction of emissions can be induced by 2 factors: a better mix of greener energy sources and/or the reduction of energy consumption.
Table I summarizes data replication strategies cited in this paper. Features of these strategies are highlighted, although some of them are out of the scope of these strategies. Only one data replication strategy takes into account both energy consumption and profit. This constitutes a real challenge. On the one hand, the problems of energy consumption are becoming more perceptible. On the other hand, profit is one of the main concerns of public cloud computing.
III. ENERGYCONSUMPTION MODEL
In order to compare data replication strategies that intend to maximize profit or minimize consumed energy, we pro-pose a model to estimate a Cloud-wide energy consumption. Before introducing our model, the primary formula to esti-mate energy consumption in joules (J), based on Power in watts (W) and time in second (s), is written as follow:
Strategy Availability Performance Profit Energy [24] yes no no no [25] yes yes no no [26] yes yes no no [4] no yes no no [27] yes yes no no [3] yes no no no [28] no no no yes
[21] yes yes no yes
[5] no yes no yes
[22] yes yes no yes
[23] yes no no yes
[18] yes no yes no
[19] yes yes yes no
[20] yes yes yes no
[6] yes yes yes no
[13] yes yes yes yes
Table I
DATA REPLICATION STRATEGIES FEATURES FOR CLOUD
In this article, we estimate the energy consumption for each component of a computing server from Central Pro-cessing Unit (CPU) to Network Interface Controller (NIC). For each one of them, we provide: (i) an estimation of the static energy consumption, which represents the idle energy consumption of the component, and (ii) the dynamic energy consumption of the component, which is the energy consumed by executing a task. Also, we use those models to estimate the energy consumed by their interactions during the execution.
A. Components
1) Processor: The processor is the core of the computing server. It is one of the largest power consumers [29]. We pro-posed an estimation based on the estimation of [30] which has been reused by [29] to estimate energy consumption of an host based on its CPU load :
ECPU(l, f ) = ECP Uact(l, f ) + ECP Uidle(f ) (2)
= T X t=0 (PCP Uf max− P f CP Uidle) ∗ α ∗ 1 l ∗ N bInstruct f + P f CP Uidle∗ Ttot (3)
The first part of the equation corresponds to the dynamic energy consumption while the second part corresponds to the static energy consumption. Here, Pf
CP Umaxand P
f
CP Uidlemean
respectively the maximum and idle power consumption (W) of the CPU at a given frequency f in GigaHertz (GHz). T and
NbInstruct mean the total number of tasks and the number of instructions each task has respectively. Ttotcorresponds to
the global execution time which takes into account execution and transfer time (s). Finally, l and α correspond respectively to the percentage of processing power to a task, and the percentage of power consumed by the CPU linked to l. However, like [30], we suppose a linear interaction between
l and the dynamic energy consumption, thus α = l. This gives us the following formula :
ECPU(f ) = T X t=0 (Pf CP Umax− P f CP Uidle) ∗ N bInstruct f + PCP Uf idle∗ Ttot (4)
2) Memory: Memory is the component where data are
temporary stored in order to transfer those data faster to the CPU or Network Interface Card. The concerned memory concerned here is the Random Access Memory (RAM). The energy model proposed here is based on the model given by [31] which had been used more recently in a technical report to compute the energy consumed by memory in [32]. This allowed us to set up different use case (idle, read, write) based on different variable like the reading and writing rate. We finally get the following equation :
ERAM = ERAMread + ERAMwrite+ ERAMidle (5)
= R X r=0 (PRAMread∗ size(F ile) BWRAM ) + W X w=0 (PRAMwrite∗ size(F ile) BWRAM ) +
PRAMidle∗ Ttot (6)
where W and R correspond to the number of writings and readings respectively, the size of the file is written size(File) in megaoctet (Mo). Finally, BWRAM corresponds
to the bandwidth (BW) of the RAM in Mo per second (Mo/s).
3) Hard Drive Disk: The Hard Drive Disk (HDD), is
the component that is able to store data for a long period of time. Unlike the RAM, its throughput is low, and it also has a seeking time to take into account. In order to model the energy consumed by this component, we used the model proposed by [33] that estimates energy consumption based on technical report of this component. This model has been used more recently in [34] for estimating energy consumption of different kind of Solid-State Drive.
EHDD= EHDDact+ EHDDidle (7) = N X i=0 PHDDActive∗ size(F ile) BWHDD + S X j=0
PHDDSeek∗ TSeek+ PHDDidle∗ Ttot (8)
Where PHDDActive (W) corresponds to the power used for
reading or writing file on the disk. The size of the file and the bandwidth of the disk, are written as size(File) (Mo) and BWHDD (Mo/s) respectively. The seeking time for the disk
to find the file is written TSeek (s) and the power linked to
4) Network Interface Card: To model the Network Inter-face Card, we used the document that presents the 802.3az standard [35]. This standard allows a high reduction of the energy consumed while idle. Thus, for a T number of transfers, we use the following model :
EN IC= EN ICact+ EN ICidle (9) = T X t=0 (PN ICActive∗ size(F ile) BW N IC) + PN ICidle∗ Ttot (10) B. Usage model
Models discussed above are linked together depending on the case. As this article discusses about data replication strategies, different kind of actions could occur during an execution. Two types of energy consumption have to be defined. The first one is the static energy consumption which is the energy consumption baseline for each component. The second one is the dynamic energy consumption which corresponds to the energy consumed by each component in activity. We add it to the first one. This one is represented by task processing, data transferring and storing.
1) Static energy consumption: The static energy con-sumption represents the energy concon-sumption baseline for each component, to which we add the dynamic energy consumption. Thus, we take this static energy consumption during all the execution.
EIdle= (PCP Uidle+ PRAMidle+ PHDDidle+
PN ICidle) ∗ Ttot (11)
2) Processing energy consumption: During the execution of a query, we consider the processing of the CPU, and also the reading of processed file in memory. Then, we consider the following processing model:
EP ro= ECP UAct+ ERAMread (12)
3) File transfer to process a query: Files that are required to execute a query, can be placed on the processing node (src=tgt). In this case, only the readings from the disk and the writings (wr) on the memory are taken into account. Otherwise, if the file is placed on an another node, we have to take into account the energy consumed by transferring the data from the source (src) to the processing node (tgt).
EF T = EHDDreadsrc+✶src6=tgt∗ (ERAMwrsrc+
ERAMreadsrc+ EN ICsrc+ (13)
EN etwork+ EN ICtgt) + ERAMwrtgt
4) File storage: In the case of data replication, data storage like file transfer, can be done on the processing node (src=tgt). In this case, we only have to take into account the energy consumed by reading the data from memory to write it on the disk. However, the replication can occur on an another node. Hence, we also have to take into account the transfer between the node that has it in memory (src) and the targeted node for replication (tgt).
ERepl= ERAMreadsrc+✶src6=tgt∗ (EN ICsrc+
EN etwork+ EN ICtgt+ (14)
ERAMwritetgt+ ERAMreadtgt) + EHDDwritetgt
IV. EXPERIMENTS
A. Experimental Environment
In order to compare different data replication strategies, we implemented them on the CloudSim Simulator [36]. This simulator had been extended by Uras Tos for his thesis [37] in order to take into account data replication, large scale communication, and monetary cost of resources. Then, this has been extended again to take the energy consumption into account based on our models presented in section III. We compare different data replication strategies: PEPR [6], Boru et al. strategy [5], MORM [21], and finally the absence of data replication (NoRep). We run our experiments based on the parameters from Table II.
Network parameters come from different documents. Bandwidth characteristics are based on [5]. Latency values are based on Wikipedia’s network latency1. Pricing
charac-teristics are based here on Google Cloud prices2 assuming
a margin of 20%. Finally, the response time threshold given as a SLO, comes from [38], where a 15 seconds wait with feedback makes 25% of users leave. The energy consumption of the network is supposed to be negligible for the comparison between different strategies. This is mostly due the high static energy consumption of switches but low dynamic energy consumption [5].
In our experiments, we had to take care of the given architecture for each data replication strategy. In fact, in [5], the cloud topology is not the same as PEPR. The architecture of Boru et al. corresponds to a three tier fat tree where each level has a database. In order to take into account Boru et al. architecture inside PEPR one, we added on the architecture, a DC per region which corresponds to the DC database, and a region which represents the central database. However, these added structures are not taken into account to the global energy consumption, because those nodes can not process tasks, and only store data. In contrast with PEPR topology, processing nodes can store data. This permits us to compare those strategies for a given amount of storage
1https://wikitech.wikimedia.org/wiki/Network design (05/22/2019) 2https://cloud.google.com/pricing/list (04/08/2019)
and processing resources. Also, it is worth mentioning that an absence of replication (P2PNoRep), PEPR and MORM are implemented in the PEPR topology which is close to a peer to peer topology. Additionally, an another absence of replication (HNoRep) and Boru et al. are implemented in the three tier fat tree topology. The differences between P2PNoRep and HNoRep is that data are randomly spread between processing nodes for P2PNoRep, and data are stored in the Central database for HNoRep.
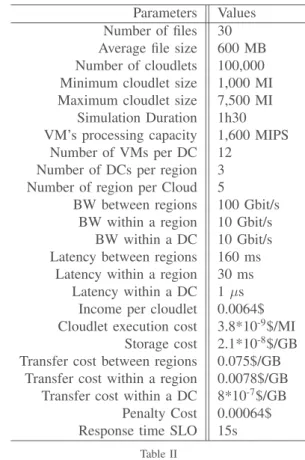
These different strategies are compared with regards to five metrics: (i) the number of replicas created, which highlights the replica management of each strategy, (ii) the number of SLO violations, which corresponds to execution time that are higher than the Service Level Objective. (iii) the execution time for each task, which is linked to the second one, (iv) the energy consumed (in J) by the Cloud and (v) the total cost for the provider (in dollars).
Docker images and github repository are provided in order to let everyone run their own experiment with their parame-ters on our environment. They are available on Dockerhub3
and on GitHub4.
Parameters Values Number of files 30 Average file size 600 MB Number of cloudlets 100,000 Minimum cloudlet size 1,000 MI Maximum cloudlet size 7,500 MI
Simulation Duration 1h30 VM’s processing capacity 1,600 MIPS
Number of VMs per DC 12 Number of DCs per region 3 Number of region per Cloud 5
BW between regions 100 Gbit/s BW within a region 10 Gbit/s
BW within a DC 10 Gbit/s Latency between regions 160 ms
Latency within a region 30 ms Latency within a DC 1 µs
Income per cloudlet 0.0064$ Cloudlet execution cost 3.8*10-9$/MI
Storage cost 2.1*10-8$/GB
Transfer cost between regions 0.075$/GB Transfer cost within a region 0.0078$/GB
Transfer cost within a DC 8*10-7$/GB
Penalty Cost 0.00064$ Response time SLO 15s
Table II SIMULATION PARAMETERS B. Results
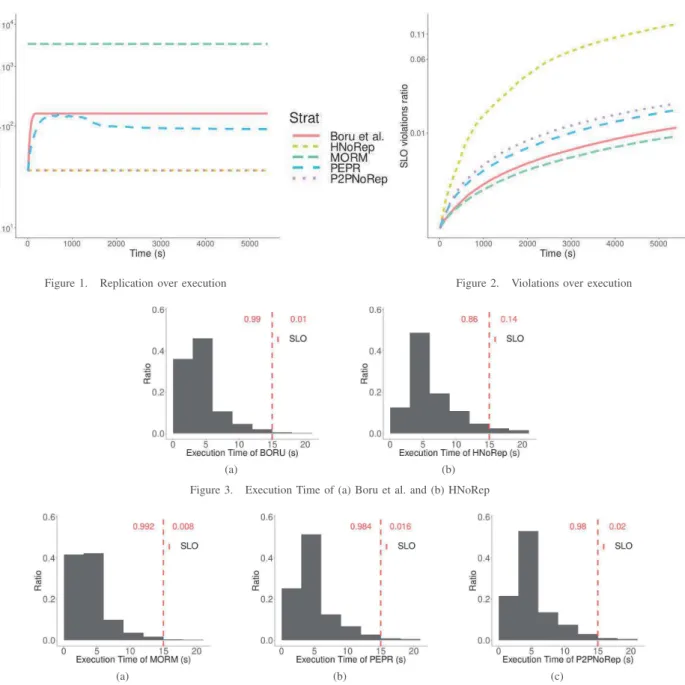
Figure 1 represents the evolution of replicas over time. First, we can see that MORM replicates very often in order
3https://hub.docker.com/r/mseguela/igsc-2019-xps 4https://github.com/MorganSeguela/IGSC 2019 XPS
to fulfill its objectives. For Boru et al., we see a sharp increase of the number of replicas which stays at the same value during the execution. Finally, PEPR creates replicas slower than Boru et al. and then reduces their number to stay at 60 replicas. The interesting part is that PEPR tries to regulate the numbers of replicas based on SLO violations. This figure can be related to the Figure 2, that draws the number of SLO violations. On this plot, we can see that the higher the number of replicas, the lower the number of violations is. Also, this plot highlights the differences between the hierarchical architecture and the Peer to Peer one. In fact, when there is no replication in a hierarchical architecture, all the requests for files comes to the central database, which corresponds to a specific region. Hence, the data transfer time is getting worse as time pass. Compared to the peer to peer one, where a request can come from an another region or a node within the data center. This makes the file transfer time more efficient but this is harder for the systems to locate the data.
The following figures represent histograms of execution time for all tasks, by data replication strategy. We can see the impact of hierarchical topology (Figure 3a and Figure 3b) on the efficiency of data replication strategy. In fact, without any replication, the execution time is hardly under 5s, due to the network bottleneck of the central database. It leads to the highest ratio of SLO violations and an increase of execution time. Thus, it explains the high impact of Boru’s Strategy where the bottleneck fades away, due to the high occurrence of replication and allows faster access to data. Peer to Peer topology seems to be more balanced in this point of view when there is no replication happening. However, it leads to a lower differentiation in execution time between a data replication strategy and no replication. As we can see on Figure 4b and Figure 4c, between PEPR and P2PNoRep, where their SLO violations ratio are 1.64% ±0.003% and 1.95% ±0.004% respectively with 95% of confidence. We can point out that the most efficient here on execution time is MORM (Figure 4a) due to the large amount of replicas created which reduces a lot data transfer time.
The next two plots represent the metrics we wanted to point out. On Figure 5, we can figure out that MORM is the strategy that consumes less energy. This is due to the high level of replication. This replication is not taken into account because it is done before the execution. However, we can see that Boru et al. is the strategy that consumes the more. In order to explain this, we can say, in one hand, that the architecture forces the transfer of data compared to the peer to peer one, where all nodes can store data. On the other hand, we can say that the replication is done independently of the execution which leads to more communication between nodes and end up to consume more. On this plot, PEPR consumes as much as the absence of replication. But, this is noticeable that if we integrate the energy consumed by replication in MORM at the beginning
Figure 1. Replication over execution Figure 2. Violations over execution
(a) (b)
Figure 3. Execution Time of (a) Boru et al. and (b) HNoRep
(a) (b) (c)
Figure 4. Execution Time of (a) MORM, (b) PEPR and (c) P2PNoRep
of the experiment, this should be a lot higher.
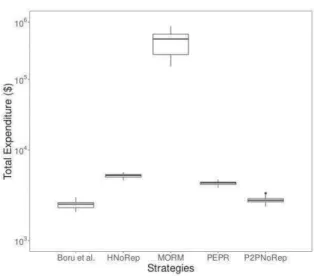
Finally, the Figure 6, represents the total expenditure for each strategy. The MORM strategy is the one that costs the most. It costs 90 times the second most expensive one. In contrast, the cheapest strategy here is Boru et al. with a 12% reduction from PEPR one. In fact, the cost was highly reduced by the topology, where the replication happens on the tier below, so the firsts replicas goes in each region and then in each data center which lead to cheaper data transfer. PEPR is not the cheapest one, due to the fact that PEPR replicates only when it is profitable, i.e., when the expenditure goes above the revenue, it stops replicating. This brings a growth of SLO violations, especially when there is
a removal mechanism working.
V. CONCLUSION AND FUTURE RESEARCH DIRECTION
In this paper, we compared different replication strategies. PEPR [6] strategy leads to reduce the cost without any effect on the energy consumption. Furthermore, we have seen that Boru et al. [5] reduces the cost, with an higher energy consumption. At the opposite, MORM [21], consumes less energy, but generates a more important cost due to the high number of replicas.
This permits to highlight some guidelines to reduce energy consumption and expenditure. We could advise to not repli-cate independently from the execution and to add a replica
Figure 5. Energy consumed Figure 6. Total expenditure
management mechanism to delete or move replicas. From the perspective point of view, the conducted exper-iments could be extended by adding the energy consumed by the network architecture.
Furthermore, it would be much better to remake these experiments on real architecture.
Also, it would be interesting to set up a new data replication strategy which simultaneously takes into account these objectives for a multi-criterion optimization in order to guarantee a better compromise.
REFERENCES
[1] P. Valduriez, “Parallel database systems: Open problems and new issues,” Distributed and Parallel Databases, vol. 1, no. 2, pp. 137–165, Apr. 1993.
[2] R. Buyya, C. S. Yeo, S. Venugopal, J. Broberg, and I. Brandic, “Cloud computing and emerging IT platforms: Vision, hype, and reality for delivering computing as the 5th utility,” Future
Generation Computer Systems, vol. 25, no. 6, pp. 599–616, Jun. 2009.
[3] S. A. E. Selvi and R. Anbuselvi, “RAAES: Reliability-Assured and Availability-Enhanced Storage for Cloud Envi-ronment,” International Journal of Pure and Applied
Mathe-matics, vol. 118, pp. 103–112, Feb. 2018.
[4] X. Bai, H. Jin, X. Liao, X. Shi, and Z. Shao, “RTRM: A Response Time-Based Replica Management Strategy for Cloud Storage System,” in Grid and Pervasive Computing, ser. Lecture Notes in Computer Science, vol. 7861. Springer Berlin Heidelberg, 2013, pp. 124–133.
[5] D. Boru, D. Kliazovich, F. Granelli, P. Bouvry, and A. Y. Zomaya, “Energy-efficient data replication in cloud comput-ing datacenters,” Cluster Computcomput-ing, vol. 18, no. 1, pp. 385– 402, Mar. 2015.
[6] U. Tos, R. Mokadem, A. Hameurlain, T. Ayav, and S. Bora, “Ensuring performance and provider profit through data repli-cation in cloud systems,” Cluster Computing, Dec. 2017.
[7] D. Serrano, S. Bouchenak, Y. Kouki, F. A. de Oliveira Jr., T. Ledoux, J. Lejeune, J. Sopena, L. Arantes, and P. Sens, “SLA guarantees for cloud services,” Future Generation
Computer Systems, vol. 54, pp. 233–246, Jan. 2016. [8] S. Goyal, “Public vs Private vs Hybrid vs Community
-Cloud Computing: A Critical Review,” International Journal
of Computer Network and Information Security, vol. 6, no. 3, pp. 20–29, Feb. 2014.
[9] N. R. Herbst, S. Kounev, and R. Reussner, “Elasticity in Cloud Computing: What It Is, and What It Is Not,” ICAC, vol. 13, pp. 23–27, 2013.
[10] J. Bezos, “Amazon Annual Report 2016,” Ama-zon.com, Tech. Rep., Feb. 2017. [Online]. Available: www.annualreports.com/Company/amazoncom-inc
[11] F. Kong and X. Liu, “A Survey on Green-Energy-Aware Power Management for Datacenters,” ACM Computing
Sur-veys, vol. 47, no. 2, pp. 1–38, Nov. 2014.
[12] G. Cook, J. Lee, T. Tsai, A. Kong, J. Deans, B. Johnson, and E. Jardim, “Clicking Clean: Who is Winning the Race to Build a Green Internet?” Greenpeace Inc., Washington, DC, Tech. Rep., 2017. [Online]. Available: http://www.clickclean.org/
[13] M. Alghamdi, B. Tang, and Y. Chen, “Profit-based file repli-cation in data intensive cloud data centers,” in 2017 IEEE
International Conference on Communications (ICC). Paris, France: IEEE, May 2017, pp. 1–7.
[14] B. A. Milani and N. J. Navimipour, “A comprehensive review of the data replication techniques in the cloud environments: Major trends and future directions,” Journal of Network and
Computer Applications, vol. 64, pp. 229–238, Apr. 2016. [15] K. Tabet, R. Mokadem, M. R. Laouar, and S. Eom, “Data
Replication in Cloud Systems: A Survey,” International
Jour-nal of Information Systems and Social Change (IJISSC), vol. 8, no. 3, pp. 17–33, Jul. 2017.
[16] M. B. Gudadhe and A. J. Agrawal, “Performance Analysis Survey of Data Replication Strategies in Cloud Environment,” in Proceedings of the 2017 International Conference on Big
Data Research, ser. ICBDR 2017. New York, NY, USA:
ACM, 2017, pp. 38–43.
[17] B. A. Milani and N. J. Navimipour, “A Systematic Literature Review of the Data Replication Techniques in the Cloud Environments,” Big Data Research, vol. 10, pp. 1–7, Dec. 2017.
[18] W. Li, Y. Yang, and D. Yuan, “A Novel Cost-Effective Dynamic Data Replication Strategy for Reliability in Cloud Data Centres,” in 2011 IEEE Ninth International Conference
on Dependable, Autonomic and Secure Computing. Sydney, Australia: IEEE, Dec. 2011, pp. 496–502.
[19] N. K. Gill and S. Singh, “A dynamic, cost-aware, optimized data replication strategy for heterogeneous cloud data cen-ters,” Future Generation Computer Systems, vol. 65, pp. 10– 32, Dec. 2016.
[20] L. Zeng, S. Xu, Y. Wang, K. B. Kent, D. Bremner, and C. Xu, “Toward cost-effective replica placements in cloud storage systems with QoS-awareness: Toward cost-effective replica placements in cloud storage systems with QoS-awareness,”
Software: Practice and Experience, vol. 47, no. 6, pp. 813– 829, Jun. 2017.
[21] S.-Q. Long, Y.-L. Zhao, and W. Chen, “MORM: A Multi-objective Optimized Replication Management strategy for cloud storage cluster,” Journal of Systems Architecture, vol. 60, no. 2, pp. 234–244, Feb. 2014.
[22] L. Zhang, Y. Deng, W. Zhu, J. Zhou, and F. Wang, “Skewly replicating hot data to construct a power-efficient storage cluster,” Journal of Network and Computer Applications, vol. 50, pp. 168–179, Apr. 2015.
[23] Z. Xu, N. Deng, C. Stewart, and X. Wang, “CADRE: Carbon-Aware Data Replication for Geo-Diverse Services,” in 2015
IEEE International Conference on Autonomic Computing. Grenoble, France: IEEE, Jul. 2015, pp. 177–186.
[24] Q. Wei, B. Veeravalli, B. Gong, L. Zeng, and D. Feng, “CDRM: A Cost-Effective Dynamic Replication Management Scheme for Cloud Storage Cluster,” in 2010 IEEE
Interna-tional Conference on Cluster Computing. Heraklion, Greece: IEEE, Sep. 2010, pp. 188–196.
[25] D.-W. Sun, G.-R. Chang, S. Gao, L.-Z. Jin, and X.-W. Wang, “Modeling a Dynamic Data Replication Strategy to Increase System Availability in Cloud Computing Environ-ments,” Journal of Computer Science and Technology, vol. 27, no. 2, pp. 256–272, Mar. 2012.
[26] F. R. Sousa and J. C. Machado, “Towards Elastic Multi-Tenant Database Replication with Quality of Service,” in 2012
IEEE Fifth International Conference on Utility and Cloud Computing. Chicago, IL, USA: IEEE, Nov. 2012, pp. 168– 175.
[27] K. A. Kumar, A. Quamar, A. Deshpande, and S. Khuller, “SWORD: workload-aware data placement and replica selec-tion for cloud data management systems,” The VLDB Journal, vol. 23, no. 6, pp. 845–870, Dec. 2014.
[28] N. Maheshwari, R. Nanduri, and V. Varma, “Dynamic energy efficient data placement and cluster reconfiguration algorithm for MapReduce framework,” Future Generation Computer
Systems, vol. 28, no. 1, pp. 119–127, Jan. 2012.
[29] T. Mastelic, A. Oleksiak, H. Claussen, I. Brandic, J.-M. Pierson, and A. V. Vasilakos, “Cloud Computing: Survey on Energy Efficiency,” ACM Computing Surveys, vol. 47, no. 2, pp. 1–36, Dec. 2014.
[30] L. Minas and B. Ellison, “The Problem of Power Consumption in Servers,” 2009. [Online]. Available: https://software.intel.com/
[31] M. Rhu, M. Sullivan, J. Leng, and M. Erez, “A locality-aware memory hierarchy for energy-efficient GPU architectures,” in
2013 46th Annual IEEE/ACM International Symposium on Microarchitecture (MICRO). Davis, California: ACM Press, Dec. 2013, pp. 86–98.
[32] Micron, “TN-40-07: Calculating Memory Power for DDR4 SDRAM,” 2017. [Online]. Available: https://www.micron.com/support
[33] A. Hylick and R. Sohan, “A methodology for generating disk drive energy models using performance data,” Energy
(Joules), vol. 80, p. 100, 2009.
[34] M. Song, “Minimizing Power Consumption in Video Servers by the Combined Use of Solid-State Disks and Multi-Speed Disks,” IEEE Access, vol. 6, pp. 25 737–25 746, Jun. 2018. [35] K. Christensen, P. Reviriego, B. Nordman, M. Bennett,
M. Mostowfi, and J. Maestro, “IEEE 802.3az: the road to energy efficient ethernet,” IEEE Communications Magazine, vol. 48, no. 11, pp. 50–56, Nov. 2010.
[36] R. N. Calheiros, R. Ranjan, A. Beloglazov, C. A. F. De Rose, and R. Buyya, “CloudSim: a toolkit for modeling and simu-lation of cloud computing environments and evaluation of resource provisioning algorithms,” Software: Practice and
Experience, vol. 41, no. 1, pp. 23–50, Jan. 2011.
[37] U. Tos, “Data replication in large-scale data management systems,” Theses, Universit Paul Sabatier - Toulouse III, Jun. 2017. [Online]. Available: https://tel.archives-ouvertes.fr/tel-01820748
[38] F. F.-H. Nah, “A study on tolerable waiting time: how long are Web users willing to wait?” Behaviour & Information