Any correspondence concerning this service should be sent
to the repository administrator:
[email protected]
This is an author’s version published in:
http://oatao.univ-toulouse.fr/26642
To cite this version: Verdalet-Guardiola, X
avier and Saillard,
R
omain and Fori, Benoit and Duluard, Sandrine and Blanc,
C
hristine Comparative analysis of the anticorrosive properties of
trivalent chromium conversion coatings formed on 2024-T3 and
2024-T351 aluminium alloys. (2020) Corrosion Science, 167.
108508. ISSN 0010938X
Official URL
DOI :
https://doi.org/10.1016/J.CORSCI.2020.108508
Open Archive Toulouse Archive Ouverte
OATAO is an open access repository that collects the work of Toulouse
researchers and makes it freely available over the web where possible
Comparative analysis of the anticorrosive properties of trivalent chromium
conversion coatings formed on 2024-T3 and 2024-T351 aluminium alloys
X. Verdalet-Guardiola
a,
b,
c, R. Saillard\ B. Fori
e, S. Duluard
h,
C. Blanc
a,*
a CIRIMAT, Université de Toulouse, CNRS, INP -ENSIACET, 4 allée Emile Monso, BP 44362, 31030, Toulouse Cedex 4, France bClRLMAT, Université de Toulouse, CNRS, UPS, 118 route de Narbonne, 31062, Toulouse Cedex 9, France
c MECAPROTEC Iruhlstries, 34 Boulevard. de Joffrery, BP 30204, 31605, Muret Cedex, France
ABSTR A CT Keywords: A. Aluminium A. Copper A. Intermetallics B. EIS B. Polarisation C. Oxide coatings
The anticorrosive properties of the trivalent chromium process (TCP) coatings were studied for a 2024 alumi nium alloy (AA2024) in both T3 and T351 metallurgical states. Better corrosion resistance was measured for the TCP coated AA2024-T3 compared to AA2024-T351, which was clearly related to the surface copper coverage measured after the pre-treatments for the different samples. The differences were explained considering the reactivity of both the S-phase coarse intennetallics (IMCs) and intergranular Cu-rich precipitates during deox idation. Large S-phase IMCs and nurnerous intergranular Cu-rich precipitates constihlted critical metallurgical parameters for the anticorrosive properties of the TCP coatings.
1. Introduction
Al alloys are widely used in the aeronautical industry because they allow a decrease of the structure mass due to their good mechanical properties, e.g. high specific modulus, obtained by the addition of al loying elements [l]. However, this is associated with a heterogeneous microstructure, and consequently with a susceptibility to localised corrosion [2-4]. Hence, Al alloys cannot be used without an antic orrosive treatment. Hexavalent Cr conversion coatings are largely used to protect Al alloys against corrosion, but they will be banned from use in 2024 in the aeronautic field by the European regulation REACh [5]. Therefore, a lot of research studies have been focused on the develop ment of Cr(VI)-free conversion coatings, e.g. trivalent Cr process (TCP) coatings [6-10]. TCP is used in particular for the 2024 Al alloy (M2024). M2024 has been used for more than 30 years in the aero nautic industry, because it exhibits good mechanical properties and fatigue resistance; however, it also has a low corrosion resistance as sociated, as said above, with a heterogeneous microstructure [11]. For a T3 thermomechanical treatment, the quenching, following the solution heat treatment, does not allow the precipitation of S" /S' (Al2CuMg type) or 8"/0' (Al2Cu type) hardening precipitates. Therefore, AA2024-T3 exhibits only a Cu-supersaturated solid solution in which Guinier Preston and/or Guinier-Preston-Bagaryatsky zones can be distinguished [12,13]. Slower cooling of the alloy, which can occur at the core of a thick plate, corresponding to a T35 l thermomechanical treatment, can
• Corresponding author.
E-mail aMress: [email protected] (C. Blanc).
allow the precipitation of hardening precipitates, but mainly that of intergranular precipitates [14]. Therefore, significant differences in microstructure are observed between M2024-T3 and M2024-T351. These microstructural differences can be associated with different an ticorrosive properties of TCP coatings as shown by Saillard et al. [15]. Moreover, coarse intermetallic particles (IMCs) are formed during Al alloy casting and are not dissolved during the solution heat treatment, during which they can grow [16]. In M2024, the most commonly observed IMCs are Al2CuMg (S-phase) and Al-Cu-Mn-Fe particles with a wide range in composition [12]. Those particles are present in both T3 and T351 samples but have a smaller size in T3 sample [15,17]. Such a difference in IMCs size can be linked to the differences in the thermo mechanical treatment, taking into account that a mechanical treatment, e.g. rolling, can lead to the fragmentation of IMCs, and therefore re duces their diameter [18, 19]. The electrochemical behaviour of S-phase has been widely studied, and it is well known that its dissolution can lead to Cu redeposition [10,15,20]. Moreover, the detrimental effect of Cu enrichment on TCP coating anticorrosive properties has been shown by many authors [15,21,22]. Therefore, considering ail the micro structural differences that exist between M2024-T3 and M2024-T35 l, it could be expected significant differences in the anticorrosive prop erties of the TCP coatings formed on both alloys. This topic is of major interest, in particular from an industrial point of view, because the certification of the surface treatments for M2024 is commonly per formed by using M2024-T3 only.
Therefore, in the present paper, the anticorrosive properties of the TCP coatings formed on the surface of both T3 and AA2024-T351 alloys were compared by using neutral sait spray tests (NSST), polarisation curves and electrochemical impedance spectroscopy (EIS). Tuen, to explain the results, cyclic voltammetry (CV) was used to measure the surface Cu coverage after the pre-treatrnent step; finally, scanning and transmission electron microscope (SEM and TEM) ob servations were performed to identify the critical microstructural parameters, which contributed to explain the anticorrosive properties of the TCP coatings formed on both AA2024-T3 and AA2024-T351 al loys.
2. Materials and methods 2.1. Materials and sample preparation
Samples were machined from a 3-mm thick sheet and a 60-mm thick plate of AA2024, ail provided by Constellium. The 3-mm thick sheet and the 60-mm thick plate were in the T3 and T35 l metallurgical states, respectively. Both metallurgical states corresponded to rolling, solution heat treatrnent, water quenching, stress relieve and natural ageing at room temperature. The difference between the two me tallurgical states was that T3 corresponded to hot and cold rolling, whereas only hot rolling was achieved for the T351 state, leading to a thicker plate. Samples from the 3-mm thick sheet and from the 60-mm thick plate are referred as AA2024-T3 and AA2024-T351, respectively. Chemical composition of the alloys are reported in Table 1. lt could be noted here that the Cu content of the two alloys was qui te similar ( 4.4 wt. % for AA2024-T3 and 4.2 wt. % for AA2024-T351). Verdalet et al. [10] showed, for samples of AA2024-T3 machined from two sheets of similar composition ( 4.5 wt. % and 4.4 wt. %, i.e. with differences in Cu content in the same range as observed in the present study), that no significant differences in anticorrosive properties of the TCP coating could be measured. Therefore, it was relevant to consider here that the results concerning the anticorrosive properties of the TCP coatings formed on AA2024-T3 and AA2024-T35 l could not be explained by considering such a small difference in Cu content. AA2024-T3 samples were 120 x 80 x 3 mm3 parallelepipeds with the TCP coating grown
on the longitudinal (i.e. rolling, L)/long transverse (LT) plane. There fore, for AA2024-T3 alloy, only one plane of the sheet was studied, which was relevant taking into account the industrial application. For AA2024-T351 samples, some were machined with the main plane parallel to the L/L T plane of the plate for two sampling depths, i.e. in the core of the plate (30-mm depth), and on ils surface (0-mm depth). Others were machined with their main plane parallel to the LT/ST (short transverse) plane of the plate. They were 120 x 60 x 3 mm3
parallelepipeds. Before the pre-treatrnents, ail samples were abraded using SiC papers down to P-grade 2400 and then polished with a 1 µm diamond paste.
TCP treatrnent was performed using a multi-step process. Industrial grade chemical reactants were used for all solutions, and the samples were rinsed in deionised water after each step. Due to confidentiality reasons, the exact composition of the solutions cannot be given. Firstly, samples were rinsed with acetone in order to remove surface pollutants. Tuen, they were immersed in a degreaser alkaline bath ( 40 g L -1 so
dium tripolyphosphate, 40 g L _, borax and 5 ml L-1 Turco 4215 ad ditive, pH = 9) at 60 "C for 1200s. The following deoxidation step was used to remove IMCs and the native oxide. For this step, two solutions Table 1
Chemical composition of AA2024-T3 and AA2024-T351 samples.
El. (wt. %) AA2024-T3 AA2024-T351 Al Base Cu 4.4 4.2 Mg 1.4 1.4 Mn 0.51 0.51 Fe 0.15 0.15
were tested in order to show that differences in anticorrosive properties of the TCP coatings formed on AA2024-T3 and AA2024-T351 were observed independently of the pre-treatment. Both solutions were a sulfo-nitro-ferric solution, but with differences in their composition. The first solution was a Socosurf Al858-Al806 (pH < 1) provided by Socomore (France) and called deoxidation 1; samples were immersed in this solution at 50 "C for 300 s, leading to a dissolution rate of about 50 nm min-1
• For the second solution (pH = 1), called deoxidation 2,
samples were immersed at room temperature for 300 s, leading to a dissolution rate of about 0.2 nm min -l. It is important to note here
that, due to the differences in both concentration of the species present in the deoxidation solutions and temperature, differences in the surface chemistry after the pre-treatrnent, and consequently in the morphology and anticorrosive properties of the TCP coatings formed on a specific alloy, should be observed. But, no significant differences in chemistry of the TCP coatings were expected, and it was not the focus of this work to perform such a study. Finally, the TCP coating was formed by immer sing the samples in a Zr/Cr-containing Socosurf TCS solution (32 %v;v
Socosurf TCS (Socomore, France), 3.8 < pH < 4) at 40 "C for 600 s. This treatrnent was completed by a post-treatrnent, which corresponded to an immersion of the samples covered by the coating in the rare-earth element containing post-treatrnent PACS solution (10 % v/v Socosurf PACS provided by Socomore, France, 5 % v/v H202 at 35 % v/v in
water, pH between 4.2 and 5.3) at room temperature for 300 s. Finally, samples were dried at 60 "C during 600 s. For TCP coated samples, ail tests were performed at least 48 h after the conversion treatrnent.
2.2. Electrochemical measurements
The electroactive Cu content on a 4-cm2 sample surface, called
surface Cu coverage (Bcul, was determined by cyclic voltammetry (CV) experiments as described in Scully's work [23,24]. A three-electrode cell connected to a Bio-Logic VSP potentiostat was used with a satu rated calomel electrode (SCE) as reference electrode and a platinum electrode as counter electrode. Measurements were performed in a deaerated borate buffer solution (8.17 g·L -l Na2B4O7-10 H20, 7.07
g-L _, H3BO3, pH = 8.4) at room temperature. Before CV, the solution
was deaerated for 15 min with nitrogen bubbling. The measurement procedure consisted of three CV scans and could be described as fol lows: (a) polarisation at -0.7 VscE during 5 min; (b) scan from -0.7 VscE to 0.3 VscE then back to -1.2 VscE at 1 mV s-1; (c) hold at -0.7 VscE during 10 min; (d) repeat step (b); (e) hold at -0.7 VscE during 20 min; (f) repeat step (b). During the first two cycles, the signal corre sponding to Al oxidation was reduced (due to the polarisation at - 0.7 V scE and nitrogen bubbling), allowing the Cu peak to be clearly ob served. Therefore, the electroactive Cu content was determined by measuring the area under the Cu(0)-Cu(I) peak in the last scan, by using Eq. (1):
Bcu (%) = Area under Cu(0) to Cu(!) peak of studied samples X 100 Area under Cu ( 0) to Cu(!) peak of pure copper
(1)
In the following, the surface Cu coverage values are calculated from at least three experiments. As shown by this equation, pure Cu was a reference; therefore CV experiments were first performed on pure Cu. Two oxidation peaks were identified: the first peak corresponded to the oxidation of Cu (0) to Cu (I), and the second one to the oxidation of Cu
(I) to Cu (II). To avoid errors on the measurements, only the first peak
Si 0.08 0.09 Zn 0.17 0.18 Ti 0.02 0.03 Cr 0.01 0.01 Zr 0.01 0.01 Ni 54ppm 66ppm
X. Verdalet-Guardiola, et aL
was analysed because it was more intense than the second one. CV scans for pure Cu can be seen in our previous work [15].
The corrosion properties of the TCP coated samples were first evaluated by neutral sait spray tests (NSST) because these tests are widely used in industry and defined by the ISO9227 standard. In ad dition, the aeronautical standard requires NSST in order to certify conversion layers. In this framework, NSST results were relevant and helpful in strengthening the industrial impact of the results. Exposure of the samples was achieved in an Ascott sait spray chamber Sl20iS under ISO9227 standard. Parallelepiped samples were used with a l-dm2
surface area; they were inspected each 24 h and the number of pits was determined. From an industrial point of view, when the number of pits was equal or higher than 5, the corrosion was considered as general corrosion. For reproducibility reason, two or three tests were performed for each condition. In the conditions of the test, corrosivity tests for CR4 steel exhibited a corrosion rate of 68 g m-2 for 48 h.
Tuen, to complete these results and to provide a more accurate analysis of the anticorrosive properties of the TCP coatings, both po larisation tests and electrochemical impedance spectroscopy (EIS) ex periments were performed in a 0.5 M NaCI solution. As for surface Cu
coverage measurements, a three-electrode cell connected to a Bio-Logic VSP potentiostat was used. The working electrode was a parallelepiped sample, with the studied surface being placed horizontally at the bottom of the cell. The saturated calomel electrode (SCE), used as re ference electrode, and the graphite rod electrode, used as counter electrode, were placed above at a distance of about 10 mm. Preliminary experiments were also performed with the working electrode placed vertically in the cell in order to check whether possible phenomenon of corrosion products deposition could disturb the measurements. No significant differences were observed between the two configurations (commented in the discussion part), and the conclusions were exactly the same for both cell configurations. Moreover, preliminary open cir cuit potential (OCP) measurements were performed for ail samples: results showed that, for ail samples, OCP values decreased abruptly during the first 5 min, then progressively increased and remained stable after 30 min. Therefore, samples were maintained at their OCP for 1 h, and then the anodic and cathodic curves (surface exposed of 4 cm2)
were obtained independently, with a potential sweep rate of 0.14 mV s-1. With these experimental conditions, the corrosion potential mea sured on the polarisation curves was equal to the stable OCP value measured after 1 h. For EIS experiments, a 10-cm2 sample surface was
first exposed to the solution for 1 h at OCP before EIS measurements, as for polarisation tests. Then, EIS measurements were performed at the OCP in the frequency range 1 105 to 1 10-2 Hz with a potential am
plitude (rms) of 10 mV, for different immersion times until 21 days. For brevity, only the results obtained for a 21-day immersion are given in the following. Ail electrochemical tests were performed at least three times for reproducibility. Ail values given in the discussion part are mean values calculated from those repeated measurements.
2.3. Morphological characterisations
The surface morphology of the TCP coatings was observed by using a scanning electron microscope (SEM) with a Field Emission Gun (SEM FEG), JEOL JSM 6100 F (platform of micro-characterisation Raimond Castaing, Toulouse, France). The SEM-FEG operated at 5 kV in sec ondary electrons mode. Cross-sections were realised with a SEM Focused Ion Bearn (SEM-FIB) FEI HELIOS 600i equipped with a gallium Ionie Canon (platform of Micro-characterisation Raimond Castaing, Toulouse, France). Gallium canon operated at 30 kV and 47 nA to 80 pA during cutting. Before cutting, samples were gold-plated, then covered by an electronic carbon layer (thickness 0.5 µm, voltage 5 kV and probe current 2.5 nA, precursor: naphthalene (C10H8)) and a 3 µm thick ionic
platinum layer (voltage 30 kV and probe current 0.43 nA, precursor:
methylcyclopentadieny(trimethyl)platinum (C5H4CH3Pt(CH3h)).
Energy dispersive X-ray spectroscopy (EDS) analyses were performed
by using an EDX Aztec Advanced (Oxford Instruments) with SDD X-Max 80 mm2 detector. To complete the analyses, the samples were also
observed by transmission electron microscopy (TEM, JEOL JEM 2100 F, platform of micro-characterisation Raimond Castaing, Toulouse, France) operating at 200 kV, and combined with EDS analyses (SDD Bruker). Finally, glow-discharge optical emission spectroscopy (GD OES) analyses were also performed by using a HORIBA Jobin Yvon GD Profiler 2 (platform of micro-characterisation Raimond Castaing, Toulouse, France), operating with an argon pressure of 630 Pa, a power of 30 W, radiofrequency of 13.56 MHz, with a 4-mm diameter copper anode. Before sampling, a flush time of 120 s was operated. lnstability of the plasma initiation was avoided by covering the samples by a gold sputtered layer. An acquisition interval of 0.01 s was fixed. The emis sion lines used here were Al 396.152 nm, Cu 324.754 nm, Zr 339.198 nm, Cr 425.433 nm and Au 242.795 nm.
3. Results
3.1. Corrosion behaviour of TCP coated AA2024 samples
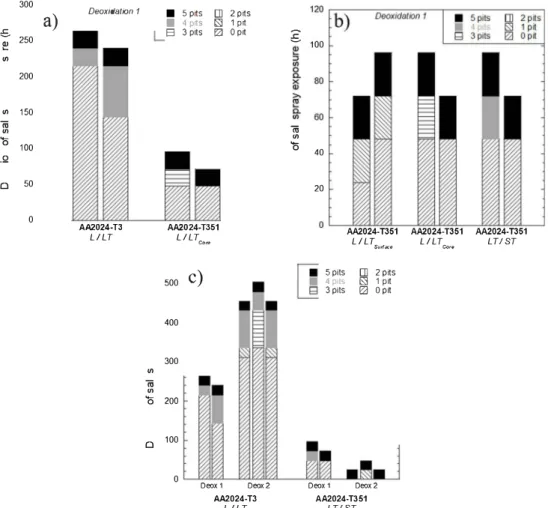
Firstly, the corrosion behaviour of the TCP coated AA2024 alloys was evaluated by using NSST. The number of pits observed for AA2024-T3 and AA2024-AA2024-T35 l during NSST are reported in Fig. 1. Results show that TCP coated AA2024-T3 and AA2024-T351, pre-treated with deoxidation 1, exhibit significant differences in corrosion resistance (Fig. la and b). The first pit appeared after 144 h in the NSST chamber for T3 (L/LT), whereas it appeared after only 48 h for AA2024-T351 (L/LT,ocel (Fig. la). Moreover, results obtained after NSST ex posure for different planes of the AA2024-T35 l plate (Fig. 1 b) showed that, independent of the plane, the first pit appeared after 48 h and general corrosion between 48 and 72 h of NSST exposure. This showed similar anticorrosive properties of the TCP coating formed on the AA2024-T351 plate, independently of the plane, and better corrosion behaviour for the TCP coated AA2024-T3 sheet than for the TCP coated AA2024-T351 plate. To check that such differences were not specific of deoxidation 1 solution, results from NSST exposure of TCP coated AA2024-T3 (L/LT) and AA2024-T351 samples (LT/ST), pre-treated with deoxidation 2, are given in Fig. le; results obtained for a pre treatment with deoxidation 1 are reported for comparison. For AA2024-T3 samples, the first pit appeared after 300 h with deoxidation 2, whereas the first pit occurred rapidly (24 h or Jess) after the beginning of the NSST exposure for AA2024-T35 l samples. Therefore, results clearly showed that the TCP coated AA2024-T3 exhibited better cor rosion behaviour than TCP coated AA2024-T351, after both deoxida tion 1 and deoxidation 2 pre-treatments. Il was interesting to note that deoxidation 1 solution led to a lower corrosion resistance of AA2024-T3 samples after TCP treatment as compared to deoxidation 2 solution. For AA2024-T351, due to the low anticorrosive properties of the TCP coatings formed, the NSST did not allow to evaluate the influence of the deoxidation solution on those properties.
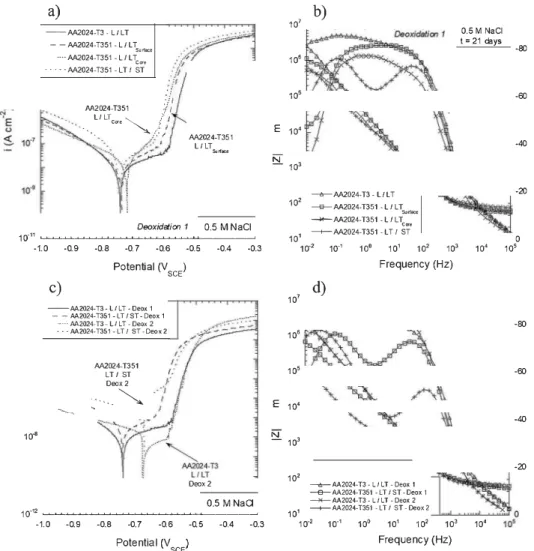
To go further in the characterisation of the anticorrosive properties of the TCP coatings, potentiodynamic polarisation and EIS measure ments were performed (Fig. 2). Polarisation curves plotted in a 0.5 M NaCI solution for both TCP coated AA2024-T3 and AA2024-T351 samples, with a pre-treatment corresponding to deoxidation 1, are re ported in Fig. 2a. Ali samples exhibited a similar corrosion potential around -0.73 ± 0.02 VscE• Moreover, the global shape of the polarisa tion curves was similar for ail samples with a passivity plateau observed in the anodic domain, which was characteristic of the electrochemical answer of the TCP coating. In a 0.5 M NaCI solution, bare metals were susceptible to localised corrosion at their corrosion potential, and a sharp increase of the anodic current densities was observed at the corrosion potential (results not shown). An accurate analysis of the curves allowed to distinguish between two types of corrosion beha viour. Firstly, AA2024-T3 and the L/LTru,face plane of AA2024-T351
300 é,
a)
e
250 Deoxidation 1"'
200"'
150 ni"'
0
100 ,Q 50 0 0 AA2024-TJLILT
"'
ni"'
0
0■
s
pns■
4 prts 8 3 pns Dl 2 pns � 1 pn E2l o pn AA2024-T351LILT
c.� 500c)
400 300 200 100 0 Oeox 1 Oeox 2 AA2024-TJLILT
:s
ni"'
0
100 40 20 5 pits 4 p1ts 3 pils Oeox 1 AA2024-T351LILT
St.Jrf.,;•gJ
2 pns ,.,, 1 pn EL! 0pn Deox 2 AA2024-T351LT!ST
AA2024-T351 AA2024-T351LILT
=·
LT/ST
Fig. 1. Neutra! Salt Spray Test results obtained for a) TCP coated AA2024-T3 (LJLT) and AA2024-T351 (L-LTceœl deoxidised with deoxidation 1 solution), b) TCP coated AA2024-T351 (L/LTru,r.m L/LT,0,, and LT/ST) deoxidised with deoxidation 1 solution) and c) TCP coated AA2024-T3 (L/LD and AA2024-T351 (LT/SD deoxidised with deoxidation 1 and deoxidation 2 solutions.
even though a weak positive slope could be observed on the passivity plateau, which was more marked for the L/L T ,u,face plane of AA2024-T35 l; this could be linked to the aggressivity of the 0.5 M NaCI solu tion. Considering that the corrosion behaviour was controlled by the presence of the TCP coating, the corrosion current was calculated by extrapolation of the passivity plateau until the corrosion potential value. For samples for which the passivity plateau was not so well-de lined, this procedure led to a Jack of accuracy in the corrosion current density values, but the authors assumed that this procedure constituted a rather good estimation of this parameter. For both AA2024-T3 and the L/LT,urface plane of AA2024-T351, corrosion current densities were found to be equal to 8.1 ± 0.5 10-9 A cm-2• However, a slightly more positive pitting potential (determined by extrapolation of the passivity plateau and the part of the anodic branch corresponding to the sharp increase of the current density) was reported for AA2024-T3 (-0.58 ± 0.01 VscE) as compared to the L/LT,unace plane of AA2024-T351 (-0.60 ± 0.02 VscE); moreover, the anodic current densities on the passivity plateau were slightly higher for the L/LT,unace plane of AA2024-T351 as compared to AA2024-T3 (2.0 ± 0.6 10-• A cm-2 and 4.2 ± 0.5 10-• A cm-2 for T3 and L/LT,urface plane of
AA2024-T351, respectively for a potential of - 0.66 VsCE• Those values were different from the corrosion current density values due to the slope noted in the passivity plateau). It is clear that the differences between the different values were weak. However, the experiments were re produced live times and results were very reproducible. The values given corresponded here to the mean values from live experiments. Moreover, same conclusions were obtained with the working electrode placed in a vertical position. Nevertheless, considering the small am plitude of the differences, the only relevant conclusion was that the results showed a good resistance to pitting corrosion for the TCP coated AA2024-T3 and the TCP coated L/LTru,face plane of AA2024-T351, even though they also suggested that the L/L T ru,face plane of AA2024-T35 l was slightly more susceptible to pitting than AA2024-T3 samples. Tuen, results also showed that the L/L T co,e and LT /ST planes of the AA2024-T35 l plate did not exhibit similar properties compared to the L/LT,unace plane of AA2024-T35 l and AA2024-T3 samples. Indeed, the corrosion current densities were higher (1.9 ± 0.4 10-• A cm-2 and 4.1 ± 0.6 10-• A cm-2 for the L/LTccre and LT/ST planes of the AA2024-T351 plate, respectively) indicating a faster corrosion kinetics. Moreover, for both samples (L/LTccre and LT/ST planes of the AA2024-T351 plate), the
X. Verdalet-Guardiola, et aL
a)
--AA2024-T3- LILT - -AA2024-T351 - Li LT Sijrf.,;e .... AA2024-T351 - LI L T,.,
· · · · ·AA2024-T351-LT I ST·,
:f 1 AA202•-ns1:r
1 Ccre > LJLT � /1·...
/·� ,/
Deoxidalioo 1 AA2024-T351 L/LT.,,�
0.5 MNaCI 10·11�~�������-����----�
-1.0 -0.9 -0.8 -0.7 -0.6 -0.5 -0.4 -0.3 10 ..c)
Potential (V SCE) --AA2024-T3-L/LT · Oeox 1 - - AA2024-T351-LT /ST -Deox 1 --- AA2024-T3 • li LT - Deox 2 - - -AA2024-T351-LT/ ST-Deox2--
.. AA2024-T351 LT I ST Deox 2�-
-
-
.
_�
Deox 2 0.5 MNaa 10"12�-~������-����----�
-1.0 -0.9 -0.8 -0.7 -0.6 -0.5 -0.4 -0.3Pote ntia 1 (V scE)
E
8:
E8:
107b)
0.5 M NaCI t = 21 days -80 10' 105 -60 10' -40 103 ----¼-AA2024-l3-L/LT -20 102 -a-AA2024-T351 . Li LT..
,�
--AA2024-T351 - LI LT C= 10' ---+- M2024-T351 - L T / ST 0 1er' 10-' 10• 10' 10' 103 104 105 Frequency (Hz) 107d)
-80 106 105 -60 104 -40 103 -20 102 ----ë-AA2024-T3 - LI L T - Deox 1 -S-AA2024-T35I -LT I ST -Deox 1 � AA2024-T3 - LI L T - Deox 2 10' �AA2024-T351 - LT / ST - Deox2 10-' 10-' 10° 10' 102 103 10' Frequency (Hz)Fig. 2. a) Polarisation curves and b) impedance diagrams (al OCP, after 21 days of immersion) plotted for TCP coated AA2024-T3 (L/LT) and AA2024-T351 (L/ LTsunace, L/LTcore and LT/ST) deoxidised with deoxidation 1 solution. c) Polarisation curves and d) impedance diagrams (at OCP, after 21 days of immersion) plotted for TCP coated AA2024-T3 (L/LT) and AA2024-T351 (LT/ST) deoxidised with deoxidation 1 and deoxidation 2 solutions. Ail measurements are performed in 0.5 M NaCI.
passivity plateau was not well-defined, which showed the aggressivity of the electrolyte towards those TCP coatings, and the anodic current densities were higher (1. 1 ± 0.5 10-7 A cm-2 at - 0.66 V sCEl than for the two other samples. The pitting potetttial measured for L/LT,me and LT/ ST planes of the AA2024-T351 plate was also more negative than for the two other samples, and equal to -0.63 ± 0.01 VscE• Here also, the differences were weak, but reproducible. Results obtained from ex periments perfonned with working electrodes placed vertically in the cell did not show significant differences and led to the same conclu sions. Therefore, the results showed better anticorrosive properties for the TCP coating formed on M2024-T3 compared to M2024-T35 l, as previously shown with NSST. Moreover, the polarisatiott curves al lowed to distinguish between the anticorrosive properties of the TCP coatings fonned on M2024-T351 depending on the planes of the plate: results indicated lower anticorrosive properties for the TCP coatings fonned on the L/L T ,0,. and L T /ST planes of the AA2024-T35 l plate as
compared to the L/LT,urrace plane of the same plate. To complete those results, EIS spectra were plotted for different immersion limes, from 1 h to 21 days, in 0.5 M NaCl for TCP coated M2024-T3 and for the dif ferent planes of M2024-T351 after TCP, ail samples being pre-treated with deoxidation 1. For brevity reasons, only the results obtained after 21 days of immersion in 0.5 M NaCl are reported in Fig. 2b. The an ticorrosive properties of the TCP coatings were first evaluated by de tennining the impedance modulus at 10-2 Hz, refereed as IZlo.01 Hz, which was considered as a global resistance of the system [10,15]. Results clearly showed that the TCP coated M2024-T3 exhibited the highest IZlo.o, H, value (2.76 ± 0.01 106 Ohm cm2). For the TCP coated M2024-T351, the IZlo.01 Hz values were lower, but with a higher IZlo.01 H, value (1.15 ± 0.01 106 Ohm cm') for the L/LT,urrace plane as com pared to the L/LT,0,. and LT-ST planes (0.55 ± 0.01 106 Ohm cm' and 0.70 ± 0.01 106 Ohm cm', respectively). For ail samples, a phase signal constituted by two-time constants were observed, related to the
electrochemical processes occurring at the coating/alloy interface, and to the anticorrosion properties of the coating [10,15,25]. However, the shape of the frequency range of high phase angles was different for the LT/ST plane of AA2024-T351, as compared to the other samples. In deed, for the LT/ST plane of AA2024-T351, the two-time constants were clearly visible, as observed for a bare AA2024 sample [10,15]. For ail other samples, visual inspection of the impedance diagrams did not allow to clearly see the two-time constants, but it showed an extension of the measured frequency range of high phase angles. However, the frequency range of high phase angles was significantly larger for AA2024-T3 and the lowest for the L/LT,ore plane of AA2024-T351.
Indeed, the frequency range where the phase angles were under -70°
were 2 102 - 1 10-2 Hz for AA2024-T3, 2 102 - 1 10-1 Hz for the L
LT,mtace plane of AA2024-T351 and 3 101 - 1 10-1 Hz for the L/LT,0,.
plane of AA2024-T351. The IZlo.01 8, values and the frequency range
associated with high phase angles could be reported to the anticorrosive properties of the TCP coating as reported by Qi and al. [25]. A high IZl0.01 8, value could be associated with an improvement of the antic
orrosive properties of the TCP coating, which could be attributed to a better adhesion of the coating on the metal or a Jess defective coating. Moreover, a narrower frequency range with high phase angles ( < - 70°) suggested a decrease of the corrosion resistance of the
coating related to an improved penetration of the electrolyte through the defects of the coating [25-27]. Therefore, the results showed that the TCP coating grown on the AA2024-T3 thin sheet had the best protective properties against corrosion. Moreover, it was clearly shown that the sampling direction for the AA2024-T351 thick plate, i.e. the nature of the crystallographic plane, had a significant influence on the anticorrosive properties of the TCP coating with better corrosion re sistance for the L/LT,urface plane as compared to the L/LTcore and LT/ST
planes. It could be added here that the results obtained for shorter immersion times led exactly to the same conclusions. For ail immersion times in NaCI solution, first, the IZl0.01 8, values were lower for the
AA2024-T351 samples, as compared to AA2024-T3. Moreover, for AA2024-T3, a slight increase of the IZlo.01 8, values were observed in
the 200 first hours, and then the values remained stable. On the con trary, for the AA2024-T351 samples, no increase of the IZl0.01 8, values,
and even a decrease for the L/L T core plane, was observed. The increase in the IZl0.01 8, values for AA2024-T3 could be explained by referring to
a self-healing mechanism helpful in filling the pores and repairing the defects of the TCP coatings, whereas the decrease in I Z 10.01 8, values
was related to a degradation of the coating. The results thus suggested more defective TCP coatings for the AA2024-T351 samples, with de fects too large to be repaired by a self-healing mechanism. Furthermore, they showed that the deposition of corrosion products that might occur due to the position of the samples in the electrochemical cell did not disturb the results. Results obtained for samples placed vertically in the cell corroborated this hypothesis, with no significant differences ob served whatever the position of the samples in the cell.
A comparison between the two deoxidation treatments for the TCP coated T3 and the TCP coated LT/ST plane of the AA2024-T351 thick plate was reported in Fig. 2c and d, to check once more whether the differences between AA2024-T3 and AA2024-T35 l were observed independently of the pre-treatment. For more brevity, for AA2024-T351, the results are given only for the LT/ST plane that showed the worst corrosion behaviour with deoxidation l; the results obtained for the other planes of the AA2024-T351 plate are not given, but they did not change the conclusions. Polarisation curves (Fig. 2c) showed a shift of about 60 ± 10 m V for the corrosion potential towards Jess negative values between deoxidation 1 and deoxidation 2 for the two alloys, but no variation of the pitting potential. Therefore, for both alloys, the potential range corresponding to the passivity plateau was decreased for deoxidation 2 as compared to deoxidation 1 pre-treat ment. Moreover, for the thin sheet of AA2024-T3, the corrosion current for the deoxidation 2 pre-treated sample (3.2 ± 0.4 10-9 A cm-2) was lower than for the deoxidation 1 pre-treated sample (8.1 ± 0.5 10-9 A
cm-2). On the contrary, for the LT/ST samples of AA2024-T351, the deoxidation 2 pre-treatment led to an increase in the corrosion current with a 3.0 ± 0.6 10-6 A cm-2 corrosion current measured after deox idation 2 by comparison to a value of 4.1 ± 0.6 10-• A cm-2 measured after deoxidation 1 pre-treatment. Taking into account both the varia tion of the potential ranges corresponding to the passivity and the corrosion current values, it was therefore difficult to conclude about the influence of the deoxidation solution on the anticorrosive properties of the TCP coatings. The main result given from those measurements was that, even with the deoxidation 2 solution, the anticorrosive properties of the TCP coating formed on the AA2024-T35 l were lower than those measured for the AA2024-T3 sample. These results were confirmed by impedance measurements. EIS spectra recorded after 21 days in a 0.5 M NaCI solution for the TCP coated AA2024-T3 and AA2024-T351 (LT/ST plane) samples deoxidised with deoxidations 1 and 2 are reported in
Fig. 2d. For the AA2024-T3 sample, the frequency ranges of high phase angles were similar with deoxidation solutions 1 and 2 (2 102 - 1 10-2
Hz), but the IZl0.01 Hz values were slightly higher for deoxidation 2
(4.61 ± 0.01 106 Ohm cm2) as compared to deoxidation 1 (2.76 ± 0.01
106 Ohm cm2
). Those results indicated better corrosion resistance for AA2024-T3 pre-treated with deoxidation 2 as compared to deoxidation 1. For the LT/ST plane of the AA2024-T351 thick plate, independent of the pre-treatment, the IZl0.01 tt, values were significantly lower
(0.70 ± 0.01 106 Ohm cm2 and 0.26 ± 0.01 106 Ohm cm2, for deox
idations 1 and 2, respectively) than th ose for the TCP coated AA2024-T3 sample, and two time-constants were clearly identified, as for the bare metal, which indicated an important penetration of the electrolyte through the defects of the coating, and therefore, a highly defective coating [10,15]. Therefore, the corrosion properties of the TCP coated AA2024-T35 l were significantly lower than those of the TCP coated AA2024-T3, even for the deoxidation 2 solution, in agreement with NSST results and polarisation curves. Moreover, for the L T /ST plane of the AA2024-T35 l thick plate, the I Z 10.01 8, value was higher for
deoxidation 1 than for deoxidation 2. To strengthen this analysis, the equivalent circuit proposed by Qi et al. (Fig. 3) [27] was used to fit the EIS spectra obtained for both AA2024-T3 and the LT-ST plane of AA2024-T351 samples, for the two deoxidation solutions. As previously done, for brevity, results were only given for LT/ST plane of AA2024-T351 because it presented the worst corrosion behaviour. In agreement with the identification of two time constants, the proposed circuit in cluded i) the electrolyte resistance (R,), ii) one time constant corre sponding to the electrochemical processes at the TCP coating/alloy interface and represented by a parallel combination of the charge transfer resistance Rct and a constant phase element Qa1, and iii) one time constant associated with the conversion coating and represented by the coating resistance Rcoat and the constant phase element Q,0.,.
Mean values of these parameters are given in Table 2. Results clearly showed that, for ail samples, the R,oat values were significantly lower
than Re, values, which suggested, as previously shown by Qi et al. [27],
that the anticorrosive properties of the TCP coating were mainly at tributed to the inner layer, with pores and cracks in the TCP coatings allowing access of the electrolyte to the alloy. Therefore, attention was mainly paid to the Re, values; results clearly showed that Rct values were one order of magnitude higher for AA2024-T3 as compared to the LT/ST plane of AA2024-T351, whatever the deoxidation solution. Moreover, considering this parameter, the increase in the corrosion performances for AA2024-T3 with deoxidation 2 solution, as compared to deoxidation 1 solution, was observed, in agreement with NSST re sults. In the same way, the decrease in the corrosion resistance of AA2024-T351 sample with deoxidation 2 solution, as compared to deoxidation 1, was also confirmed. Fig. 3 showed a comparative ana lysis of the Rct and I Z 10.01 8, values; the time values corresponding to
the formation of the 5th pit during NSST results are also reported. Fig. 3
showed a very good agreement between the three sets of values, which suggested once more a defective structure for the TCP coating formed on the LT/ST plane of AA2024-T351, as compared to AA2024-T3. In
X. Verdalet-Guardiola, et aL
--- IZ�01Hz (10
4 Ohm cm2) Fig. 3. Evolution of the Rcb IZlo.oi m: and time of formation of the s"' pit for the T3 and the LT/ST plane of AA2024-T351 for two deoxidation solutions. The equivalent circuit used to fit the EIS data is presented here.
___.__R,, (Ohm cm2)
--◊--- Formation of the 5th pit (hours) 1 108 �---�----�---� 500 8 107 6 107 4 107 2 107
_j
/i
r/
!:';/
<é--- ,·•;
◊
�
��
400 300 200 100 0�---�----�---�----�----o
Table 2 Deox 1 Deox 2 AA2024-T3 L/LT Deox 1 Deox 2 AA2024-T351 LT/STParameters extracted from Fig. 2d, i.e., EIS spectra for the different coated samples (AA2024-T3 and LT/ST plane of the AA2024-T351 for the two deox idation solutions) after 21 days of immersion in 0.5 M NaCl. The equivalent circuit used is presented in Fig. 3.
Re (ohmcm2) Rcoat (ohm cm2) Rcr (ohm cm2) ± 1 104 Qcoat (an/(ohm cm2)) ± 2 10-7 Uco11t Qc11 (an/(ohm cm2)) ± 2 10-7 U.n 2024-T3 Deox 1 60 ± 5 82 ± 4 58.30 10' 1.9 10-6 0.94 ± 0.01 2.8 10-6 0.93 ± 0.01 2024-T351
Deox2 Deox 1 Deox 2 75 ± 5 69 ± 5 64 ± 5 38 ± 4 2680 ± 80 1680 ± 60 97.02 106 3.84 106 2.85 106 1.1 10-6 1.510-6 1.5 10-6 1.00 ± 0.01 0.86 ± 0.01 0.83 ± 0.01 4.2 10-6 2.6 10-6 15.8 10-6 0.91 ± 0.01 0.86 ± 0.01 0.87 ± 0.01 that sense, the lower values of a,0., measured for the L T /ST plane of AA2024-T351 as compared to AA2024-T3, whatever the deoxidation solutions, were in good agreement with this hypothesis. Then, the in crease in acoat combined with a decrease in Qcoat for AA2024-T3, when deoxidation 2 was compared to deoxidation 1, confinned the better anticorrosion properties obtained for the deoxidation 2 solution. On the contrary, for the LT /ST plane of AA2024-T35 l, the decrease in a,oat for deoxidation 2 solution, as compared to deoxidation 1, showed the lower anticorrosion properties of the TCP coating fonned for the deoxidation 2 solution. Finally, globally, NSST, polarisation tests and EIS experi ments led to the same conclusions. Therefore, to go further in the un derstanding of the differences in corrosion behaviour of the TCP coated AA2024-T3 and AA2024-T351 alloys, the surface Cu coverage of the samples after each step of the pre-treatment, was determined and then analysed taking into account the differences in microstructure between the two alloys.
3.2. Determin.ation of the swface CU coverage
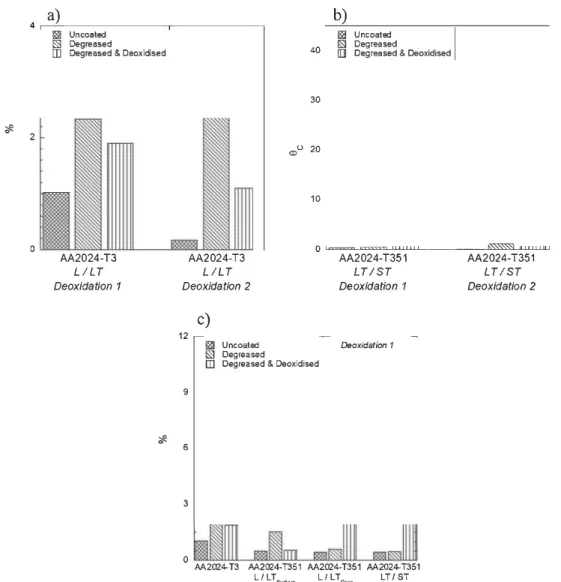
Many authors attributed the decrease of the anticorrosive properties of the conversion coatings to a surface Cu enrichment during the pre treatments steps [21,22,28,29]. As indicated in the experimental part, the surface Cu coverage can be determined by CV measurements as shown by Scully et al. [23,24]. Fig. 4a and b compare the surface Cu coverage of the AA2024-T3 and AA2024-T351 (LT/ST plane), respec tively, after each step of the surface preparation, for bath deoxidation solutions. For comparison, the surface Cu coverage of the as polished surfaces, before the pre-treatment, is also reported (samples are re ferred as uncoated). For brevity, in Fig. 4a and b, the comparison was made between AA2024-T3 (plane L/LT) and AA2024-T351 with the LT/ST plane only, because this plane presented the worst resistance to corrosion after TCP coating. To complete the results, Fig. 4c reports the results obtained for the three characteristic planes of AA2024-T351, for deoxidation 1 solution. For AA2024-T3, independently of the deox idation solution, the variation of the surface Cu coverage was similar to that commonly reported in the literature with a significant increase in the surface Cu coverage after degreasing and a significant decrease in this value after deoxidation [15]. The surface Cu coverage of the un coated samples was attributed to the response of mainly S-phase IMCs. During degreasing, S-phase IMCs could dissolve leading to Cu re deposition [10], so that, after degreasing, the surface Cu coverage could be attributed to both S-phase IMCs and Cu deposits [30,31]. After deoxidation with the deoxidation 1 solution, SEM-FEG observations showed that the major part of the S-phase IMCs was removed for AA2024-T3, with a fraction of surface area covered by S-phase IMCs decreasing from 0.8 % for uncoated samples to 0.3 % after degreasing and deoxidation (considering only the S-phase IMCs with a diameter higher than 1 µm); therefore, the surface Cu coverage after degreasing and deoxidation was attributed mainly to Cu deposits, which showed that the Cu deposits had been only partially removed during deoxida tion [30]. Results also showed that, for the sample deoxidized with deoxidation 2, the surface Cu coverage was higher after degreasing:
a)
4 .-�---,---,�
0 2 0 lilil Uncoated l',S Degreased[D Degreased & Deoxidised
AA2024-T3
L/LT
Deoxidation 1
AA2024-T3
L/LT
Deoxidation 2
c)
b)
40 liil! Uncoated 1 ES! DegreasedII] Degreased & Deoxidised
30 <I>o 20 10 0
'==-==u...!.Lll.LllL_ _____ .=
==owLI..LLlLlU
AA2024-T351
LT/ST
Deoxidation 1
AA2024-T351
LT/ST
Deoxidation 2
12 � -- - - --- - - -� llll3 Uncoated l:;::J Degreased Deox;dation 1[[] Degreased & Deoxidised
9
�
0 6
3
0 AAW24-T3 AA2024-T351 AA2024-T351 M2024-T351
L/LT Surlaœ L/LT Core LT/ST
Fig. 4. Surface Cu coverage measured for uncoated, degreased and degreased & deoxidised samples. a) T3 (L/LT), deoxidation 1 and 2 solutions, b) AA2024-T351 (LT/ST), deoxidation 1 and 2 solutions, and c) AA2024-T3 (L/LT) and AA2024-AA2024-T351 (L/LTmfom L/LT=re and LT/ST), deoxidation 1 solution.
taking into account that the degreasing step was similar as for deox idation 1 sample, such variation in the surface Cu coverage could be attributed to the intrinsic variation in reactivity of the S-phase IMCs [32,33]. After deoxidation with the deoxidation 2 solution, a slightly lower surface Cu coverage (1.1 ± 0.3 %) was measured compared to that measured with the deoxidation 1 solution (1.9 ± 0.3 %). SEM-FEG observations of the degreased and deoxidized surface showed that, after degreasing and deoxidation with deoxidation 2 solution, the fraction of surface area covered by S-phase IMCs was lower than 0.1 %, as com pared to 0.3 % for the sample deoxidized with deoxidation 1 solution, which could explain the differences in the surface Cu coverage. More over, it was of interest to note that the lower surface Cu coverage measured for deoxidation 2 sample, compared to deoxidation 1 sample, could be related to its better corrosion behaviour determined by cor rosion tests above. However, again, the main result was the highly significant difference in behaviour measured for the AA2024-T351 (LT/
ST plane) sample as compared to AA2024-T3. Indeed, for AA2024-T351 (LT/ST plane), whatever the deoxidation solution, the surface Cu cov erage was also found to increase after degreasing, as for the AA2024-T3, but, after deoxidation, it went on increasing, reaching 10 ± 1 % for deoxidation 1 and 40 ± 2 % for deoxidation 2. It was of major interest to note here that the differences in surface Cu coverage values between AA2024-T3 and AA2024-T351 samples were highly significant. Similar results were obtained by Viroulaud et al. [21] for AA2024-T351. The au th ors showed by using X-ray photoelectron spectroscopy an increase in the surface Cu coverage after deoxidation using a sulfo-nitro-ferric solution; moreover, by performing ToF-SIMS analyses, they showed that, after degreasing, Cu was mainly localised on the S-phase inter metallics, whereas, after deoxidation, it was distributed ail over the surface, probably due to a strong redeposition process. However, Fig. 4c shows that the variation in the surface Cu coverage as a function of the pre-treatrnent steps, was dependent on the nature of the plane for
X. Verdalet-Guardiola, et aL
M2024-T351. Indeed, a similar behaviour was observed for LT/ST and L/LTcore planes of the M2024-T351 thick plate, whereas, the variation
in surface Cu coverage for the L/LT,urrace plane of M2024-T351 was
similar to that observed for the M2024-T3 sample. Those differences suggested that the reactivity of S-phase IMCs was dependent on the characteristic plane considered for M2024-T351, or that other micro structural parameters had to be taken into account and contributed also to explain the surface Cu coverage values. Nevertheless, as shown above for M2024-T3, a relationship between the surface Cu coverage after the pre-treatment and the anticorrosive properties of the TCP coatings could be established, in agreement with literature [15]. Firstly, the high surface Cu coverage measured for the M2024-T351 samples (LT/ST and L/LTcore planes) could be related to the lower anticorrosive
properties measured for the TCP coatings formed on these samples compared to both the TCP coated M2024-T3 and L/LT,urrace plane of
M2024-T351 thick plate. Then, the higher surface Cu coverage mea sured for the LT/ST plane of M2024-T351 for deoxidation 2 solution, as compared to deoxidation 1 solution, could be related also to the lower corrosion resistance measured for the sample deoxidised with deoxidation 2 solution, as shown by NSST but also impedance mea surements. To better understand such a relationship, the morphology of the TCP coatings was studied, considering both the surface Cu emich ment and the roughness of the TCP coating / alloy interface, but also the thickness and homogeneity of the TCP coating.
3.3. Analysis of the morphology of the TCP coalings: thickness and homogeneily, roug/mess of the TCP coating / alloy interface and Cu eroichment
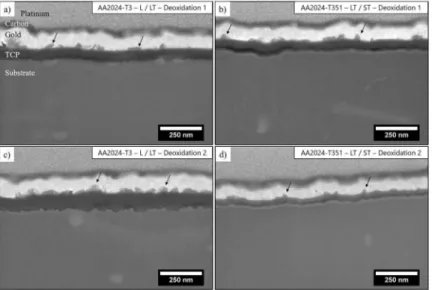
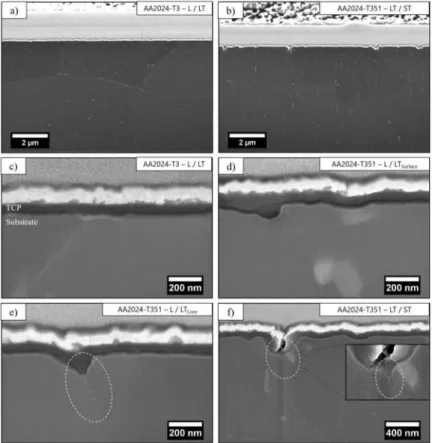
SEM-FEG micrographs of cross-sections of TCP coatings formed on M2024-T3 and M2024-T351 (plane LT/ST), for both deoxidation 1 and deoxidation 2 solutions, are reported in Fig. 5. For ail samples, the post-treatment PACS generated a particular morphology at the TCP coating surface characterised by rare earth element-rich lamellar par ticles (shown by the black arrows), with a similar size for both deox idation solutions [34]. Under this lamellar-structured layer, the TCP coatings appeared more or Jess homogeneous for ail samples. For deoxidation 1 solution, the TCP coating thickness was about 110 nm for both M2024-T3 and M2024-T351 (the vertical scale is different from
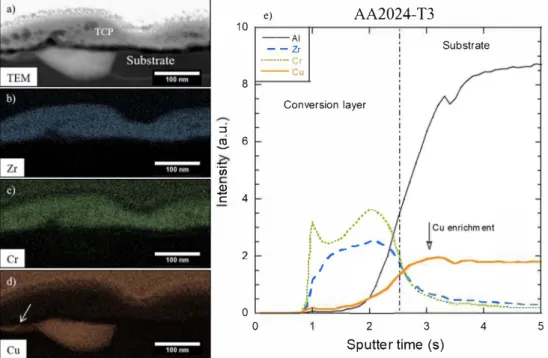
the horizontal scale due to the tilt for SEM-FEG observations). By comparison to deoxidation 1, with deoxidation 2 solution, the thickness of the TCP coating increased significantly (about 145 nm) for T3, whereas it decreased significantly for the LT/ST plane of M2024-T351 (about 80 nm). Comparison with the results obtained for the anticorrosive properties (Figs. 1-3) showed that there was not a trivial thickness / anticorrosive properties of the TCP coating relationship. In particular, the lower anticorrosive properties of the TCP coating forrned on M2024-T351, for deoxidation 1 solution, compared to M2024-T3, could not be explained only by considering the thickness of the TCP coatings. Results clearly showed that other parameters had to be taken into account. Fig. 5 also showed that, for both deoxidation solutions, the adherence of the TCP coatings on the alloys was better for M2024-T3 than for M2024-M2024-T35 l. It is important to note here that ail FIB preparations were done in a similar way. Even though some artifacts cannot be completely avoided due to FIB preparation, there was no reason to have more artifacts for M2024-T351 as compared to M2024-T3. Therefore, observations clearly showed a stronger de tachment of the TCP coating formed on M2024-T351 as compared to M2024-T3, even though it was difficult to quantify this phenomenon because artifacts due to the FIB preparation could not be completely avoided. Moreover, independently of the deoxidation solution, for M2024-T351 samples, a well-marked white layer was observed at the TCP coating / alloy interface; il was Jess visible for M2024-T3. Local EDS analyses showed that it was a Cu layer. To confirrn the identifi cation of this white layer, cross-sections of the TCP coatings were ob served by TEM, and EDS maps were plotted. Figs. 6 and 7 show the TEM observations and associated Zr, Cr and Cu maps for the coated M2024-T3 and M2024-M2024-T351 samples, respectively (for deoxidation 2 solu tion). Results allowed to identify a Cu-rich layer at the interface TCP coating / alloy for both M2024-T3 and M2024-T351 samples (shown by the white arrows in Figs. 6d and 7d, respectively). Moreover, GD OES analyses confirmed a Cu emichment at this interface for both M2024-T3 (Fig. 6e) and M2024-T351 (Fig. 7e). Finally, Cu maps, obtained in the same conditions for the two alloys, clearly showed that the Cu-rich layer was more visible for M2024-T351, as compared to M2024-T3, in agreement with the higher surface Cu coverage mea sured for M2024-T35 l (Fig. 4 ). Viroulaud showed that the kinetics of TCP coating growth depended on the surface Cu coverage: a high
Fig. 5. SEM-FEG observations of cross-sections obtained for TCP coated AA2024 samples. a) AA2024-T3 (L/LT) and b) AA2024-T351 (LT/ST) for deoxidation 1 solution; c) AA2024-T3 (L/LT) and d) AA2024-T351 (LT/ST) for deoxidation 2 solution.
10 8 :::J � 6
ïii
2
C 4
2 00
e)AA2024-T3
--Al --Zr Substrate ···-··-cr--
e
u
Conversion layer1
.. ···
·
··
• ...
:\
..
·
1 ••
•••
••
_
.,.....
( I .I' -1f,
,
·
-i,,
·
--::-
••
�
-
-
- -
.:::.,
;
,:
__
7.:_ 2 3Sputter time (s)
4
5
Fig. 6. a) TEM images and b),c) and d) TEM-EDS maps (Zr, Cr and Cu, respectively) of the TCP coating formed on AA2024-T3. e) GD-OES profiles of Al, Zr, Cr and Cu for the TCP coated AA2024-T3.
·a)---�
TCP
11111
Substralc
�
10
8
:::J � 6ïii
2
C 4
2
0e)
AA2024-T35 l
--Al --Zr Substrate ····-··Cr--
eu
Conversion layer2
3
Sputter time (s)
4 5Fig. 7. a) TEM images and b),c) and d) TEM-EDS maps (Zr, Cr and Cu, respectively) of the TCP coating formed on the LT/ST plane of the AA2024-T351. e) GD-OES profiles of Al, Zr, Cr and Cu for the TCP coated LT/ST plane of the AA2024-T351.
X. Verdalet-Guardiola, et aL
a)
AA2024-T3 - L/ LT
500 nmAA2024
-
T3
-
L / LT
500 nmAA2024 T351 L / LT
500 nmAA2024
-
T351
-
LT
/ ST
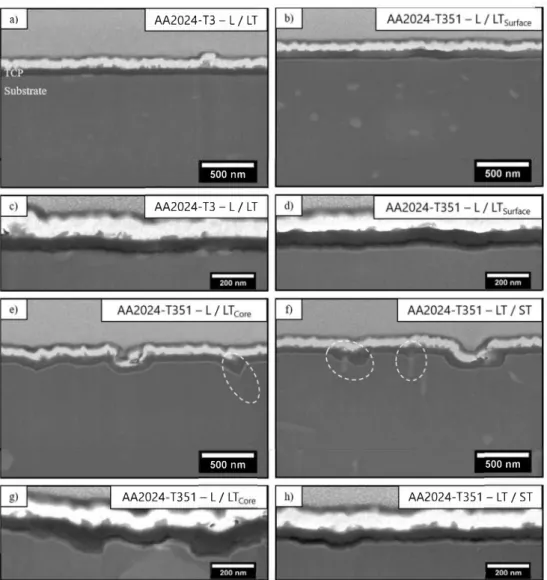
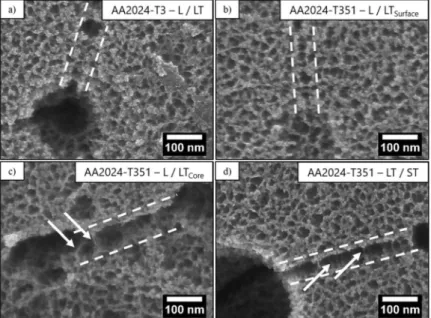
Fig. 8. SEM-FEG observations of cross-sections obtained for TCP coated AA2024 samples. a) AA2024-T3 (L/LT), b) AA2024-T351 (L/LT,mfaœl, c) close-up for a), d) close-up for b), e) AA2024-T351 (L/LTeo,J, f) AA2024-T351 (LT/ST), g) close-up for e), h) close-up for f). Deoxidation was performed with deoxidation 1 solution.
surface Cu coverage could be associated witb a fast kinetics of coating growtb, which could lead to thicker TCP coatings, but it could be mainly related to more defective coatings with lower anticorrosive properties [21]. Such an approach would be helpful to explain the anticorrosive properties deterrnined before, with results leading to an impossibility to establish a clear relationship between tbe tbickness of tbe TCP coatings and tbeir anticorrosive properties. Furtberrnore, it could be useful also to understand tbe relationship between the surface Cu coverage and tbe morphology of tbe TCP coating, considering that a high surface Cu coverage could be eitber associated witb a tbick TCP coating and/or defective (e.g., delaminated, cracked) coating. In order to go furtber with tbis analysis, cross-sections of tbe TCP coatings forrned on tbe different planes of AA2024-T351 were observed by using SEM-FEG, for deoxidation 1 solution (Fig. 8). Observations for AA2024-T3 are reported for comparison. An accurate observation of tbe TCP coating / alloy interface for ail samples showed that i) locally, tbe TCP
coating could be tbicker for AA2024-T351 samples, in particular for L/ L T ,me and L T /ST planes, ii) tbe roughness of tbe interface was higher and tbe adherence of tbe TCP coating to tbe substrate was lower for L/ LT,me and LT/ST planes of AA2024-T351, and iii) tbe Cu layer was well-marked for AA2024-T351 samples and much Jess visible for AA2024-T3. Therefore, results clearly showed that a high surface Cu coverage was most often associated witb detachment of tbe coating from tbe substrate. Moreover, tbe local increase in the tbickness of the TCP coating for AA2024-T351 samples (L/LT,0,.. and LT/ST planes) could be related to high local Cu concentration. An accurate observa tion of Fig. Se and f showed tbat tbe zones where tbe TCP coating was locally tbicker were often associated witb tbe presence of Cu-rich par ticles identified as Cu-rich intergranular precipitates (circles in Fig. Se) or Al-Cu-Mn dispersoids (circles in Fig. Sf). Those observations strongly suggested tbe influence of Cu on tbe kinetics of coating growtb. Fur tberrnore, tbey also suggested tbat tbe surface Cu coverage had to be
explained probably considering the reactivity of both the intragranular Cu-rich IMCs, but also that of the Cu-rich solid solution, in relation with the presence of Cu-rich dispersoids, and of the Cu-rich intergranular precipitates, when present in the material, as previously said. This was discussed later in the manuscript (paragraph 3.4.). Finally, the ob servation of more defective TCP coatings, i.e. Jess homogeneous in thickness and Jess adherent to the substrate, for both L/LTcore and LT/
ST planes of AA2024-T351, was relevant considering the lower corro sion resistance measured for those samples (Figs. 1 and 2), and con firmed that the anticorrosive properties of the TCP coatings could not be explained by considering their thickness only. The results were therefore in agreement with literature, Cu acting as a catalytic agent and generating many defects in TCP coatings [15,21,22,29,35]. This might be explained by considering that a strong kinetics of coating growth should generate internai stresses leading either to the formation of cracks or to the detachment of the coating from the surface. In the last case, the TCP coating should stop growing, after having begun growing faster. This should explain why very thick TCP coatings were not observed systematically on surfaces with a high surface Cu cov erage.
3.4. Identificatwn of the critical microstructural parwneters
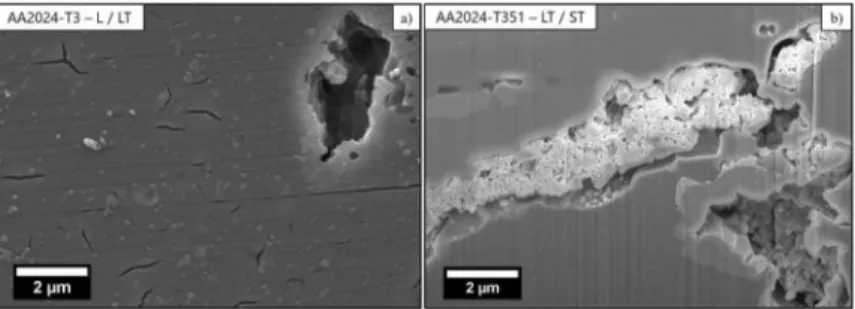
The results shown above clearly demonstrated that the morphology and anticorrosive properties of the TCP coatings formed on AA2024 samples could be explained, at least partially, considering the surface Cu coverage measured after the pre-treatment step. Literature showed that the Cu deposits observed after the pre-treatment can be related to the reactivity of S-phase IMCs [36]. As previously said, in the present study, SEM-FEG observations confirmed the reactivity of S-phase IMCs, with the surface area covered by S-phase IMCs in AA2024-T3, that decreased from 0.8 % for uncoated samples to 0.3 % and 0.1 % after degreasing followed by deoxidation 1 and deoxidation 2 solutions, re spectively. Therefore, after the pre-treatment, the major part of S-phase IMCs was dissolved for AA2024-T3 for deoxidation 2 solution (Fig. 9a), leading to Cu redeposition, and then to an increase in the surface Cu coverage as compared to uncoated samples. The results are not shown for deoxidation 1 solution but they were similar. However, for AA2024-T351, independently of the metallurgical planes, results showed sig nificant differences in the reactivity of S-phase IMCs. For deoxidation 1 solution, the major part of S-phase IMCs (fraction of surface area cov ered by these particles in uncoated samples of about 0.8 %, as for AA2024-T3) was dissolved also (not shown), but, for deoxidation 2 solution, the reactivity of S-phase IMCs led to the presence of Cu-rich sponges after degreasing and deoxidation (Fig. 9b). Such a difference in the reactivity of the S-phase IMCs between the two alloys could be explained firstly considering their size: for AA2024-T3, the mean sur face area covered by one S-phase !MC, i.e. the mean size of one particle, was 2.4 µm2, whereas it was 44 µm2 for AA2024-T351, which was
probably due to the fragmentation of S-phase IMCs during the
cold-rolling pass for AA2024-T3. Wang et al. clearly showed that there was an influence of the particle size on their reactivity and the dissolution of the matrix around [37]. However, it is true that the study performed by these authors was focused on small particles. Therefore, the most re levant explanations could be found referring to the work of Parvizi et al., who showed that dislocation structures were observed around the IMCs; during exposure to an aggressive solution, those structures acted as pathways for corrosive species and led to enhanced local dissolution processes [38,39]. The dislocation structures were clearly dependent on the !MC size; in that way, the !MC size could affect the electrochemical processes that occurred at the IMCs sites. Concerning now the differ ences observed depending on the deoxidation solutions, what could be thought is that the fragmented particles of AA2024-T3 are small enough to be easily removed during pre-treatments, whatever the deoxidation solution, as shown before with surface area covered by the IMCs after pre-treatments of 0.3 % and 0.1 % for deoxidation 1 and deoxidation 2 solutions, respectively. Therefore, the Cu deposition related to the IMCs was globally similar whatever the deoxidation solution. This suggested that other microstructural parameters had to be consider to explain the slight difference in surface Cu coverage measured after the pre-treat ments for AA2024-T3. The difference in the dissolution rate of the matrix (50 nm min - l and 0.2 nm min - l for deoxidation 1 and 2, re spectively) could explain the lower Cu surface coverage for deoxidation 2, which could be also related to the increase in corrosion performances measured for deoxidation 2 as compared to deoxidation 1. Never theless, it can be remembered here that the difference in surface Cu coverage was small, from 1. 1 ± 0.3 to 1. 9 ± 0.3 % after deoxidations 2 and 1, respectively, which could also explain that no significant dif ferences in corrosion performances were observed between deoxida tions 1 and 2 by using polarisation curves. For AA2024-T351, sig nificant differences were observed concerning the dissolution of the IMCs as indicated before. Those differences could be also linked to the aggressivity of the two deoxidation solutions, with a lower etching speed for deoxidation 2 as compared to deoxidation 1, that could be significant here because of the larger size of the IMCs in AA2024-T351 as compared to AA2024-T3. After deoxidation 2, the Cu-rich sponges observed for AA2024-T351 (Fig. 9b) probably contributed significantly to the high surface Cu coverage measured after the pre-treatment step (Fig. 4), as shown by Qi et al. [36]. This could be related to the decrease in corrosion performances measured for AA2024-T351 after deoxida tion 2 as compared to deoxidation 1.
However, as indicated previously, the relationship between the surface Cu coverage, the thickness of the TCP coating, and finally its anticorrosive properties was not trivial. Indeed, after deoxidation 1 treatment, the global thickness of the TCP coatings formed on AA2024-T3 and the LT/ST plane of AA2024-AA2024-T351 was similar (Fig. Sb), whereas the surface Cu coverage was significantly higher and the corrosion performances lower for AA2024-T351 as compared to AA2024-T3. After deoxidation 2, the TCP coating formed on the LT/ST plane of AA2024-T351 was Jess thick, despite of a significantly higher surface Cu
Fig. 9. SEM-FEG observations of AA2024 samples after degreasing and deoxidation (deoxidation 2 solution). a) AA2024-T3 sample. b) AA2024-T351 (LT/SD sample.