Open Archive TOULOUSE Archive Ouverte (OATAO)
OATAO is an open access repository that collects the work of Toulouse researchers and
makes it freely available over the web where possible.
This is an author-deposited version published in :
http://oatao.univ-toulouse.fr/
Eprints ID : 16796
To link to this article : DOI : 10.1016/j.surfcoat.2016.02.004
URL :
http://dx.doi.org/10.1016/j.surfcoat.2016.02.004
To cite this version :
Magalhaes, Candida Anna Patricio and Ansart,
Florence and Taberna, Pierre-Louis and Bonino, Jean-Pierre
Electrophoretic deposition of hybrid film on aluminium 2024 using
sol–gel boehmite nanoparticles. (2016) Surface and Coatings
Technology, vol. 289. pp. 165-171. ISSN 0257-8972
Any correspondence concerning this service should be sent to the repository
administrator:
staff-oatao@listes-diff.inp-toulouse.fr
Electrophoretic deposition of hybrid film on aluminium 2024
using sol–gel boehmite nanoparticles
C.A. Patricio Magalhaes
⁎
, F. Ansart, P.L. Taberna, J.P. Bonino
Centre Inter-universitaire de Recherche et d'Ingénierie des Matériaux (CIRIMAT), Université Paul Sabatier, 118 route de Narbonne, 31062 Toulouse, France
a b s t r a c t
The realisation of organic/inorganic coatings on metal substrates, prepared by sol–gel route and shaped by elec-trophoretic deposition (EPD), is a new process which has been the subject of only few studies. In the past few years, EPD became a very interesting deposition technique because it showed some important advantages: i) great control of the deposition rate and ii) good coverage of complex shape parts. Both are the main challenges for all kinds of deposition techniques, used in various fields from anti-corrosion to anti-wear. In this work, the electrophoretic deposition was performed in aqueous sol suspension containing sol–gel boehmite nanoparticles (NPs). The influence of the applied voltage and deposition time on the deposit thickness was studied. The effect of the concentration of NPs, added in the precursor sol, on the thickness was also investigated. The deposition was performed at constant voltage between −1.2 and −3.5 V during constant deposition time between 10 and 40 min. It is shown that an increase in the applied voltage and deposition time increased the thickness of the de-posit film (from 2 to 11 μm), as well as the amount of evolved hydrogen, resulting in a drop of the formed coatings quality (more porous structure). However, increasing the concentration of NPs in the precursor sol, increased the coating thickness and turned out to be also a key parameter to control the thickness. Finally, it was demonstrated that a perfect control of the microstructure and the deposit thickness was achievable, thanks to both EPD param-eters and sol properties.
Keywords: Electrophoretic deposition Hybrid coating Sol–gel Aluminium 1. Introduction
Sol–gel process is considered as an effective technique to realise various protective coatings (corrosion[1,2], wear[3]) and functional ones (with optical and electrical properties) to improve or modify the properties of the substrate. A well-known technique is dip-coating which permits to cover and protect a substrate by a (nano)structured layer (deposits structured at a nanoscale and obtained by a wet route, in opposition to the ones obtained by dry processing) and is highly used for a broad range of applications (photovoltaic cell, corrosion protection of metallic substrates).
Even though coatings achieved by dip-coating method are well adapted to control deposits on planar substrates[4,5], this method falls short to realise homogeneous deposit on 3D shaped substrates: areas with a greater and thinner thickness are often found on this type of piece.
One way to solve this issue is to use of electrophoretic deposition (EPD). This deposition technique is widely used in industry[6]because it permits to obtain both greater thicknesses (more than hundreds of microns) and more compliant deposits than those achieved by dip-coating. However, EPD process is also known for obtaining thin
and multilayer film of controlled thickness on substrates of complex ge-ometry, which is particularly interesting for various applications includ-ing corrosion or wear protection. The principle of this deposition technique is the use of an electric field to make particles deposit on the substrate; nevertheless, the substrate must be conductive and the dispersion must show a non-null zeta potential. Kinetics of deposition have been described elsewhere using the so called Hamaker's equation
[7,8], where the deposition rate dm/dt (in g cm−2s−1) is a function of
several parameters:
dm=dt ¼ CÅ" μe" E: ð1Þ
For short deposition times, this equation can be further simplified:
Δm=Δt¼ CÅ" μe " E ð2Þ
dl=dt ¼ CÅ" μe " E! "= Að " ρÞ ð3Þ
- The concentration of NPs C° (mol L−1) and the electrophoretic
mobility μe(cm2V−1s−1) are parameters relative to the suspension;
- The electric field E = U / d (V cm−1) and the deposition time ∆ t
(min), are parameters relative to deposition process;
⁎ Corresponding author.
E-mail address:magalhaes@chimie.ups-tlse.fr(C.A.P. Magalhaes).
- And ρ = Δm / (A · Δl), where A is the studied area, Δm the deposit mass and Δl the thickness of the deposit formed.
Nowadays, EPD technology has been studied and successfully ap-plied in many scientific fields, particularly in materials sciences from which a large variety of materials (including electronic materials[9, 10], biomaterials[11], etc.) and coatings (protective film on metallic substrates for example[12]) can been obtained. For the last application, EPD has been widely used from aqueous or organic suspensions of ox-ides, as TiO2[13,14], ZnO[15]or Bi2O3[16]. Several approaches have
been investigated and reported in the literature about the use of EPD from a sol: in general, these studies deal with the synthesis of particles suspension, by sol–gel method, and their dispersion in a solvent[17, 18]or by the dispersion of commercial suspensions directly into the precursor sols[19,20].
The present work reports the use of EPD from an organic–inorganic sol which consists of a mixture of aluminium alkoxide and organoalkoxysilane where sol–gel boehmite nanoparticles are incorpo-rated and dispersed. These particles were chosen because they present a chemical compatibility with the studied substrate and they are used, here, as a vector to move the sol to the corresponding electrode.
The objective of this work is to obtain a homogeneous and controlled thickness coating on aluminium alloy by using the hybrid sol as medium and EPD as process. Furthermore, this work allows the combination of the advantages of sol–gel process (corrosion protection or optical properties for example) with the advantages of EPD (increasing coating thickness) in order to obtain deposits with both benefits, which were particularly in-teresting for various applications already mentioned before.
2. Materials and methods 2.1. Substrate preparation
An AA2024 aluminium alloy was used as the substrate, with the alloy composition reported inTable 1. Prior to surface treatment, the AA2024 was entirely covered with an epoxy-based insulating cover. After drying, this cover is partly removed on one area of 10.5 cm2
(3.5 × 3.0 cm2) to treat only the surface of interest. The surface
treat-ment is then divided into 3 steps: first, the surface was degreased with acetone for 1 min, this step was immediately followed by alkaline etching at 40 °C in a sodium hydroxide bath, with a concentration of 25 g L−1(NaOH, VWR Chemicals), for 5 min to remove the native
alu-minium oxide layer. The final step was to repassivate the substrate in
a nitric acid solution of 25 vol% (HNO3, SIGMA-ALDRICH 69%) for
2 min. Aluminium substrates were then rinsed with deionised water, ethanol and dried at room temperature with compressed air. The obtained samples have an average roughness (Ra) of 0.43 ± 0.05 μm,
measured by Zygo optical interferometer 3DMetro Pro. 2.2. Sol and coating preparations
Concerning the sol formulation, the raw materials were 3-glycidyloxypropyltrimethoxysilane (GPTMS, SIGMA-ALDRICH ≥98%) and aluminium-tri-sec-butoxide (ASB, SIGMA-ALDRICH 97%) prepared with propan-2-ol (IPA, FISHER CHEMICAL 99.9%) as solvent. Finally, dis-tilled water containing nitrate cerium (Ce(NO3)3.6H2O, ACROS
OR-GANICS 99.5%), with a Ce/Al molar ratio fixed at 0.01, was incorporated to produce the hydrolysis/condensation reaction. The sols were prepared keeping the respective volumetric ratio of GPTMS: ASB: propane-2-ol: distilled water at 2:1:0.1:2. The solution was kept under stirring for 1 h. Then, it was mixed with a solution of boehmite nanoparticles (NPs) keep-ing the volumetric ratio of sol:NPs at 1:2. Boehmite nanocrystalline parti-cles (NPs) were synthesized by hydrolysis of aluminium sec-butoxide (ASB, SIGMA-ALDRICH 97%) according to the Yoldas method[22]. We ob-tained a transparent suspension of boehmite nanoparticles with a pH value of 4.5. The aluminium concentration in the sol was 0.51 mol L−1,
determined by weight loss after ignition at 800 °C for 2 h[23]. The mix-ture was stirred again for 30 min and aged for 24 h at room temperamix-ture. The obtained sol showed a pH value around 4 and a positive zeta poten-tial suitable for cathodic deposition[24].
A three electrode cell arrangement was used for EPD. The working electrode (cathode) was an aluminium 2024 foil with a deposition area of 10.5 cm2(3.5 cm × 3.0 cm) and the counter electrode was a platinum
foil with the same surface area as the cathode electrode. Both electrodes were placed vertically and parallel to each other. They were separated by a distance of 1.5 cm and immerged into the sol. At last, the reference elec-trode was a saturated calomel elecelec-trode (SCE) and placed next to the working electrode. Then, deposition experiments were performed under constant voltage condition (from −1.2 to −3.5 V) and for a con-stant deposition time (from 10 to 40 min). After deposition, the coatings were withdrawn from the bath at a constant speed of 10 mm min−1; a
low withdrawal rate was used to minimise the dipping contribution to the total thickness. However, for each experiment, a control sample, shaped by simple dip-coating and withdrawn at the same constant speed, allowed a better characterisation of EPD thickness. Finally, each coating underwent a heat post-treatment, including a drying process at 50 °C during 1 h and a densification process at 110 °C during 4 h. 2.3. Characterisation techniques
The thickness of the coatings obtained by EPD and dip-coating (con-trol sample used here as reference) were measured by a Dualscope FMP20 (Fischer, Germany) and JEOL JSM-6510LV scanning electron mi-croscope, with an operating voltage of 20 kV.
Table 1
Chemical composition of the aluminium alloy 2024 in weight%[21].
Element Si Fe Cu Mn Mg Cr Zn Ti Al
Weight % min – – 3.8 0.30 1.2 – – – Balance Weight % max 0.50 0.50 4.9 0.9 1.8 0.10 0.25 0.15 Balance
The physical properties of the sol were controlled by measuring the viscosity with a LamyRM-100 rheometer, the pH and the conductivity with an Eutech instruments cyberscan.
The surface analyses were carried out with a Keyence VH-Z100R 3D optical microscope. The topographic observations were performed by a 3D Zygoprofilometer interferometric 3D Metro Pro; the parameters studied were arithmetical mean of the roughness profile (Ra) and pro-file skewness (Rsk). All the surface observations were performed after
a gold sputtering of the surface during 30 s with a Cressington sputter coater, in order to evaluate the topography of the extreme surface after deposition.
3. Results and discussions
3.1. Comparison between coatings produced by dip-coating (DC) and electro-phoretic deposition (EPD) from a same hybrid sol: interest of the EPD process In order to justify the interest of the EPD process instead of dip-coating, deposits have been performed on a plane aluminium substrate using both deposition techniques with the same hybrid sol (the
preparation was described in Section2.2). EPD coating was realised under a constant voltage of − 3 V and a deposition time of 30 min. The coatings simply shaped by dip-coating as well as by EPD were with-drawn from the hybrid bath at a constant speed of 10 mm min−1. InFig.
1, two scanning electronic micrographs of the deposit thickness obtain-ed by both processes are presentobtain-ed. We could clearly see that EPD (Fig. 1(a)) lead to homogeneous coating with larger thickness than those achieved by dipping (Fig. 1(b)). The thickness only reached 1 μm by dip-coating, whereas by EPD, the thickness reached 8 μm. This ability to form thicker films shows the major interest of the EPD technique, particularly for applications such as anti-corrosion, anti-wear etc.…. Furthermore, knowing that with EPD technique the structure and the thickness of films depend on the value of the EPD parameters (electrical and deposition parameters), a good control of the thickness and mor-phology of the coating could be obtained by adjusting the depositions conditions: this point will be interested to raise and particularly discussed on the next paragraph.
Finally, the dip-coating sample was defined here as a control sample to allow a better characterisation of EPD thickness to the total thickness formed (dip-coating + EPD).
Fig. 2. Scanning electronic microscopy (SEM) of (a) deposit obtained from sol with boehmite particles and of (b) deposit obtained from sol without boehmite particles.
3.2. Effect of nanoparticles in the sol and its physico-chemical properties under electric field
To point out the key role of boehmite nanoparticles on the coating formation, a study was performed with the same precursor sol de-scribed in Section2.2, but without nanoparticles. In fact, if we compare two scanning electronic micrographs (Fig. 2) obtained under the same conditions (applying voltage of −3 V (vs SCE), during 30 min) from a sol with or without boehmite particles, the deposit thickness is respec-tively around 8 μm and 4 μm. This difference of thickness proves the key role of the boehmite particles on the formation of the deposit but it also shows that, without NPs, a phenomenon occurs at the interface: a sol destabilisation near the electrode, which causes the formation of a part of a deposit. This point will be discussed later on.
However a change of sol characteristics under electric field cannot be define precisely since a viscosity increase could take place. To get some clues regarding this aspect, a NMR study analysis was performed. The NMR spectroscopy provides detailed information about the molec-ular composition and the microstructural features of a material, which is particularly interesting to follow polymerisation (condensation rate) of the sol–gel organic/inorganic network. In this work, a NMR Si29study
was carried out in order to see if an ageing of the sol (acceleration of the condensation rate) could occur under electric field. To complete this study, the physical properties of the sol (evolution of pH, conductivity and viscosity), without and under an electric field, were also investigated.
Fig. 3Reported the different NMR spectra obtained for different sol having undergone different EPD times.
As it can be seen inFig. 3, no NMR spectra variation was observed re-lated to the time of the voltage (for time b90 min). Each peak of the NMR spectra (T0, T1, T2and T3) was correlated to a range of chemicals
displacements ζ and represents the environment of the Si atom. T0, T1,
T2and T3correspond to the different silicon atoms involved in different
amounts of Si–O–Si bonds, which results in different condensation rates of the organic network. After integrating the area under different peaks (Table 2), the condensation rate CR (%) could be calculated using the following equation (Eq.(4)):
CR %ð Þ ¼1 3 T1 T0 þ T1 þ T2 þ T3þ 2 3 T2 T0 þ T1 þ T2 þ T3 ð Þ þ T3 T0 þ T1 þ T2 þ T3 ð Þ: ð4Þ
The values of the condensation rate are given inTable 2and were around 67% in all cases of electrophoresis duration.
Besides, as we can see in supplementary information, the pH, viscos-ity and conductivviscos-ity remain quite constant (respectively 4, 9 mPa s and 650 μS cm−1
): electrophoresis process does not influence these physico-chemical parameters (Fig. A1, A2 and A3).
Finally, the overall results show that no ageing of sol under the electric field occurs, whatever the time.
3.3. Influence of voltage (vs SCE) and deposition time on the coating thickness
The variation of the coating thickness under different applied poten-tials during different deposition times is shown inFig. 4. It is noticed that except for applied voltage of − 3 V (vs SCE), coating thickness variation does not increase as expected by Hamaker's equation. It is believed that water electrolysis occurring upon electrode polarisation is responsible for the poor deposition yield observed here.
Fig. 5presents the electrochemical behaviour of the hybrid sol which contains 0.51 mol L−1of boehmite nanoparticles. It showed there is no
water splitting when the applied potential is above − 1.2 V (vs SCE) whereas water electrolysis occurs when potential is below −1.2 V (vs SCE). Since it is a cathodic process, water electrolysis leads to hydrogen
Table 2
Chemical displacement and condensation rate of the spectrum of Si29for different durations of electrophoresis with an applied voltage of −3 V vs SCE. Electrophoretic parameters
U(V) t(min)
Chemical displacement (ζ) range (ppm) Condensation rate, CR (%) T0 ζ = −38/−41 T1 ζ = −45/−51 T2 ζ = −54/−61 T3 ζ = −62/−70 0 0 0.1 1.0 1.6 1.3 67.0 3 20 0.1 1.0 1.7 1.3 67.1 3 50 0.1 1.0 1.6 1.2 66.8 3 90 0.1 1.0 1.7 1.2 67.2
Fig. 4. Evolution of the deposit thickness with time for different applied voltages (vs SCE).
Fig. 5. Voltammetry curve of the hybrid sol contained 0.51 mol L−1of boehmite nanoparticles.
formation with an increase of pH value. The last phenomenon comes along with the formation of hydroxide ions, according to Eq.(5), and causes a destabilisation of the sol that is near the surface of the elec-trode. This local pH increase of the sol could affect the kinetic of the hy-drolysis and condensation reaction which lead the growth of the polymeric network and determine the final characteristics of the gel ob-tained. However, the zeta potential of the boehmite particles, which represents the surface charge of a particle, is strongly dependent on the pH[24,25]: so, a local increase of the pH value could also disturb the deposition of the boehmite nanoparticles. InFig. 5we can clearly observe that, for potential range between −1.2 V to −2.8 V (vs SCE), a slow hydrogen evolution leads to a reduced kinetics of deposition. On the other hand, at potential of − 3 V (vs SCE) a large hydrogen evolution caused by water reduction is observed and leads to a thicker coating. The coating became poorly adherent when the applied voltage further decreased to a value lower than −3 V (vs SCE)), which indicated that water electrolysis is a key point and has to be constrained. 2H2O þ 2e
−
¼ NH2þ 2OH‐ ð5Þ
3.4. Influence of the nanoparticles concentration [NPs]
In order to link the nanoparticles concentration to the deposit thick-ness, the stock solution was diluted or evaporated to achieve several
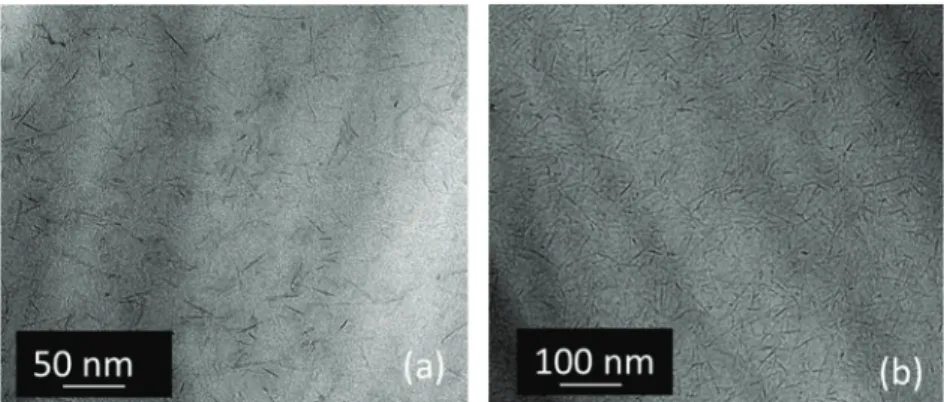
particle concentrations: from 0.38 to 0.89 mol L−1.Fig. 6shows two
TEM micrographs of the coating obtained from sols containing different boehmite nanoparticles [NPs] concentration (0.51 mol L−1 and
89 mol L−1for Figure (a) and (b) respectively) while keeping other
pa-rameters under the same conditions (applied voltage of −3 V (vs SCE) during 30 min). Both TEM micrographs show that boehmite nanoparti-cles, (appear as laths in the figures) are homogeneously distributed in the hybrid matrix. It has confirmed that the evaporation process did not affect nor the morphology neither the organisation of the boehmite nanoparticles.
Furthermore, the evolution of pH, conductivity and viscosity of each sol before (A) and after electrophoresis (B) were investigated (shown inTable 3). It is noticed that, for sol concentration ranging from 0.51 mol L−1to 0.89 mol L−1, both the conductivity and the
viscosity increased with concentration (from 660 to 790 μs cm−1
and from 11 to 14 mPa s, respectively) while the pH value remained unchanged.
InFig. 7, two scanning electronic micrographs of samples obtained from different boehmite nanoparticles concentration under the same applied potential and deposition duration (− 3 V (vs SCE) during 30 min) were compared. The deposit thickness of sample obtained from sol with higher NPs concentration is significantly higher. For the sake of clarity, only two concentrations were compared.
The thickness of the deposition tripled as the NPs concentration was double (Fig. 7).
Fig. 6. Transmission electronic microscopy (TEM) of deposit obtained from sol with boehmite concentration of (a) 0.51 mol L−1and (b) 0.89 mol L−1.
Table 3
The pH value, viscosity and conductivity for 4 different boehmite sol concentration before (A) and after (B) electrophoresis. [NPs] mol L−1 0.38 (A) (B) 0.51 (A) (B) 0.76 (A) (B) 0.89 (A) (B) pH 3.62 3.61 3.59 3.61 3.70 3.82 3.55 3.52 Viscosity (mPa s) 11.1 11.3 11.2 10.9 10.3 12 13.9 14.1 Conductivity (μS cm−1) 612 620 661 665 709 714 784 789
Since deposition thickness is related to particle concentration, a complete study was conducted for different applied potentials.Fig. 8
shows the evolution of deposit thickness under different applied voltage with the different concentrations (0.38 to 0.89 mol L−1). We can clearly
see that, for a voltage of −3 V (vs SCE), the deposit thickness increased from 5 μm to 24 μm when the concentration of nanoparticles increased from 0.38 mol L−1to 0.89 mol L−1. This graph underlines that the
thick-ness is highly dependent on the nanoparticles concentration, which is an important parameter to control the film microstructure.
In order to understand the deposition phenomena driving this process, it is important to know the evolution of the thickness versus applied voltage for the whole range of concentrations represented in
Fig. 9. It is found that for a voltage range from −1.2 V to −3.5 V, the deposit thickness followed two steps:
i) Firstly, for voltage between 0 and −3 V (vs SCE) (Fig. 9, left), the de-posit thickness increased with nanoparticle concentration. During this step, the deposition thickness is increased linearly with the applied volt-age, as expected from Hamaker equation (Eq.(3)). The results indicated that the deposition rate is directly linked to the particles concentration.
ii) Secondly, for voltage between −3 V and −3.5 V (vs SCE), (Fig. 9, right) the deposit thickness decreased and didn't follow Hamaker's equation anymore, except for the [NPs] = 0.76 mol L−1, which a perfect
linear evolution is observed. The results showed that for each concen-tration, a threshold thickness is reached (depending on the value of concentration) beyond which the deposit is destabilised. Furthermore, an optimal tension can also be determined beyond which the deposit thickness decreases again. These last points could explain why the de-posit thickness for the [NPs] = 0.76 mol L−1still follow the Hamaker
equation whereas the other concentrations don't: at this concentration and for this voltage range, the nanoparticles are not yet destabilised and a deposition process still occurs. Finally, these results show that there is an optimum concentration in an optimum voltage range for which the deposit thickness increases linearly and follows the Hamaker equation. As previously mentioned, EPD under constant electric field offers an easy control of the film thickness by adjusting the operating conditions. However, the use of an aqueous medium induces electrolysis of water which further results in the formation of hydrogen and oxygen gases.
The corresponding microstructure analysed by a 3D optical microscope (Fig. 10) exhibited that the surface of the deposit is strongly disturbed. The evolution of the surface topography by profilometry shows that the surface presents thickness irregularity: Ra = 0.7 μm ± 0.2 μm is not significant compared to the average roughness of the aluminium substrate (0.4 μm ± 0.5 μm) but a negative value of Rsk (−1.2 μm ± 0.5 μm) suggests that the deposit surface presents deep pores. These heterogeneities are obviously related to electrochemical reaction, most likely caused by the hydrogen evolution occurring at the cathode. This incorporation of gas bubbles into the deposit leads to a low deposit quality with bad adherence and microstructural inhomo-geneity, which could deteriorate the expected properties of the film.
Furthermore, the gas bubbles generated at the electrode, due to the water electrolysis could also disturb and decreases the efficiency of the electrophoresis process of the particles, thus limit their deposition. This could explain why with a long electrophoresis time (N40 min), the thickness values decreased. (Fig. 4).
One way to benefit from the advantages of an aqueous medium (en-vironment friendly, low cost), and to limit these surface irregularities is to conduct EPD experiments at potential lower than the decomposition voltage (−1.23 V vs SCE). However, in this case, the deposition rate is negligible. Another method often reported in the literature is to conduct EPD with pulse voltage[26].
It has been reported in the literature[27,28]that working with pulsed voltage, instead of constant voltage allows the formation of
Fig. 8. Histogram evolution of the voltage versus thickness for a sol synthetized with different boehmite sol concentrations and for a deposition time fixed at 30 min.
Fig. 9. Evolution of the thickness versus voltage for a sol synthesized with different boehmite sol concentrations, under constant voltage range from −1.2 V to −3 V (left) and −1.2 V to −3.5 V (right) during a fixed deposition time of 30 min.
thick films and multilayer materials, by using aqueous suspensions without water decomposition: in fact, water electrolysis is lower than in continuous voltage and gas formation can be avoided[28]. The use of a pulsed voltage could limit the amount of bubble incorporation during the electrophoretic deposition, and hence the microstructure of the deposit formed. Besides these authors have been reported that one of the key parameters is the Duty Cycle ( DC ¼TON#
TONþTOFF ). In this regard, currently further investigations are under progress and will be discussed in a next paper.
4. Conclusions
The realisation of sol–gel organic–inorganic coatings on metal substrate by electrophoretic deposition (EPD) was performed. Various factors associated with EPD process such as the deposition parameters (voltage, time) and the characteristics of the suspension (concentration of NPs) have been studied. It has been found that these factors are important and strongly influence the thickness of the coatings. Under constant electric field EPD process offers an easy control of the film thickness by adjusting the operating conditions. The results present that for a voltage of − 3 V (vs SCE), the thickness increased with deposition time and followed the Hamaker's equation, which one was not due to an ageing of the sol under electric field (in a range of time and voltage between respectively 0; 90 min and 0; − 3.5 V (vs SCE)). However, the use of aqueous medium induced electrolysis of water, which disturbs the homogeneity of the deposit. Finally working under square or pulsed voltage could be an alternative to get a good control of the morphology and the thickness of the deposit, thanks to the duty cycle (DC). This study will be discussed in future works.
Appendix A. Supplementary data
Supplementary data to this article can be found online athttp://dx. doi.org/10.1016/j.surfcoat.2016.02.004.
References
[1] N.C. Rosero-Navarro, S.A. Pellice, Surf. Coat. Technol. 203 (2009) 1897–1903. [2] K.A. Yasakau, S. Kallip, Electrochim. Acta 112 (2013) 236–246.
[3] A. Marsal, F. Ansart, V. Turq, J.P. Bonino, Surf. Coat. Technol. 237 (2013) 234–240. [4] J. Esteban, Développement par procédé sol-gel de revêtements anti-corrosion
d'alliages d'aluminium à usage aéronautique : de l'effet barrière à l'auto-cicatrisation, (PhD Thesis) 2011 Univ. Toulouse III, France.
[5] O. Jaubert, Revêtements hybrides multi-fonctionnels élaborés par voie sol-gel pour la protection d'alliages d'aluminium pour l'aéronautique (AA2024 T3), (PhD Thesis) 2012 Univ. Toulouse III, France.
[6] E. Almeida, I. Alves, C. Brites, L. Fedrizzi, Prog. Org. Coat. 46 (2003) 8–20. [7] H.C. Hamaker, Trans. Faraday Soc. 36 (1940) 279–283.
[8] L. Besra, M. Liu, Prog. Mater. Sci. 52 (2007) 1–61.
[9] W. Chiu, K. Lee, W.F. Hsieh, J. Power Sources 196 (2011) (3683–368). [10] F. Smeacetto, A. De Miranda, J. Power Sources 280 (2015) 379–386. [11] L. Cordero-Arias, S. Cabanas-Polo, Mater. Sci. Eng. 55 (2015) 137–144. [12] O. Schneider, J. Grobe-Brauckmann, J. Eur. Ceram. Soc. 30 (2010) 1089–1096. [13] S. Lebrette, C. Pagnoux, J. Eur. Ceram. Soc. 26 (2006) 2727–2734.
[14]A. Chávez-Valdez, M. Herrmann, A.R. Boccaccini, J. Colloid Interface, Science 375 (2012) 102–105.
[15] Y. Huang, D.K. Sarkar, Appl. Surf. Sci. 327 (2015) 327–334. [16] X. Gang, G. Li, Appl. Surf. Sci. 331 (2015) 455–462.
[17] Y. Castro, A. Duran, J.J. Damborenea, Electrochim. Acta 53 (2008) 6008–6017. [18] Y. Castro, B. Ferrari, J. Mater. Sci. 39 (2004) 845–849.
[19] Y. Castro, B. Ferrari, J. Sol Gel, Sci. Technol. 26 (2003) 735–739. [20] Y. Castro, B. Ferrari, Surf. Coat. Technol. 182 (2004) 199–203. [21] URL: http//www.capalex.co.uk/french/2024_alloy_fr.html [22] B.E. Yoldas, J. Mater. Sci. 10 (1975) 1856–1860.
[23] R. Bleta, P. Alphonse, J. Colloid Interface, Sci. 367 (2012) 120–128. [24] S. Novak, K. Konig, Ceram. Int. 35 (2009) 2823–2829.
[25] C.Y. Chen, D.M. Liu, Acta Mater. 47 (1999) 2717–2726.
[26] A. Chavez-Valdez, A. Boccaccini, Electrochim. Acta 65 (2012) 70–89.
[27] L. Besra, T. Uchikoshi, T.S. Suzuki, Y. Sakka, J. Eur. Ceram. Soc. 30 (2010) 1187–1193. [28] L. Besra, T. Uchikoshi, J. Eur. Ceram. Soc. 29 (2009) 1837–1845.
Fig. 10. 3D optical microscopic (a) and topographic (b) observation of the surface gold sputtered deposit shaped by EPD under a constant voltage of 3 V for 30 min with [NPs] = 0.51 mol L−1.


![Fig. 10. 3D optical microscopic (a) and topographic (b) observation of the surface gold sputtered deposit shaped by EPD under a constant voltage of 3 V for 30 min with [NPs] = 0.51 mol L −1 .](https://thumb-eu.123doks.com/thumbv2/123doknet/3126570.88926/8.892.189.719.80.261/optical-microscopic-topographic-observation-surface-sputtered-deposit-constant.webp)
