J. Northw. At!. Fish. Sci., Vol. 7: 67-75
Changes in Size Distribution of Snow Crabs
(Chionoecetes opilio)
in the Southwestern
Gulf of St. Lawrence
Roxane Bouchard, Jean-Claude F. Brethes, and Gaston Desrosiers Department of Oceanography, University of Quebec (Rimouski)
Rimouski, Quebec, Canada G5L 3A 1 and
Richard F. J. Bailey
Fisheries Research Branch, Department of Fisheries and Oceans P. O. Box 15500, Quebec City, Quebec, Canada G1K 7Y7
Abstract
Size distributions of the exploited snow crab (Chionoecetes opilio) population in the southwestern Gulf of St. Lawrence were obtained from commercial landings in New Brunswick ports during 1977-82. The unexploited part of the stock was sampled during research vessel surveys in 1980 and 1981. The size distributions were analyzed by factorial analysis of correspondence. The trend in mean size was negative from 1977 to 1981 and positive thereafter. The analysis identified two periods of recruitment to the standing stock within each year: the first at the beginning of summer and the second in late summer and autumn. Growth of the previously-recruited crabs occurred between these two periods. Analysis of research vessel data indicated that many prerecruits inhabited areas outside the usual fishing grounds. The hypothesis is proposed of recruitment by platoons, with a part being due possibly to migration of crabs from shallow unexploited areas to deeper water where the commercial fishery occurs.
Introduction
The exploitation of snow crabs (Chionoecetes opi-lie O. Fabr.) in the Gulf of St. Lawrence is quite recent but it has grown rapidly. In the southwestern part of the Gulf alone, catches have increased from 624 (metric) tons in 1967 to 28,000 tons in 1982 (Cormier, MS 1984), with a parallel increase in fishing effort from about 2,000 traps to 15,200 traps in 1981 (Lamoureux and Lafleur, 1982). Other changes in fishing activity in the southwestern Gulf of St. Lawrence included continued expansion of the fishing area until 1977 when all favor-able grounds were being exploited, a change in mesh size of trap netting from 108 to 131 mm in 1981, and the shortening of the fishing period since 1980, with fish-ing effort befish-ing now concentrated in sprfish-ing and early summer instead of the previous spring-late autumn period.
Fishing activity has evidently affected the struc-ture of the exploited population. Some aspects of this influence may be observed by studying the pattern of changes in the size distribution with time. Such tem-poral changes may be due to fishing activity in the long-term (multiyear) situation and to such pheno-mena as recruitment (i.e. entrance of new animals to the exploited population) and growth on a short-term scale.
Comparison of size distributions becomes a prob-lem of "shape recognition", for which methods of
fac-torial analysis have been described as efficient tools (Benzecri et al., 1980). Their use is well known in ecol-ogy to give a synthetic global view of a data matrix, but they are not as widespread in fisheries biology. Galois (MS 1975) used both principal components analysis and correspondence analysis to describe aspects of the dynamics of shrimp (Penaeus duorarum) along the Ivory Coast in western Africa. Badia and Dochi (1976), using correspondence analysis, studied a population of mantis shrimp (Squilla mantis) in the Mediterranean Sea, and, in a later study, they defined the age structure and cohorts in the population (Badia and Dochi, 1978). More recently, McGlade and Smith (1983) used princi-pal components analysis to detect variation in struc-ture of the pollock (Pollachius virens) population in the Gulf of St. Lawrence.
Factorial analysis of correspondence was used in the present study to examine changes in size distribu-tion of the snow crab populadistribu-tion in the southwestern Gulf of St. Lawrence. The observed trends are related to present knowledge of fishing activity and the biol-ogy of the species.
Materials and Methods
Only male crabs with carapace widths (CW) of 95 mm and larger are exploited in the Gulf of St. Law-rence. This minimum legal size was originally based on processing considerations. According to Watson
http://journal.nafo.int
49"~---r----r-~-or---'----'----r--1---r---..,.-,
Fig. 1. Snow crab fishing areas in the southwestern Gulf of S1. Lawrence.
(1970), all males are physiologically mature at 80 mm CW and are presumably able to mate at least once before recruiting to the fishery (Elner, 1982). Because females do not grow to the commercial size limit, this regulation is supposed to preserve the reproductive potential of the stock.
The present study involves catches in areas band c combined. Size distributions of snow crabs were obtained from sampling the landings in New Bruns-wick ports during the 1977-82 fishing seasons (Table 1). In spite of the minimum legal size, it is common to observe undersized crabs in the commercial landings. According to a Kruskal-Wallis analysis, it appeared that the variation in abundance of undersized crabs (85-94 mm CW) within years is greater than the varia-tion between years (P<0.05). For that reason, all crabs with CW of 85 mm and larger were taken in account. For statistical purposes, the southwestern Gulf of St. Lawrence is divided into four areas (Fig. 1), based on the fishing effort distribution and bathymetric data: Chaleur Bay (area a), and three gullies west of the Magdalen Islands (areas b, c and d). These are the preferred fishing areas of fishermen from Quebec and New Brunswick (Bailey and Cormier, MS 1983), and they provide more than 50% of the total Canadian catch. The most common gear is a prism-like frame (base 1.5 x 1.5 m, height 0.6 m), with two laterally-opposed entrances. The frames were covered with 108 mm mesh (stretched) netting before 1981 and 131 mm mesh netting in 1981 and thereafter.
o 10 20 30 40 50 km '-' 1 80 ", _., \ '-'-', Malbaie "., Gulf of St. Lawrence
I
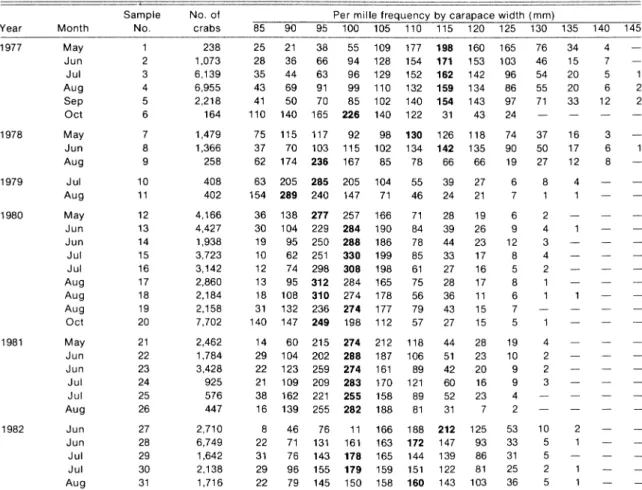
QUEBECTABLE 1. Size frequencies of male snow crabs in commercial landings from the southwestern Gulf of S1. Lawrence, 1977-82. (Indi-cated carapace width is lower limit of the size-class; modal size-groups are inbold type.)
Year Month
Sample No.
No. of crabs
Per mille frequency by carapace width (mm)
85 90 95 100 105 110 115 120 125 130 135 140 145 36 138 277 257 166 71 28 19 6 30 104 229 284 190 84 39 26 9 19 95 250 288 186 78 44 23 12 10 62 251 330 199 85 33 17 8 12 74 298 308 198 61 27 16 5 13 95 312 284 165 75 28 17 8 18 108 310 274 178 56 36 11 6 31 132 236 274 177 79 43 15 7 140 147 249 198 112 57 27 15 5 14 60 215 274 212 118 44 28 19 29 104 202 288 187 106 51 23 10 22 123 259 274 161 89 42 20 9 21 109 209 283 170 121 60 16 9 38 162 221 255 158 89 52 23 4 16 139 255 282 188 81 31 7 2 63 205 285 205 104 55 39 27 154 289 240 147 71 46 24 21 98 130 126 118 102 134 142 135 85 78 66 66 75 115 117 92 37 70 103 115 62 174 236 167 1 2 2 3 6 8 4 7 5 6 12 2 1 16 17 12 4 1 34 15 20 20 33 10 5 5 2 5 4 2 2 3 37 50 27 8 1 2 4 3 4 2 1 1 76 46 54 55 71 53 33 31 25 36 165 103 96 86 97 24 74 90 19 6 7 125 93 86 81 103 160 153 142 134 143 43 188 212 172 147 144 139 151 122 160 143 177 198 154 171 152 162 132 159 140 154 122 31 38 55 109 66 94 128 63 96 129 91 99 110 70 85 102 165 226 140 46 76 11 166 71 131 161 163 76 143 178 165 96 155 179 159 79 145 150 158 21 36 44 69 50 140 8 22 31 29 22 25 28 35 43 41 110 238 1,073 6,139 6,955 2,218 164 1,479 1,366 258 408 402 4,166 4,427 1,938 3,723 3,142 2,860 2,184 2,158 7,702 2,462 1,784 3,428 925 576 447 2,710 6,749 1,642 2,138 1,716 1 2 3 4 5 6 7 8 9 10 11 12 13 14 15 16 17 18 19 20 21 22 23 24 25 26 27 28 29 30 31 May Jun Jul Aug Sep Oct May Jun Aug Jul Aug May Jun Jun Jul Jul Aug Aug Aug Oct May Jun Jun Jul Jul Aug Jun Jun Jul Jul Aug 1982 1981 1980 1979 1978 1977
BOUCHARDet al.: Analysis of Snow Crab Size Distributions 69
Carapace widths were grouped by 5 mm classes and frequencies were expressed as number per thousand. A total of 31 size frequencies, covering a period of 5 years, was analyzed (Table 1).
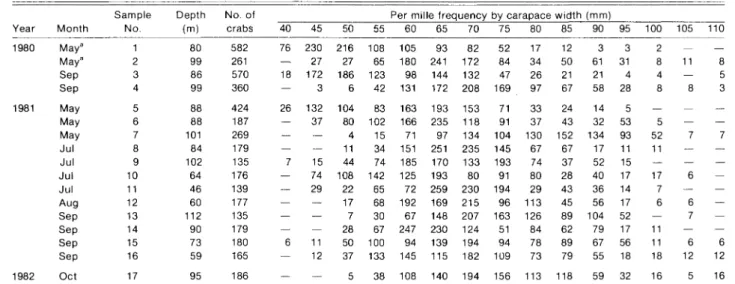
In order to help the interpretation of commercial fishing data, information from the unexploited part of the population was obtained from research vessel sur-veys. They were conducted in Malbaie Bay (48° 39'N, 64° 10'W) on the western limit of area II in 1980 and 1981 (Table 2). In May 1980, samples were collected with a beam trawl, which had 25 mm mesh (stretched) netting in the codend. All subsequent samples were obtained from catches with Japanese conical traps (base 1.2 m diameter, height 0.8 m, entrance at the top) covered with 45 mm mesh netting. Frozen herring was used as bait, and the soak time was about 20 hr (over one night). Measurements from the same generalloca-tions were grouped, resulting in 17 size distribugeneralloca-tions (Table 2).
Size distributions were analyzed by factorial anal-ysis of correspondence (Benzecri et al., 1980), also known as reciprocal analysis (Hill, 1973). This tech-nique is used primarily to analyze contingency tables but also for tables formed by several types of integers. The distance between two rows (i and i') is defined by the chi-square distance:
d2
=
~
K
(S _
~l)
2j=1 Kj Kj Ki '
where kij = frequency observed at the intersection of row i and column j,
p
n
n
pK, = .
L
kij' Kj=.
L
kij' K=
L
L
k..J=1 1=1 i=1 j=1 IJ
n = number of rows, and p= number of columns.
The distance between two columns is calculated in the same way by reversing i and j in the above formulae. By using the calculated distance, the correspondence analysis searches for the best simultaneous represen-tation of rows and columns in a common system of orthogonal axes. In this paper, rows are the sampling periods (or samples) and columns are the size-classes.
Interpretation of the results is based on the projec-tion of points (rows and columns) on the factorial plane created by two axes. Each size-class has a fixed posi-tion which is determined by its average profile within all samples, whereas the positions of sampling periods are modified, depending on their size frequency struc-ture. In this dual representation, it is possible to observe groups of samples which have similar size profiles and a particular size-class can be observed near a group of samples where it is well represented.
The main advantage of this technique is that it provides an overall view of variations in the size distri-butions, which is not the case with simple comparison of means. The use of chi-square distance ensures a certain stability of the results while constructing the data matrix. The combination of two size-classes with identical profiles does not modify the distance between two samples. It follows that the choice of a particular width-class interval is not as crucial as in modal analysis.
The computer program that was used for the pres-ent work has been described by Lebart and Fenelon (1975).
TABLE 2. Size frequencies of male snow crab from research vessel surveys of the Malbaie Bay in the southwestern Gulfof St. Lawrence. (Indicated carapace width is lower limit of the size-class.)
Sample Depth No. of Per mille frequency by carapace width (mm)
Year Month No. (m) crabs 40 45 50 55 60 65 70 75 80 85 90 95 100 105 110
1980 Maya 1 80 582 76 230 216 108 105 93 82 52 17 12 3 3 2 Maya 2 99 261 27 27 65 180 241 172 84 34 50 61 31 8 11 8 Sep 3 86 570 18 172 186 123 98 144 132 47 26 21 21 4 4 5 Sep 4 99 360 3 6 42 131 172 208 169 97 67 58 28 8 8 3 1981 May 5 88 424 26 132 104 83 163 193 153 71 33 24 14 5 May 6 88 187 37 80 102 166 235 118 91 37 43 32 53 5 May 7 101 269 4 15 71 97 134 104 130 152 134 93 52 7 7 Jul 8 84 179 11 34 151 251 235 145 67 67 17 11 11 Jul 9 102 135 7 15 44 74 185 170 133 193 74 37 52 15 Jul 10 64 176 74 108 142 125 193 80 91 80 28 40 17 17 6 Jul 11 46 139 29 22 65 72 259 230 194 29 43 36 14 7 Aug 12 60 177 17 68 192 169 215 96 113 45 56 17 6 6 Sep 13 112 135 7 30 67 148 207 163 126 89 104 52 7 Sep 14 90 179 28 67 247 230 124 51 84 62 79 17 11 Sep 15 73 180 6 11 50 100 94 139 194 94 78 89 67 56 11 6 6 Sep 16 59 165 12 37 133 145 115 182 109 73 79 55 18 18 12 12 1982 Oct 17 95 186 5 38 108 140 194 156 113 118 59 32 16 5 16
Results and Discussion
Commercial data
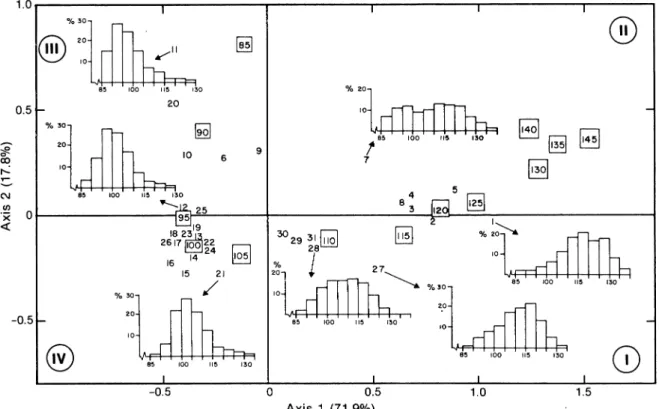
The general results of the factorial analysis of cor-respondence are shown in Fig. 2. The two factorial axes explain 89.7% of the total variability of the data (71.9% for the first axis and 17.9% for the second). This means that the data are almost completely described on the plane created by these axes. A major stretching is observed in the positive direction of the first axis where the largest carapace widths (110 to 145 mm) are aligned. Smaller size-classes are scattered along the second axis, with the smallest sizes (85 and 90 mm) in the positive portion (quad rant III) and intermediate sizes (95 to 105 mm) in the negative portion (quadrant IV).
The sampling periods are represented by three principal concentrations of points. One group (with positive abscissa) is located in quadrant II near the larger carapace widths. It consists of samples 2, 3, 4 and 5 from 1977 and sample 8 from 1978. This group is characterized by a predominance of large crabs with sizes mainly larger than 110 mm and frequency distri-butions with one or two modes (115 and 125 mm). A
second group (with negative abscissa) is associated with intermediate size-groups (95 to 105 mm). It con-sists of samples 12-19 from 1980 and samples 21-26 from 1981. Size distributions of these samples were typically unimodal (at 95 or 100 mm), and crabs larger than 110 mm represented less than 10% of the frequen-cies. The 1982 samples (27-30) form a third group in intermediate position between the two previous ones, and the size distributions appeared to have a more uniform mixture of small and large crabs. A fourth, less concentrated group of sampling periods (6,9 and 10) is located close to the smallest size-classes. These are characterized by an unimodal distribution centered around 90 mm.
Year-la-year changes
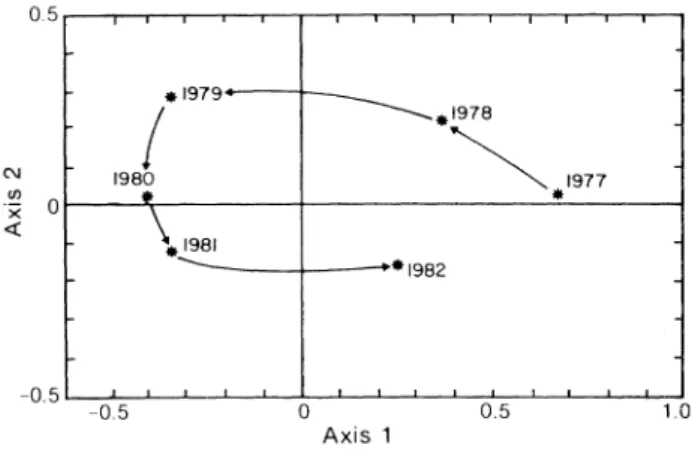
The average position of each fishing year on the factorial plane (Fig. 3) indicates three major stages in the evolution of the stock, which are expressed by the translation of the points along the first axis. There was a strong predominance of large crabs (CW larger than 115 mm) at the beginning of the studied period, fol-lowed by decreasing mean size until 1980-81 when the crab size was very close to the minimum legal size, and an increase in 1982. The smallest sizes were noted in
1.0 % 30
®
®
20~
10 130 % 20 0.5 20 10 %30[iQ]
~
~
85 100 115 130~
~ 20 9,
0 10 6 7 ~~
... 10 ~ C\I 85 100 115 130 4 5 en ... 25 83 12~
'x
a
95 I«
182319~
%2~
2617~22 24~
10 14 16 % 15 21 20,/
85 100 115 130 %30 10 20 20 -0.5 85 100 115 130 10 10@
85 100 115 130CD
85 100 115 130 -0.5a
0.5 1.0 1.5 Axis 1 (71.9%)Fig. 2. Results of factorial analysis of correspondence for size distributions of snow crab landings from commercial fishing in the southwestern Gulf of St. Lawrence (1977-82), giving projection of size-classes (mm, in squares) and of sampling periods. (unenclosed digits) on the plane generated by the first and second factorial axes (see Table 1 for correspondence between sample numbers and periods). (Percentages represent variability of data explained by the axes, and Roman numerals identify the quadrants noted in the text.)
BOUCHARD et al.: Analysis of Snow Crab Size Distributions 71
.1981
---+----..-·1982
In 1980, the poor condition of the market for crabs induced a reduction in fishing effort. In 1981, the effort was greater but the mesh size increased to 131 mm and fishing activity was reduced during the molting period in responseto processing requirements, because post-molted crabs have poor flesh content and are difficult to preserve (Elner, 1982). These various measures appear to have a positive effect on the stock, allowing a sizeable portion of small crabs to avoid capture. A subsequent molt would have made them accessible to the fishing gear in 1982.
.1978
~1977
•
.1979+--~~I
1980 C\l .~ O l - - - - J Y . - - - + - - - = . . : . . - - - i«
Axis 1Fig. 3. General yearly changes in the size structure of the exploited snow crab population in the southwestern Gulf of St. Lawrence, as determined by the average projection of samples in each fishing season (1977-82) on the plane generated by the fi rst and second factorial axes.
1979, but the two samples (Table 1) cannot be consi-dered sufficient to represent the whole season. In gen-eral, the picture looks like the beginning of a cycle that was not complete at the end of the studied period.
The first axis seems to point out the general changes in population structure due to exploitation. The abundance of large crabs in 1977 was the result of the extension of fishing to new grounds with conse-quent exploitation of the accumulated biomass of old crabs. This extension of the fishing area was essen-tially complete by 1977 (Lamoureux and Lafleur, 1982). However, a rapid increase in fishing effort began at that time; for the New Brunswick fleet, the number of trap hauls per year increased from 121,400 in 1977 to 303,300 in 1979 (Bailey and Cormier, MS 1983). The results appears to have been the rapid disappearance of large crabs and the greater importance of new recruits in the landings. In 1980 and 1981, the mean carapace width was close to the legal size limit, and this is reflected in the correspondence analysis by the con-centration of samples around the 95 mm size-class. The abundance of smaller crabs may have also been due to an increase in recruitment, as suggested by Bailey (MS 1981).
In 1982, there was an appreciable increase in size of crabs landed. Bailey and Cormier (MS 1983) assumed that this was due to poor recruitment. How-ever, the correspondence analysis indicates the mix-ture of new recruits (CW around 100 mm) and older animals (CW around 115 mm) in the population struc-ture, placing this year in transition between these two size-classes on the factorial plane. Because small crabs (~100 mm CW) represented more than 30% of the samples in 1982, and since the catch-per-unit-effort increased at this time (Bailey and Cormier, MS 1983), the appearance of large crabs in the 1982 land-ings seems to be the result of changes in fishing activ-ity which occurred in 1980 and 1981.
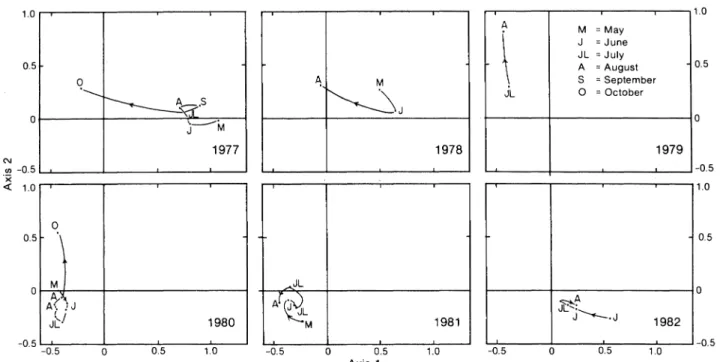
Seasonal variations
Within each year, alternative displacements of the sample positions on the factorial plane are observed (Fig. 4). These displacements correspond to changes in the size structure from one period to the next. The oscillations of variable amplitude express the varying phenomena of growth and recruitment within the exploited population. A displacement of the points towards smaller size-classes means better representa-tion of these classes in samples, which may be trans-lated, in biological terms, as recruitment to the stock. Reciprocally, a displacement towards large sizes implies greater abundance of larger crabs, which may signify individual growth within the previously recruit-ed stock. A loop in displacement of points implies a renewal (total or partial) in the population.
No regular tendency is evident in the observed changes in size distributions. It is possible, however, to observe two periods of greater abundance of small crabs within each year. The first one occurs in spring and early summer (June to August 1977, August 1979, beginning of June 1981, end of June and July 1982). This may correspond to recruitment of small individu-als to the standing stock. The location of May 1978 and May 1980 on the factorial plane implies that recruit-ment occurred before that month in these years. The second period of recruitment is evident at the end of summer and in autumn (October 1977, August 1978, August to October 1980). On the other hand, a greater abundance of larger crabs was generally observed in summer between these so-called periods of recruit-ment (August to September 1977, May to June 1978, May to July 1980, and July to August 1982). It thus seems possible that growth of older animals (those recruited in the previous years) takes place during this period.
Several limitations of this analysis must be consi-dered in interpreting the results of this study. On the one hand, the validity of the conclusions is related to the representativeness of the samples. As a function of fishing intensity, sanple sizes are variable, and a small sample usually is not truly indicative of the real popula-tion profile. The sampling periods do not always cover the whole fishing season, and no data are available on rejected (smallest and postmolted) crabs. These
0.5 0.5
a
-0.5 1.0 0.5a
1.0 1.0 0.5a
-0.5~~
J~.J 1982 A M =May\
J =June JL = July A =August S =September JL 0 =October 1979 1.0 -0.5 "-.JLi~
J JL M 1981 A. M~J
1978 1.0 0.5a
0 to M A\ A\ .:JJt
J 1980 1977 0.5a
0.5 1.0r---r---.,.---.,...----r--...., -0.5 -0.5a
0.5 Axis 1Fig. 4. Seasonal variations in the size structure of the exploited snow crab population in the southwestern Gulf of S1.Lawrence, as determined by the average projection of samples in each fishing season (1977-82) on the plane generated by the first and second factorial axes.
N
en -0.5~_ _---.Io ~_ _- . . - _ - " 'x
-c
1.0biases limit severely the inferences which can be made with respect to the actual population. On the other hand, the utility of studying samples of landings may be questioned. Fishing locations are not known pre-cisely and fishermen often move their traps to avoid places where yields are too low and small or post-molted crabs are abundant. The consequence is some uncertainty with respect to the validity of the conclu-sions. In particular, the apparent growth period may be an artifact that is caused by displacement of fishing effort toward better yields of larger crabs when strong recruitment of small animals occurs. The observed seasonal variations may thus reflect the exploitation of successive subpopulations with different periods of recruitment and growth.
If fishing effort is widely distributed on the fishing grounds, port sampling of landings would not be expected to provide clear evidence of spatial varia-tions. However, the results of the analysis are in fair agreement with present knowledge of crab biology and
fishing activity. According to Kon
et
ale(1968) and Ito(1970), small crabs molt earlier than older ones. These successive molting periods may explain the first recruitment period (spring) and the subsequent increase in abundance of large crabs in the middle of the summer. The hypothesis of two periods of recruit-ment is also in agreerecruit-ment with the observed variations in the catch-per-unit-effort which is maximum at the beginning of the fishing season but often increases in autumn at the end of the season (Lamoureux, MS 1981; Bailey and Cormier, MS 1983.
Research surveys
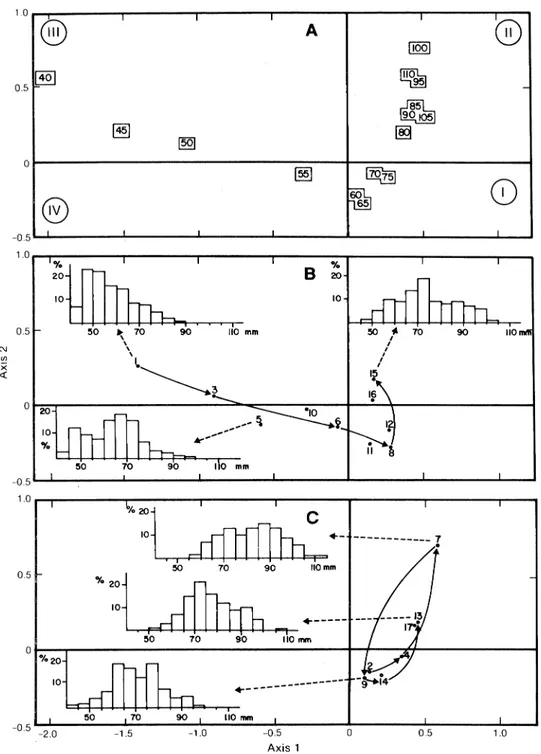
The results of the correspondence analysis of the research vessel data (Table 2) are shown in Fig. 5. The distribution of size-classes forms a large curve, which begins with the smallest sizes having negative abscis-sas (quadrant III) and ends with largest ones having positive abscisas (quadrant II). Intermediate carapace widths (60-75 mm) are located in quadrant I near the origin of the axes (Fig. 5A).
The samples from depths less than 90 m (Fig. 5B) generally consisted of small and intermediate-sized crabs. A general increase in the mean size was observed from May 1980 (sample 1, quadrant III) to September 1981 (samples 15 and 16, quadrant II). Size distributions of samples deeper than 90 m (Fig. 5C) oscillate between intermediate-sized crabs (quadrant I) and larger crabs (quadrant II), with a tendency to follow a cycle. The 1980 distributions indicate an increase in size from May to September (samples 2 to 4). In 1981, the season began with good representation of large crabs in May (sample 7), followed by the domi-nance of smaller crabs in July (sample 9), and increased mean size in September (sample 13).
The results must be considered with caution because the number of samples and the number of measured animals are not large and the time series is short. The factorial analysis, however, indicates a gen-eral distribution of sizes that follows a bathymetric
BOUCHARD et al.: Analysis of Snow Crab Size Distributions 73 1.0 0.5
o
10 0;0 20 +- ---7.
B
110 mm 90 .---70 -1.0 50 -1.5 50 ~ 70 90 110 mm \ \\~3
10®
I I IA
I I0
OQQ]~
~
-~
90 105~
~ ~~
~
8
®
~
I I I I I I 0.5o
0 ...-..---1'...,~-..._r_t__---___1 -0.5 Axis 1Fig. 5. Results of factorial analysis of correspondence for size distributions of snow crab samples from research vessel surveys in the southwestern Gulf of 81. Lawrence (1980-81), giving the projection on the plane generated by the first and second axes of (A) size-classes, (B) samples from depths less than 90 m, (C) samples from depths greater than 90 m (see Table 2 for correspondence between sample numbers and periods.)
0.5 1.0 -0.5 1.0 ...,.---,...---...,r---....,~---
...
----~----...-___.
-0.5 -2.0 10 0.5 N (f) x«
0 20 10"0
-0.5 1.0with the smaller crabs being generally found in shal-lower water than the larger ones. The position of inter-mediate size-classes (60-75 mm) on the factorial plane implies that these carapace widths were represented in similar proportions in all samples. From the growth model proposed by Watson (1969) for snow crabs, animals with carapace width around 75 mm corres-pond to immediate prerecruits (one molt before being
recruited to the fishery). It follows that these prere-cruits have a wide bathymetric distribution in shallow areas as well as on the fishing grounds at greater depths.
It is difficult to interpret the increasing size of crabs from shallow depths (Fig. 58). The increase from May to September 1980 (samples 1 and 3) could be due
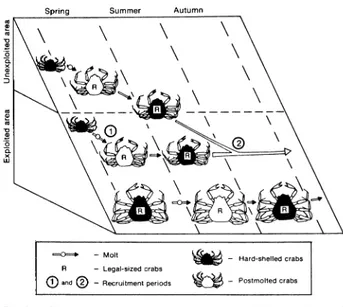
~ - Molt ~_ Hard-shelled crabs - Legal-sized crabs
G)and
® -
Recruitment periods0
-
Postmolted crabsFig. 6. Conceptual model to explain the changes in size structure of the snow crab population in the southwestern Gulf of St. Lawrence during the fishing season: molting periods (earlier for small crabs than for larger ones) and mechanism of recruitment by platoons (migration from unexploited area and molting on the fishing grounds).
implies that variation in the biomass during the fishing
season is only induced by fishing mortality. The
changes in size frequency distributions indicate that the biomass may be increased during the season by waves of recruits, and this would result in overestima-tion of the initial biomass. The locaoverestima-tion of large numbers of prerecruits outside the fishing grounds may also have practical implications, if experimental fishing surveys are undertaken with the intention of predicting potential catches.
Autumn Summer Spring
\
\
\
\
L~~
\ \ \~~\
\ R\
\
\~\A~ ~
\ \ ---~-
---\~
\~~G) \~\
J1>
\
\~
R - - -~
\ R~
\ \~~~\~
Coulombe (MS 1984) has observed, in the south-western Gulf, some unexploited areas which contain a significant biomass of recruit-sized crabs and sug-gested that these areas may be considered as "buffer zones" which can supply the fishing grounds with new animals through migrations. Therefore, recruitment by platoons may explain the resilience of the snow crab stock in the southwestern Gulf of St. Lawrence despite the increased fishing activity. Legal-sized crabs are not all located on the fishing grounds at the same time and all are not subject to the same fishing mortality. Recruits arriving at the end of the fishing season encounter decreasing fishing activity due to poor weather conditions and are thus less vulnerable. This differential mortality becomes more important, because the establishment of catch limitations induces very high fishing effort during a short fishing season. The season usually begins in April, depending on the distribution of sea-ice, and is closed in early summer (23 July in 1983,3 July in 1984), alliowing further waves of recruits to avoid capture. These recruits remain available for the following fishing season.
Implications for management of the stock
The intention of management policy for snow crab stocks in eastern Canadian waters is to stabilize the exploitation rate between 50 and 60% of the available biomass. This value was used to determine the quotas which were established in 1984. The biomass was esti-mated from the relation between catch-per-unit-effort and cumulative catch, known as the Leslie-Delury method (Bailey, MS 1983). The use of such a method More interesting are the trends in the samples from greater depths (Fig. 5C), as the size structure is not constant but changes with time. The increased size observed in September 1980 (sample 4) and Sep-tember 1981 (sample 13) corresponds to molts within the population, as noted by Bouchard (MS 1983) from observations on carapace hardness. The decreased mean size in July 1981 (sample 9) was probably not the result of fishing activity because the area is not com-mercially exploited. Since the traps were capable of catching very small crabs, it may be assumed that these intermediate-sized crabs (60-75 mm) were mov-ing from shallow to deeper water. Migration of snow crabs towards deeper water with increasing size was
also proposed by Coulombeat al. (1985).
to the use of different gears (trawl and traps) but this does not explain the increase from May to August 1981 (samples 5 to 12).
A general pattern for recruitment is revealed by comparing the analysis of commercial and research vessel data. If the existence of spring recruitment and summer growth periods fits the belief of most authors about snow crab growth, the evidence for a second recruitment period remains unexplained. To explain the observed variations in the catch-per-unit-effort, Lamoureux (MS 1981) assumed that prerecruits are able to molt twice a year instead of once, as proposed by Watson (1969). The first molt in winter would induce recruitment before the fishing season and the second molt in summer would induce autumn recruitment. However, the results of the research vessel surveys may lead to another interpretation. It is evident that prerecruited crabs are not located exclusively in depths greater than 90 m where most of the fishing occurs, as a substantive proportion is situated in shal-lower water. The growth of prerecruits which are pres-ent on the fishing grounds would induce a first wave of recruits to the fishery, whereas the individuals located in shallower water would become available later in the season following a migration from shallow to deeper water (Fig. 6). Thus, the exploited snow crab popula-tion seems to be characterized by a type of "recruit-ment by platoons" (Ricker, 1975) which occurs in several waves with, at least, one in spring or early summer, at the beginning of the fishing season, and a second in late summer or autumn.
BOUCHARD et al.: Analysis of Snow Crab Size Distributions 75
It appears that most of the conclusions from this study remain tentative. The migration of snow crabs from unexploited areas has yet to be demonstrated. The snow crab fishery seems to be not yet stabilized, and recent changes in management policy create new conditions which must be observed carefully so that thei r future effects can be defined.
Acknowledgements
We express our thanks to R. W. Elner of the Cana-dian Department of Fisheries and Oceans, Biological Station, St. Andrews, New Brunswick, for his helpful advice during the preparation of this paper, and to J. Bussieres of the University of Quebec (Rimouski) for the drawings. Financial support was provided by the Canadian Department of Fisheries and Oceans and the Foundation of the University of Quebec (Rimouski). The subject of this paper was part of a presentation to the International Symposium on King Crab, Anchor-age, Alaska, USA, in January 1985.
References
BADIA, J., and T. DOCHI. 1976. Etudecinetique de la struc-ture des population deSquilla mantis (Crustacea, Stoma-topoda), par I'analyse factorielle des correspondances.
Mar. BioI., 36: 159-168.
1978. Simulation de la structure d'ages et definition des cohortes chez Squilla mantis L. (Crustacea, Stoma-topoda). ICESJ. Cons., 38: 105-115.
BAILEY, R. MS 1981. Catch prediction for the snow crab
(Chionoecetes opilio) fishery in the southwestern Gulf of
St. Lawrence: a problem of predation by cod (Gadus
morhua). Can. Atl. Fish. Sci. Adv. Committee Res. Doc.,
No.1, 12 p.
MS 1983. Overview of the Leslie fisheries success method as an assessment tool for snow crab stocks. Can.
Atl. Fish. Sci. Adv. Committee Res. Doc., No. 85,14 p.
BAILEY, R., and R. CORMIER. MS 1983. Evaluation de stock de crabe des neiges exploite par Ie Nouveau-Brunswick dans Ie sud-ouest du Golfe du Saint-Laurent. Can. Atl.
Fish. Sci. Adv. Committee Res. Doc., No. 54, 45 p.
*BENZECRI, J. P., et al. 1980. L'analyse des donnees. II. L'analyse des correspondances. Dunod, Paris (3rd edi-tion), 619 p.
BOUCHARD, R. MS 1983. Contribution
a
l'etude de la dyna-mique de population de crabe des neiges (Chionoecetesopilio) dans Ie sud-ouest du Golfe du Saint-Laurent.
Approches rnethodolcqiques. Memoire M.Sc., Univ. du Quebec
a
Rimouski, 133 p.CORMIER, R. MS 1984. Preliminary analysis of the New Brunswick snow crab fishery in the southwestern part of the Gulf of St. Lawrence. Can. Atl. Fish. Sci. Adv.
Commit-tee Res. Doc., No. 83, 10 p.
COULOMBE, F. MS 1984. Estimation de la biomasse exploita-ble due crabe des neiges du sud-ouest du Golfe du
Saint-Laurent pour I'annee 1984: util ization de I'aire efficace de peche d'un easier. Can. Atl. Fish. Sci. Adv. Committee
Res. Doc., No. 88,38 p.
COULOMBE, F., J.-C. F. BRETHES, E. BOUCHARD, and G. DESROSIERS. 1985. Segregation edaphique et bathyrne-trique chez Ie crabe des neiges, Chionoecetes opilio (0. Fabr.), dans Ie sud-ouest du Golfe du Saint-Laurent. Can. J. Fish. Aquat. Sci.,42:169-180.
ELNER, R. W.1982. Overview of thesnowcrab, Chionoecetes
opilio, fishery in Atlantic Canada. Proc. Int. Sym. Genus Chionoecetes, Alaska Sea-Grant Rep., No. 82-10: 5-19.
GALOIS, R. MS 1975. Biologie, ecolcqie et dynamique de la phase lagunaire de Penaeus durorarum en Cote-d'ivoire. These D.ScL, Univ. du Aix-Marseille, France, 120 p. HILL, M. O. 1973. Reciprocal averaging: an eigenvector
method for ordination. J. Ecol., 61:237-249.
ITO, K. 1970. Ecological studies on the edible crab
Chionoe-cetes opilio(0. Fabricius) in the Japan Sea. III. Age and growth as estimated on the basis of seasonal changes in the carapace width frequencies and the carapace hard-ness. Bull. Japan Sea Fish. Res. Lab., 22:81-116. (Fish. Res. Board Can. Transl. Ser., No. 1512.)
KON, T., M. NIWA, and F. YAMAKAWA. 1968. Fisheries biol-ogy of the tanner crab. II. On the frequency of molting.
Bull. Jap. Soc. Sci. Fish., 34: 138-142. (Fish. Res. Board
Can. Transl. Ser., No. 1129.)
LAMOUREUX, P. MS 1981. Evolution des rendements chez les bateaux exploitant Ie crabe de neiges (Chionoecetes
opilio) dans Ie sud-ouest du Golfe du Saint-Laurent de
1974
a
1980. Can. Atl. Fish. Sci. Adv. Committee Res.Doc., No. 48, 24 p.
LAMOUREUX, P., and P. E. LAFLEUR. 1982. The effects of exploitation of snow crab populations of the southwest-ern Gulf of St. Lawrence between 1975 and 1981. Proc. Int. Symp. Genus Chionoecetes, Alaska Sea-Grant Rep., No. 82-10: 443-481.
LEBART, L., and J. P. FENELON. 1975. Statisque et informa-tique appliquees. Dunod, Paris (3rd edition), 437 p. McGLADE, J. M., and S. J. SMITH. 1983. Principal
compo-nents methods for exploratory data analysis of commer-.cial length-frequency data. Can. Spec. Publ. Fish. Aquat.
Sci., 66:235-239.
RICKER, W. E. 1975. Computation and interpretation of bio-logical statistics of fish populations. Bull. Fish. Res.
Board Can., 191: 1-382.
WATSON, J. 1969. Biological investigations on the spider crab, Chionoecetes opilio. Canadian Fish. Rep., 18: 24-27.
1970. Maturity, mating and egg laying in the spider crab, Chionoecetes opilio. J. Fish. Res. Board Can., 27: 1607-1616.
* J.-P. Benzecri, F. Benzecri, A. Birou, S. Blumenthal, A. DeBoeck, J.-P. Bordet, G. Cancelier, P. Cazes, F. da Costa Nicolau, M. Danech-Pajouh, R. Delprat, M. Demonet, B. Escoffier, A. Forcade, Fr. Friant, Y. Grelet, D. Kaloqero-poulos, L. Lebart, M.-O. Lebeaux, P. Leroy, J.-F. Marcotor-chino, T. Moussa, F. Mutombo, Ch. Nora, A. Prost, A. Rezvani, J. Robert, Ch. Rosenzveig, M. Roux, P. Solety, S. Stepan, N. Tabard, N. Tabet, G. Thauront, M. de Virville, and Y. Vuillaume.