O
pen
A
rchive
T
OULOUSE
A
rchive
O
uverte (
OATAO
)
OATAO is an open access repository that collects the work of Toulouse researchers and
makes it freely available over the web where possible.
This is an author-deposited version published in :
http://oatao.univ-toulouse.fr/
Eprints ID : 13030
To link to this article : DOI :10.1504/IJSSC.2014.066013
URL :
http://dx.doi.org/10.1504/IJSSC.2014.066013
To cite this version : Houaidia, Chiraz and Idoudi, Hanen and Van den
Bossche, Adrien and Val, Thierry and Azzouz Saidane, Leila
Towards
an Optimized Traffic-Aware Routing in Wireless Mesh Networks
.
(2014) International Journal of Space-Based and Situated Computing, 4
(n° 3-4). pp. 217-232. ISSN 2044-4893
Any correspondance concerning this service should be sent to the repository
administrator:
[email protected]
Towards an Optimized Traffic-Aware Routing in
Wireless Mesh Networks
Chiraz Houaidia
CNRS-IRIT-IRT,
University of Toulouse, UT2, Toulouse, France
E-mail: [email protected]
Hanen Idoudi
National School of Computer Sciences(ENSI),
University of Manouba, Campus Universitaire de la Manouba, Tunisia E-mail: [email protected]
Adrien Van Den Bossche
CNRS-IRIT-IRT,
University of Toulouse, UT2, Toulouse, France
E-mail: [email protected]
Thierry Val
CNRS-IRIT-IRT,
University of Toulouse, UT2, Toulouse, France
E-mail: [email protected]
Leila Azouz Saidane
National School of Computer Sciences(ENSI),
University of Manouba, Campus Universitaire de la Manouba, Tunisia E-mail: [email protected]
Abstract: In this paper we study through simulations the impact of PHY/MAC protocols on higher layers. In a comparative way, we investigate the effectiveness of some protocols when they coexist on a wireless mesh network environment. Results show that PHY/MAC parameters have an important impact on routing performances. Based on these results, we propose two traffic-aware routing metrics based on link availability. The information about the link availability/occupancy is picked up from lower layers using a cross-layer approach. The first metric is load-sensitive and aims to balance the traffic load according to the availability of a link to support additional flows. The second metric reproduces better the capacity of a link since it is based on its residual bandwidth. Using several real experiments, we have shown that our proposals can accurately determine better paths in terms of throughput and delay. Our experiments are carried out into an heterogeneous IEEE 802.11n based network running with OLSR routing protocol.
Keywords: Wireless Mesh Network; Cross-layering; Traffic-aware Routing; Routing Metrics; Testbed.
1 Introduction
Wireless Mesh Networks are a promising technology to provide broadband wireless Internet to a large number of users spread across large geographical regions. Due to their features of dynamic self-configuration, easy maintenance and low cost, WMNs promise larger
coverage, improved performance, more reliability and better flexibility than classical wireless LANs. In fact, in rural areas, where broadband infrastructure is not available, WMNs may be a potential solution to provide these regions with a reliable Internet access based on multi-hop connections. In this context, the French
Copyright c 2008 Inderscience Enterprises Ltd. Copyright c 2009 Inderscience Enterprises Ltd.
association tetaneutral.net [http://tetaneutral.net] has launched its project to cover the region of Toulouse in France in a meshed manner. This association is acting as a provider of Internet access, web hosting and a nonprofit operator and is aiming to allow and encourage internet connection sharing between neighbors by any means (cable, wireless, etc.). It offers also secure access share.
WMNs have a two-tier architecture based on multi-hop transmission and composed of two types of nodes: Wireless Mesh Routers (WMR) and mesh clients [Hiertz et al. (2010)][IEEE 802.11s Amendment (2007)]. WMRs form a wireless meshed backbone network offering inter-user connectivity. They generally have minimal or no mobility and are equipped with multiple radio interfaces. Moreover, WMRs are often provided with gateway/bridge functionalities. They enable the integration of WMNs with existing wireless networks with different communication technologies such as IEEE 802.11 (Wi-Fi) for wireless local area networks (WLAN) [IEEE Standard for Information technology (2005)], IEEE 802.15.4 for wireless personal networks (WPAN) and IEEE 802.16 (WIMAX) for wireless metropolitan area networks (WMAN). Mesh clients, consisting of end devices like laptops, tablets or smartphones, gain network access by associating to a WMR. When a mesh client wants to communicate with one other, it may do directly or through mesh routers that allow multiple route opportunities.
Regardless of the size, a key design goal in todays WMNs is to provide high throughput, comparable to that offered by other broadband technologies, in order to support the ever-growing demands of Internet applications. Unlike ad-hoc networks which focus essentially on node mobility, power constraint and related ad-hoc capabilities, mesh networks, emerging from an industrial background, are focusing more on optimal deployment, wireless capacity, QoS and related backbone capabilities. Indeed, existing MAC and routing protocols do not support enough scalability, throughput and link quality. For these different aspects WMNs are gaining significant attention from both academic and business communities.
Routing, particularly, has undergone extensive study since it represents a challenging issue for wireless mesh networks [Usop et al. (2009)][Gowrishankar et al. (2007)][Bertocchi et al. (2003)][Rhattoy et al. (2012)]. In fact, in a multi-hop network, routing extends network connectivity to end-users. Thus, an efficient path selection must be done while optimizing network resources and satisfying users QoS requirements. However, with an unstable radio environment, a shared medium and a varying link capacities limited by interference, routing performance issues in a WMN are increasingly challenging. Packet losses, throughput degradation due to intra-flow and inter-flow interference, congested links, etc., are among several problems identified in WMNs and issued generally from lower layers. Intra-flow interference occurs when a data packet
is being transmitted over multiple links along a path. In order to avoid conflict at the receiving node, some links may remain idle. Inter-flow interference occurs when different flows are being transmitted at the same time and then sharing the same available resource. In other words, the interflow interference affects the amount of residual channel resources on each link that will be allocated for a new flow. Link quality-based routing metrics, then, are increasingly needed. To guarantee, then, an efficient data routing in the network, one should, first, properly characterize the impact of environmental factors and PHY/MAC impact on higher layers and second adapt the design of the routing metric to better control influenced parameters.
In the first part of this paper, we check the efficiency of conventional routing strategies under lower layers and whether the choice of PHY/MAC/Routing protocols all together affects the relative performance of the network. The considered protocols include three different PHY/MAC protocols specified IEEE 802.11 standards namely, 802.11b, 802.11s and 802.11n, and three routing protocols, ie., AODV, OLSR and HWMP. Then, based on this first study, in the second part of this paper, we investigated the requirements for designing PHY/MAC aware routing metrics in mesh networks to support high network performance, such as high throughput and low packet delay. We, first, setup and configured a real heterogeneous IEEE 802.11n based WMN testbed, namely, BlueMeLab[http://lab.iut-blagnac.fr/bluemelab]. We implemented some existing metrics in order to evaluate, in a comparative way, the OLSR performances under different metrics. This experimental study aims to point out the shortcoming of each metric in order to propose optimizations and improvements. We, then, proposed two novel metrics for accurately finding high-throughput paths in multi-hop wireless mesh networks. We implemented these two metrics into our testbed and we evaluated the network performances using several experiments.
2 Impact
of
PHY/MAC
Strategies
on
Routing in WMNs
2.1 Routing Challenges in Wireless Mesh
Networks
Despite the availability of several ad-hoc routing protocols, the design of routing protocols specifically for WMNs is still an active and challenging research area. In fact, from a routing perspective, WMNs present a particular topology and different application domains and thus specific requirements and expectations. The main challenging considerations in mesh routing are:
• Network topology: similarly to MANETs, communication in WMNs is performed through hop-by-hop wireless transmissions. However, unlike MANETs, WMNs offer a static backbone
for routing and thus node mobility is no longer a principal criterion in mesh routing.
• Traffic pattern: unlike cellular networks, WLANs and sensor networks, where traffic is exchanged between client nodes and access points (between sensors and the sink node in WSNs), in WMNs, data is relayed between any pair of nodes: client-client, client-access point or access point-access point. Then, a priority model can be needed to consider separately intra-mesh traffic between client nodes and router nodes within the network and extra-mesh traffic between router nodes and gateways which relay the traffic from/up to the Internet. A shaping mechanism can also be used. An efficient routing protocol should assume these differences and take into account the properties of every pattern.
• Inter-path interference: unlike wired networks, wireless links in a WMN are particularly affected by environmental conditions, noise resulting in interference between disjoint paths and hidden/exposed terminal problems. For that reason, this parameter should be well addressed in the routing metric.
• Channel diversity and radio-diversity: in WMNs, channel diversity, which is not supported in traditional MANETs, is introduced in order to increase the overall throughput and to reduce inter-nodes interference. Providing a node with multiple radios enables it to transmit and receive simultaneously or transmit in multiple channels simultaneously. So, to properly support this feature, additional management rules (like channel switching) should be included into the routing process.
• Network heterogeneity: mesh network is formed by different types of nodes with different access technology and different capacities (bandwidth, range, fading characteristics, ...etc). Routing protocol, for example, is not able to discover or to exploit the differences in transmission rates between neighboring nodes. Thus, in one hand, this multi-rate feature may lead to gray-zones of communications On the other hand, paths, set up generally, by diffused messages at minimum rate, may consider links that do not support higher rates.
• Routing strategy: similarly to ad-hoc networks, routing strategy can be either proactive, reactive or hybrid. The choice depends on the network density, the node mobility, the related overhead and user requirements. Each routing class has its particular functioning such as route discovery, route maintenance and related control messages, acknowledgment strategy, route update frequency
etc. Hence, such choice can be determinant in the overall network performance.
Hence, such choice can be determinant in the overall network performance. When taking into account these parameters, routing protocols should fulfill several requirements, including, (i) High throughput, (ii) Low average latency, (iii) Heterogeneous traffic (e.g. data, voice, and video), and (iv) Support for QoS. Nevertheless, if we consider a realistic context, it is not meaningful to speak about a routing protocol in isolation: routing performance is considerably related to MAC and PHY layer design. To have an efficient routing layer, an overall view of the MAC and PHY parameters should be provided in order to control lower layers settings and discuss possible improvements. Some solutions based on cross-layer approach are proposed to deal with this separation between layers [Paris et al. (2011)]. Our approach also fits into this context of cross-layering where we don’t propose any modification or optimization of PHY/MAC mechanisms but to use them as they are and adapt the routing layer according to these constraints.
2.2 Performance Study of Routing and MAC
protocols for WMNs
The simulations are performed using the ns-2 simulator modified to support the 802.11n features [Wang et al. (2009)][Gilbert et al. (2005)]. Different protocol stacks are considered as described in the figure 1: The network layer is represented by AODV [Perkins et al. (2003)], OLSR [Clausen et al. (2003)] and HWMP [Bahr et al. (2006)] routing protocols (HWMP is implemented at layer two but is considered here as a routing protocol for organizational reasons). For the MAC layer, we varied the configuration between the mesh architecture based on 802.11s amendment [Hiertz et al. (2010)][IEEE 802.11s Amendment (2007)], the MAC part of the 802.11n and the 802.11 standard. Concerning the physical layer, we considered, both 802.11b and Multi-Input Multi-Output (MIMO) [Wang et al. (2009)][Gilbert et al. (2005)] technology associated to 802.11n standard. For all the scenarios we have used a square topology of 500x500m2 with randomly deployed static nodes. We varied both the number of nodes (20-40-60-80-100) and the traffic load (10-30-50-70) % of pairs from total number of deployed nodes). We used a constant output (CBR) related to UDP protocol. For the MIMO configuration, nodes are equipped with 2 antennas at both transmitter and receiver (i.e. 2x2 MIMO). We consider both A-MPDU and A-MSDU are enabled. The maximal AMSDU length is set to 1024 Bytes (i.e two packets of 512 Bytes). Since the initial size of a packet does not exceed 512 Bytes, aggregation then occurs only when the node acts as a router, when it has in its queue at least two packets to the same destination. Data rate is set to 96 Mbps. Using 802.11b physical layer, the bandwidth is set to 2Mbps.
Figure 1 Protocol Stack.
For the 802.11s mesh topology, we assume a network with one Mesh Portal Point (MPP) set in the network center. We remind that MPP nodes are gateway nodes, generally equipped with two interfaces and are connected to both the mesh network and the Internet. Users connected to the mesh network can access the Internet via these MPP nodes. Nodes used RANN proactive signalization to get connected to the MPP. Table1 summarizes the simulation parameters.
Table 1 SIMULATION PARAMETERS
Paramater Value Simulation Time 100s
Topology 500x500m Number of nodes 20-40-60-80-100
Radio Range 250m Packet Size 512 Bytes Packet generation interval 0.005s
OLSR-Hello-interval 2s OLSR-TC-interval 5s
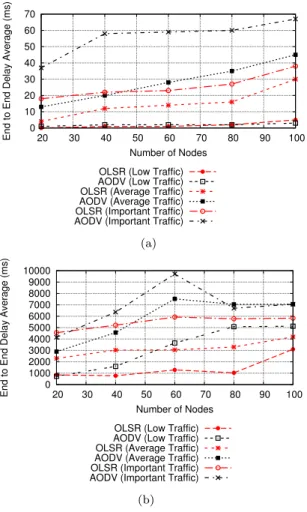
Figure 2 shows the average end-to-end delay for the different considered combinations of PHY, MAC and Network layers while increasing the number of deployed nodes and the traffic load in the network. The delay is expressed in milliseconds and it includes all possible delays caused by buffering, queuing at the interface queue, retransmission delay at the MAC layer, propagation and transfer time. The results show that, for all possible PHY/MAC/Routing protocol stacks, the end-to-end delay increases with the network size. This increase is particularly important with HWMP+802.11s. This can be explained from a routing point of view by the hybrid character of HWMP: In fact, on the one hand, delays generated at every Path Request increase naturally with the number of hops. On the other hand, with only one MPP in the network, delays of queuing and buffering may also get higher with the number of nodes in the network. For small networks, the different considered stacks have the same temporal behavior. However, with larger networks, the pattern begins to distinguish from one combination to another: networks based on routing protocols associated to 802.11n MAC layer and MIMO technology achieved the least delay. This is due essentially to the links capacity and the
rate offered by the physical layer. Networks based on the 802.11 and 802.11s generate similar delays with a slight difference relative to the used routing protocol: AODV and HWMP achieved the higher delays compared to OLSR. The difference between the delay of a light traffic and that of the heavy traffic is none other than the buffering delays which increase with the number of pairs communicating at the same time in the network.
The figure 3 shows more the difference between, on the one hand, reactive and proactive routing protocols and on the other hand, 802.11 and 802.11n MAC layer effects. For OLSR, the average end-to-end delay increases slightly for the same size except for high network size (100 nodes). In fact, by increasing the number of nodes in the network, the neighborhood changes and the number of hops between source and destination also increases. Thus, delays caused by buffering and queuing delays at intermediate nodes contribute largely in the average end-to-end delay. Regarding the traffic load, the delay increase is relatively slight. This is because packets are crossing the same path within the same size even when the traffic is getting higher i.e when approximately 50% or 70% of node pairs from total number of deployed nodes are communicating at the same time. The pattern of the average end-to-end delay is the same for AODV. It grows slightly with the number of nodes for the same reason that the number of hops also increases. However, particularly for AODV the delay increases considerably with the traffic load. This result was expectable since for each new pair of nodes communicating in the network, delays for the route discovery are included. The proactive nature of OLSR allows this protocol to quickly discover the optimal route and then the transmission time of packets takes less time compared to reactive protocols (AODV) which explains the better performance of OLSR in terms of delay. The frame aggregation of the IEEE 802.11n protocol results in a great gain in the end-to-end delay which is considered very low in all cases compared to delays generated using 802.11 based networks.
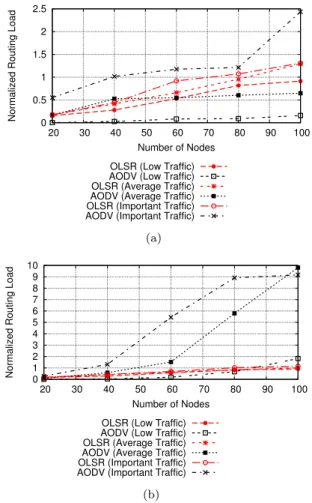
Figure 4 shows the normalized routing load. It reflects the number of routing packets transmitted per data packet delivered at the destination. We can see from these results the clear and significant increase in the routing overhead generated by HWMP compared to that of AODV and OLSR regardless of the lower layers and the three types of traffic loads. This disparity is due to the hybrid feature of the protocol since it uses the two types of control messages (the proactive and the reactive one). The routing load pattern is the same for all schemes which leads us to conclude that the PHY/MAC have no significant impact on this performance metric.
However, results in the figure 5 reveal some difference according to the routing mechanism. For networks with small number of nodes (between 20-60 nodes) and low traffic load (10% of the total number of nodes in communication), AODV performs, in most cases, better than OLSR. The amount of routing overhead generated by OLSR is directly related to the periodic exchange of
0 1000 2000 3000 4000 5000 6000 7000 8000 9000 20 30 40 50 60 70 80 90 100
End to End Delay Average (ms)
Number of Nodes OLSR + 802.11 AODV + 802.11 HWMP + 802.11s OLSR + 802.11n AODV + 802.11n (a) 0 2000 4000 6000 8000 10000 12000 14000 16000 20 30 40 50 60 70 80 90 100
End to End Delay Average (ms)
Number of Nodes OLSR + 802.11 AODV + 802.11 HWMP + 802.11s OLSR + 802.11n AODV + 802.11n (b)
Figure 2 End-to-End Delay by traffic load, (a) Low traffic charge (b) High traffic charge.
topological messages. Hence, the larger is the network, the larger is the neighborhood and consequently the higher is the routing load. However, the normalized routing load remains almost constant regarding the traffic load since the control traffic is periodic and is independent of data traffic within the network. On the other hand, since the route discovery mechanism of AODV is based on Route REQuest flooding, it follows that the overhead generated by this protocol increases rapidly and significantly with the number of nodes in the network, because, for a given flow between a source and a destination, when the number of intermediate nodes which are diffusing the Route REQuest gets higher, naturally the overhead generated increases. As well, for a higher traffic load (70% of the total number of nodes in communication) across a very large network (100 nodes), AODV generates a peak of routing load.
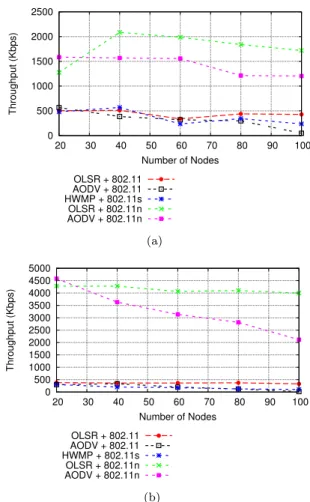
The throughput is given in the figure 6. It is expressed in Kbits per second and it measures the total number of received packets during the simulation period. The throughput achieved by the 802.11n based schemes is significantly better than that of 802.11 and 802.11s. This is due essentially to the rate offered by the physical layer. Pattern of throughput within 802.11 and 80.11s based networks is the same as both use the same physical layer which is 802.11b. When traffic increases, the network throughput relative to the 802.11n
0 10 20 30 40 50 60 70 20 30 40 50 60 70 80 90 100
End to End Delay Average (ms)
Number of Nodes OLSR (Low Traffic) AODV (Low Traffic) OLSR (Average Traffic) AODV (Average Traffic) OLSR (Important Traffic) AODV (Important Traffic)
(a) 0 1000 2000 3000 4000 5000 6000 7000 8000 9000 10000 20 30 40 50 60 70 80 90 100
End to End Delay Average (ms)
Number of Nodes OLSR (Low Traffic) AODV (Low Traffic) OLSR (Average Traffic) AODV (Average Traffic) OLSR (Important Traffic) AODV (Important Traffic)
(b)
Figure 3 End-to-End Delay by PHY/MAC layers, (a) 802.11n (b) 802.11.
increases with the load to consume the entire useful throughput. However, the throughput in 802.11/802.11s based networks maintains certain stability or decreases in some cases. The results show also that, regardless the load, the throughput for AODV decreases for denser networks. This behavior is characterized as normal because of channel saturation, meaning the resources are limited to the impending demand. For an important traffic, the pattern is the same and throughput remains almost constant on optimal values. OLSR, however, performs better with higher traffic load. It maintains a good throughput at all cases. The throughput offered by the MIMO technology has a great impact on the general network throughput which is relatively high and suitable for data transfer applications.
According to the simulation results, we may state that to achieve good performance in the network, all the parts and parameters of the protocol stack must be considered together. In fact, the choice of PHY/MAC features has a great impact on the routing performance. Hence, the routing strategy can significantly impact the network performance only if it is strongly linked to the characteristics of the lower layers. Results also revealed that from a routing perspective, there is a notable superiority in the general performance of OLSR, particularly when the network gets denser, although further study of others topologies is needed to validate
this conclusion. On the other hand, HWMP is still very sensitive to the network traffic and size, its scalability is not guaranteed and its performance may be affected if the network size is not correctly adjusted. Then, given the number of nodes in the tetaneutral.net [http://tetaneutral.net] network and the lack of mobility at some nodes, OLSR may be the most appropriate to the needs of our network. At least, it would be a good start for future improvements and contributions. We also noted that the rate or the link capacity offered by the PHY and MAC layers have a significant impact on routing performance since it allows a better traffic fluidity, lower delays and better throughput. These observations are made based on the great gain offered by the use of MIMO technology and Frame aggregation mechanism of IEEE 802.11n MAC protocol. Based on these observations, we focused our future interest to cross-layer proposals and dynamic routing metrics which adapt to the lower layers. The main idea is to improve OLSR protocol by integrating link quality based metrics. In these metrics, we try to exploit essentially the link capacities offered by PHY/MAC layers. Node mobility is not considered in our context because of the static topology of the mesh network backbone.
0 0.5 1 1.5 2 2.5 3 3.5 4 20 30 40 50 60 70 80 90 100
Normalized Routing Load
Number of Nodes OLSR + 802.11 AODV + 802.11 HWMP + 802.11s OLSR + 802.11n AODV + 802.11n (a) 0 5 10 15 20 25 20 30 40 50 60 70 80 90 100
Normalized Routing Load
Number of Nodes OLSR + 802.11 AODV + 802.11 HWMP + 802.11s OLSR + 802.11n AODV + 802.11n (b)
Figure 4 Normalized Routing Load by traffic layer, (a) Low traffic charge (b) High traffic charge.
0 0.5 1 1.5 2 2.5 20 30 40 50 60 70 80 90 100
Normalized Routing Load
Number of Nodes OLSR (Low Traffic) AODV (Low Traffic) OLSR (Average Traffic) AODV (Average Traffic) OLSR (Important Traffic) AODV (Important Traffic)
(a) 0 1 2 3 4 5 6 7 8 9 10 20 30 40 50 60 70 80 90 100
Normalized Routing Load
Number of Nodes OLSR (Low Traffic) AODV (Low Traffic) OLSR (Average Traffic) AODV (Average Traffic) OLSR (Important Traffic) AODV (Important Traffic)
(b)
Figure 5 Normalized Routing Load by PHY/MAC layers, (a) 802.11n (b) 802.11.
3 Link
Availability
based
PHY/MAC
Aware Routing Metrics
3.1 Related Work
In ad hoc networks, where mobility and power saving are the main problems, the most convenient metric is Hop-Count. This metric allows a fast recovery of instable routes due to link breakage or node mobility. The Hop-Count metric considers only the least number of hops and assumes identical link characteristics across the entire network. It doesn’t consider the trade-off between distances (loss) and hops [Houaidia et al. (2013)]. On the other hand, as mesh routers are, generally, stationary, wireless mesh routing protocols are optimized to consider link quality-based metrics. New metrics, such as ETX [Couto et al. (2003)], ETT [Draves et al. (2004)], WCETT [Draves et al. (2004)][Ghannay et al. (2009)], MIC [Ghannay et al. (2009)], etc., are proposed towards a quality-aware routing, in order to reflect more the link variations such as transmission capacity, loss probability, interferences, etc. The most of metrics here proposed are based on or derived from ETX and ETT. Moreover, ETX is implemented in several simulators and experimental platforms. For this reason, we have included in this related work part, an experimental study of three basic
0 500 1000 1500 2000 2500 20 30 40 50 60 70 80 90 100 Throughput (Kbps) Number of Nodes OLSR + 802.11 AODV + 802.11 HWMP + 802.11s OLSR + 802.11n AODV + 802.11n (a) 0 500 1000 1500 2000 2500 3000 3500 4000 4500 5000 20 30 40 50 60 70 80 90 100 Throughput (Kbps) Number of Nodes OLSR + 802.11 AODV + 802.11 HWMP + 802.11s OLSR + 802.11n AODV + 802.11n (b)
Figure 6 Throughput by traffic load, (a) Low traffic charge (b) High traffic charge.
metrics namely Hop-Count, ETX and ETT in order to essentially distinguish the effect of considering a link quality based routing and to identify more closely the limits of these existing metrics. In our experiments [Houaidia et al. (2013)], we intend to evaluate and compare the performances of OLSR under Hop-Count as simplistic metric and two routing metrics aware of the link quality which are ETX and ETT.
The Expected Transmission Count (ETX) metric [Couto et al. (2003)] is a proposal to better suit wireless networks where link fluctuations and packet losses are inevitable. It represents the number of times a node expects to transmit and retransmit a packet for a successful delivery of a unicast packet. It measures the packet delivery when considering MAC retransmissions.The ETX metric considers the asymmetric property of wireless links and is computed as follows:
ET X = 1/(df× dr) (1)
Where df and dr are respectively the forward and the
reverse delivery ratios of the link.
To estimate df and dr, nodes broadcast small-size
probes at an average period τ during a time window ω so that each node knows how much probes it should receive during this period which is τ /ω. The probe contains the number of received probes for each neighbor during the
last ω. So, each receiving node becomes aware of the forward delivery ratio for each link. This information is then broadcasted to make all neighbors aware of the ETX of the link. The best link quality is the link with the smallest ETX i.e with the smallest loss probability. The ETX of a route is the sum of the link metrics.
As described here before, ETX assumes that all links have the same bandwidth capacity, which is a very simplified hypothesis due to the great diversity of PHYs in modern communication technologies such as IEEE 802.11n. The ETT routing metric, proposed by Draves et al. [Draves et al. (2004)], improves ETX by considering the differences in link transmission rates. The ETT of a link is defined as the expected MAC layer duration for a successful transmission of a packet. It is expressed as follows:
ET T = ET X × S/B (2) Where S is the probe-packet size and B measures the transmission rate of the link. The ETT of a path p is simply the sum of the ETTs of the links on the path.
Link quality-based metrics have been shown to significantly outperform the traditional Hop-Count metric but they have only been evaluated over legacy 802.11a/b/g radios. The new 802.11n standard introduces a number of enhancements at the MAC and PHY layers (MIMO technology, channel bonding, frame aggregation and new modulation and coding schemes) marking the beginning of a new generation of 802.11 radios. Through the following performance experiments, we aim to highlight the efficiency and flaws of each metric in a 802.11n based environment.
3.1.1 Performance Evaluation
To carry out performance evaluation and comparison, we run experiments in an indoor testbed BlueMeLab [http://lab.iut-blagnac.fr/bluemelab]. Our testbed is deployed at the University Institute of Technology (IUT) Blagnac-Toulouse. It is formed by seven nodes: four shuttles, two personal computers and one Ubiquiti Networks Nanostation Loco router. Device configurations are shown in Table II. All nodes are IEEE 802.11n compliant, with a 2x2 MIMO radio devices running with the ath9k driver [http://linuxwireless.org/en/users/Drivers/ath9k] and are using OpenWRT operating system [https://openwrt.org/]. This driver provides enough features for our implementation as well as for future improvements. Console of each node is accessible via an Ethernet link, so as not to cause additional traffic control on the radio during tests or performance assessments. All nodes are configured to use the channel 9 with a 40MHz width spectrum. The adhoc mode is enabled and the PHY rate is automatically set: each node computes the best PHY rate for every neighbor. The OLSR routing protocol is implemented natively in the OpenWRT operating system as an OLSR deamon (olsrd) [http://www.olsr.org]. This implementation is
improved to offer both the use of the Hop-Count, ETX and ETT metrics. The nodes are spread over two floors of the building. Rooms are separated by thick bricked walls. It is worth mentioning that there are other wireless networks in the area. The choice, then, of the channel was made essentially in order to avoid interferences with existent networks and guarantee a certain accuracy of our results.
Table 2 CONFIGURATION OF DEVICES USED ON THE TESTBED
Device Operating System Processor RAM
Computer OpenWRT Intel Pentium 4 2Go
(GNU/Linux) CPU 3.2GHz
Shuttle OpenWRT Intel Pentium 4 904Mo
(GNU/Linux) CPU 3.00GHz
NanoStation OpenWRT Atheros MIPS 32MB SDRAM
M2 Loco Router (GNU/Linux) 400MHz 8MB Flash
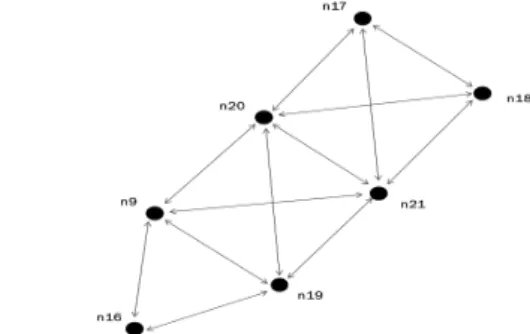
We used a multitude of monitoring tools offered by the ath9k driver in our experiments. The iperf tool was used to generate TCP and UDP traffic at different rates between pairs of nodes and measure bandwidth, jitter, packet loss, etc. Tcpdump and Wireshark tools were used to dump the traffic in the network and give a description of the contents of packets. Iw configuration utility was used to get device capabilities and set parameters and statistics. We choose two representative pairs of nodes to carry out our performance tests. Nodes are numbered as show in the figure 7. First pair includes the node n18
and the node n16. Second pair includes n20and n16. We
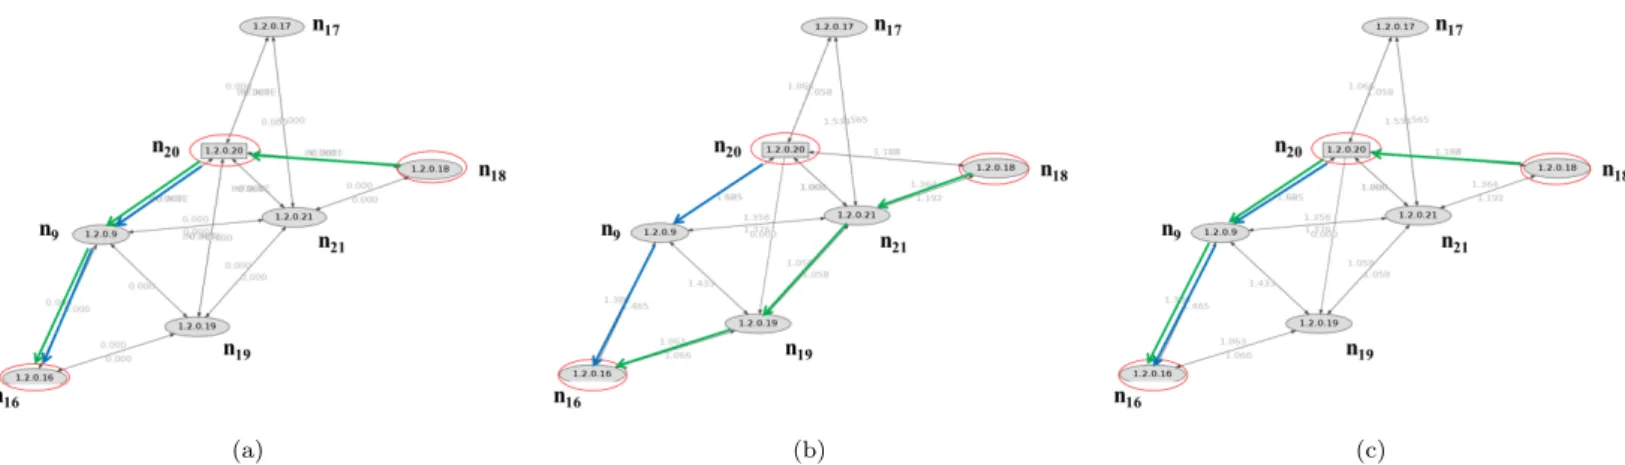
choose these pairs specifically to have different routes with different characteristics (distance between nodes, number of hops, link quality, etc.). The routes selected for each routing metric are shown in the figure 8.
Figure 7 The Testbed Topology.
• Route Selection: First attempts were to study the behavior of OLSR while varying the routing metric: how did OLSR select the routes? How does this choice impact the load distribution over all the links in the network? Figure 8 displays the routes selected for each metric. We found out that to reach the node n16from the node n20, the best
route is the same for all metrics which is the 2-hop route including n20, n9and n16.
However, from the node n18, the path selection
differs. Using the Hop-Count metric, OLSR opt the
first route with minimum hops. Based on ETX, the choice is made according to the quality of transmission along all links of the route: the path n18-n21-n19-n16 offers the smallest ETX i.e the
minimum packet loss and then the best quality. Based on ETT, OLSR considers, in addition to the link quality, the link bandwidth which differs from one link to another in our experiments. As shown in the figure 9, the route n18-n20-n9-n16 includes
links with the highest transmission rates, so route links chosen by ETT metric have better quality and send packets using higher physical rates which explains the better route selection in that case. In terms of route length, OLSR selects always a 3-hop path, then, all metrics have the same number of medium accesses. The difference lies essentially on the distribution of the traffic load on the network. • Link Usage: To reach the node n16, according
to our topology, there are two principal gateway nodes which are n9 and n19. For farther nodes,
packets should transit by n20 or n21. So,
the manner how OLSR manages the traffic between these four gateways can be an important comparison criterion. Figure 10 presents how many times a link is used for data transmission while considering the different routes computed by each node. As depicted in that figure, with the Hop-Count metric there is no strategy for load balancing between the different links in the network. There is, by consequence, much probability to have overloaded links and bottleneck nodes. Based on ETX metric, traffic is equally distributed between the four gateways mentioned before and routes are used at the same rate by all the nodes in the network. In fact, ETX metric avoids congestioned links where propability of packet loss is higher.
Figure 9 Available Capacity of Each Link.
Based on ETT metric, a better distribution is made in so far as, first, all the available links are used and second, the trade-off between the traffic supported and the throughput offered by a link remains reasonable. In fact, the link (n9,n16),
as mentioned in the figure 9, presents a higher bandwidth compared to the link (n19,n16). As the
(a) (b) (c)
Figure 8 Route Selected; (a) Hop-Count (b) ETX (c) ETT.
0 1 2 3 4 5 HC ETX ETT Link Usage Metric (N9,N16) (N19,N16) (N20,N9) (N21,N19) (N21,N9) Figure 10 Link Usage.
ETT metric takes into account the link bandwidth, it follows that this link is preferred from others. • Packet Loss: In the first flow of experiments, we
generate an UDP traffic between the different pairs while varying the transmission rate and we pick up the average packet loss of 10 series of tests. Figure 11 (a) plots the average packet loss rate for each metric experienced by node n20when pinging
node n16. For all metrics, as the transmission
rate increases, the packet loss ratio also increases. Using Hop-Count metric, however, the increase of packet loss rate is considerably higher at important transmission rates. This packet loss is measured essentially at the link (n9,n16) which
is very exposed to a major part of neighbor traffics (cf. Figure 10). Results in figure 11(b) show the packet loss rate measured between nodes n18 and n16. The ETT metric has the lowest
packet loss ratio because it reproduces physical conditions better than ETX and Hop-Count. With high transmission rates, the performance of ETX is the worst because packets are transited over links having the worst throughputs as shown in Figure 9. So, the packet delivery is affected by traffic load and congested links. This behavior occurs because the path between these nodes has more obstacles
and uses more hops (cf. Figure 8). Consequently, the difference in performance between the three metrics is important. 0 10 20 30 40 50 60 1 2 3 4 5 6 7 8 9 10 Packet Loss (%)
Transmission Rate (Mbits/sec) HC
ETX ETT
(a) From node n20to node n16
0 10 20 30 40 50 60 70 80 90 1 2 3 4 5 6 7 8 9 10 Packet Loss (%)
Transmission Rate (Mbits/sec) HC
ETX ETT
(b) From node n18to node n16
Figure 11 Packet Loss Rate.
3.1.2 Discussion
According to the results of our experiments, the route selection, when Hop-Count metric is used, is relatively stable as it is not aware of link quality variation. Then, in some topologies such ours, several nodes may choose the same route and neglect others which could offer a better capacity or quality. This may result generally on overloaded links and bottleneck formation which leads to the performance degradation across the entire network. With ETX metric, the link quality estimation
is based on small size probes (some bytes) which doesn’t properly reflect the data loss probability. In fact, such measurement underestimates data loss ratios and over-estimates ACK loss ratios. In real scenarios, such our experiments, we clearly note the important packet loss rate and delay made by ETX while increasing the traffic load or the packet size. Figure 11(b) show that ETX metric achieves the worst performances. Moreover, ETX assumes all links run at one bit-rate and probes are sent in broadcast at the network basic physical rate. So, this metric assumes always a robust physical layer which is not the case at all. When links data rates are not accounted for, a short path with lower ETX may be chosen over another longer path with higher ETX albeit the latter may be able to support a higher overall throughput and less end-to-end delay. To cope with these problems, ETT metric, offers a better estimation and ensures both reliability and efficiency. According to the experimental results (cf. Figure 11), ETT achieves the best performances among other metrics. However, from a technical point of view, an accurate design of ETT may be more complex compared to ETX. In fact, several methods were proposed to compute the transmission rate of each link. The packet pair technique proposed by Draves and al. [Draves et al. (2004)] is the most used. But, this method is based on unicast probes which may lead generally on additional overhead. For example, in a n-node network, where each node has v neighbors, the number of probes sent using ETT is O(nv) whereas using ETX it is O(n). On the other hand, given a link with a high capacity does not mean that its total bandwidth is available for use. Hence, one should check first the link availability or the residual bandwidth, if already in use, in order to make sure if this link can support the amount of data to transmit or not and how good it is [Houaidia et al. (2013)]. Moreover, among all these metrics there is no consideration of interferences. For that reason there were other improvements such WCETT [Draves et al. (2004)][Ghannay et al. (2009)] and MIC [Draves et al. (2004)] etc.
Weighted Cumulative Expected Transmission Time (WCETT) is the first multi-channel metric for mesh networks. It is determined by the amount of time used by a frame to attend a destination and the maximum time period consumed on links sharing the same channel. The main motivation for WCETT was to specifically reduce intra-flow interference by minimizing the number of nodes on the same channel in the end-to-end path. However, WCETT is a non-isotonic metric and requires complex routing protocol to calculate the minimum cost. Weighted Cumulative ETT with Load Balancing (WCETT-LB) is a metric proposed by Ma et al. [Draves et al. (2004)] which is an improved version of WCETT. It considers the load balancing in the metric by involving the congestion level which is achieved by calculating the average queue length on each node. However, WCETT-LB has the same problem as WCETT does [Zhao et al. (2012)]. Following the WCETT metric, a new metric, the Metric of Interference and Channel Switching (MIC)
was proposed. It aims to capture both the intraflow and interflow interferences. Composed of two major parts, it ensures that minimum weight paths can be found by both Bellman-Ford and Dijkstras algorithms and no forwarding loop can be formed in link state routing. MIC is, however, non-isotonic and may require decomposition into isotonic link weight assignments in a virtual network and hence efficient algorithms can be used to find minimum weight paths. In the same context, Interference-Aware Routing Metric (IAR) [Tang et al. (2005)] detects the channel busy level by capturing the delay information. This delay is based on time of wait, time of collision, time of backoff and time of successful transmission. The time durations are captured in the MAC layer. Therefore, smaller IAR presents a path with low traffic [Zhao et al. (2012)].
3.2 Link Occupancy Aware Routing Metric
To overcome the limitations of ETX and ETT, a first step would be to take into account the aspect of multi-rate in the choice of the link. Indeed, traffic should be routed into the best high speed links in order to achieve the best possible end-to-end throughputs and delays. In a second time, we focus on the link availability and/or occupancy concept to propose a load sensitive and load-balancing routing [Houaidia et al. (2013)]. The purpose of our first metric is to measure the occupancy level of a link and, based on this estimation, select links which are freer and the most available to transmit data traffic. For that, we model our network as an oriented graph G = (V, E) where V denotes the set of vertices representing the networks nodes and E denotes the set of links. This model allows us to consider bidirectional traffic. We define Link Occupancy Ratio (LOR) as the load of a link i.e. the amount of data traffic occupying the link during a time window ω in both forward and reverse directions. If a link is not used by any flow, its LOR would be theoretically equal zero and its total capacity is available for data transmission. Such free link would be a potential alternative for current flow transmission so that we avoid overloaded routes where risk of congestion and data loss is inevitable. The LOR of the link l between two nodes n1 and n2 is expressed as follows:
LORl= T x(n1,n2) B(n1,n2)× ω + T x(n2,n1) B(n2,n1)× ω (3) Where T x(n1,n2) and T x(n2,n1) are respectively
the reverse and forward amount of transmitted data occupying the link l during a time window ω. B(n1,n2)
and B(n2,n1) are respectively the transmission data rate
of each source node. ω is the time window during which the data traffic flow through the link l is captured. For the rest of our experiments, ω is set to 10 seconds in order to have enough trafic and to have situations of overloaded links.
We define also the Data Loss Ratio (DLR) of a link l which represents the amount of lost data among those transmitted during ω. This component provides
information about the possible congestion or interference phenomenon that may affect the data packet delivery. The DLR of a link l between two nodes n1 and n2 is
given by the following equation : DLRl =
T x(n1,n2)− Rx(n2,n1)
T x(n1,n2)
(4) Where Rx(n2,n1) represents the amount of
successfully received data by the node n2 from the node
n1.
Thus, the link quality of a link l is estimated by the Link Occupancy Metric (LOM) and is expressed as follows :
LOMl= αLORl+ (1 − α)DLRl (5)
The parameter α ∈ [0,1] and is used to delimit the metric so that the LOM value is still a ratio (∈ [0,1]). For the rest of our experiments, α is set to 0.5 in order to have a fair relation between the link load and the data loss ratio through that link. If α is set to 1, this means that we only consider the link load to assess the occupancy of that link and we neglect the data loss fact. If it is set to zero, our metric, then, will be typically the role of ETX metric.
Using this metric, only links with reduced occupancy are selected to form a route between a source node and a destination node so that routing decision is based on links availability to support more traffic flows. Bottleneck or lossy links with high occupancy rates are supposed to be bad links. The occupancy level of a path is the sum of link occupancies of links forming the path. As described, our metric, accounts for the bandwidth heterogeneity in the network and exploits this aspect towards a high throughput routing. In addition, unlike ETX which is based on small probes to estimate the loss ratio, our metric estimation is more accurate since it is based on real data traffic and real transmission conditions.
3.3 Residual Link Capacity Based Routing Metric
The Link Occupancy Metric of all links is initiated to zero until having traffic across the link. Then, during the first 10 seconds and until an update of link occupancy information, the route choice is randomly done and the protocol may consider a route with bad performances or bad link quality. Then, the routing metric should be better initialized to allow the routing protocol to a good start. On the other hand, given two links with two different link occupancies, the route decision may be made and changed based on a minimal difference of 10−6 which increases the frequency of route switching and makes the routing unstable. In order to avoid such cases of instability, we may submit the routing decision to a threshold so that if the difference between two link occupancies exceeds the threshold, then, the routing protocol should commute to the best link, otherwise, it maintains the same route. To overcome these limitations,
we propose a novel routing metric based on the residual link capacity [Houaidia et al. (2013)]. This proposal is motivated by the inability of the Link Occupancy Metric to measure accurately the capacity of a link to support a specific amount of data. Indeed, even if it accounts for the transmission rate heterogeneity, the link occupancy information is still expressed in terms of ratio and thus doesn’t accurately reflect the real residual capacity in terms of bandwidth i.e. that such metric doesn’t distinguish between two links having the same link occupancy but not the same bandwidth. Thus, a residual link capacity based metric may be more adaptive since it is relative to the amount of data to transmit, more accurate compared to a percentage based information and more efficient since it allows a more stable routing. The Residual Link Capacity based metric (RLC) is given by the equation below:
RLCl= Bl−
T xl
ω (6)
Where Bl is the link bandwidth and Tx corresponds
to the traffic occupying the link during the time window ω. Between two links, the routing protocol selects the link with the greater RLC. The traffic across a route will be, then, limited by the bottelneck link i.e the link having the minimal residual capacity. Thus, the routes RLC corresponds then to the minimum of RLCs of links composing the route.
RLCroute= min(RLCl)l∈route (7)
Using this metric, each link is initialized to its bandwidth so that the routing protocol can choose from the start the route offering the greater bandwidth and thus supporting the greater traffic. Since it is based on real exchange of data in the network, the RLC based metric gives a real estimation and thus allows a more efficient routing.
In order to evaluate the effectiveness of our metrics, we now present in this paper measurements taken from the BlueMeLab [http://lab.iut-blagnac.fr/bluemelab] testbed network described previously. We have implemented the two proposed metrics LOM and RLC into OLSRd deamon and we made some comparison with the Hop-Count metric as a simplistic routing metric and ETX as a link quality aware routing metric.
3.4 Performance Evaluation
This section presents experimental results that show that LOM and RLC often find higher throughput paths than minimum Hop-Count and ETX. First series of experiments compared the throughput realized by Hop-Count, ETX and LOM metrics. We omit the performances of RLC in the following figures because results are somehow the same of that of LOM. So, lines corresponding to RLC metric are omitted just for a better visibility. To carry out our performance tests, we first identified all possible routes in the network for each
metric: Hop-Count, ETX and LOM. We, then, compared the throughput of cumulative pair of nodes of paths found by OLSR using each metric between 42 total node pairs. The throughput is measured through TCP transmissions between each pair. Results are plotted in Figure 12 and show that OLSR using LOM often finds faster routes than Hop-Count which doesn’t account for any link quality and ETX which assumes all links run at one bit rate and doesn’t account for the multi-rate aspect. In fact, in the right half region where throughputs are the highest, there is much more blue points showing high throughput paths selected by LOM. The extreme right half corresponds to one hop routes where nodes can communicate directly. At these cases, the minimum Hop-Count metric finds the one-hop route as the best route, and there is no opportunity for ETX or LOM or RLC to perform better. The left half region, however, corresponds to routes with 2 hops or more. In this region, the sensitivity of LOM and RLC to differentiate high throughput paths allows them often to find better paths than Hop-Count and ETX.
0 1 2 3 4 5 6 7 8 9 10 11 12 0 50 100 150 200 250 300
Cumulative Pair of Nodes
Throughput (Mbits/sec)
HC ETX LOM
Figure 12 Cumulative Pair Throughput.
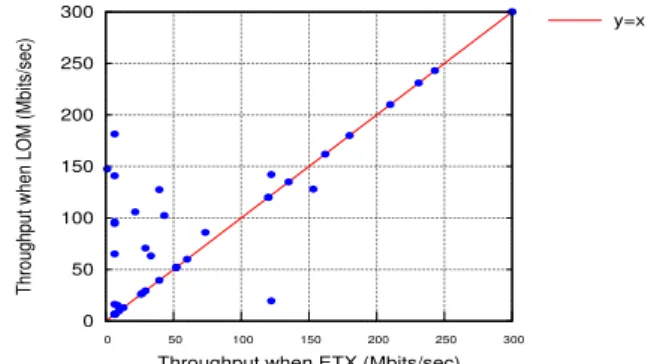
Figure 13 shows the same data as Figure 12, but organized in a per-pair basis so that we can compare between the performances of ETX metric and Link Occupancy Metric for individual pairs. Each pair of nodes is represented by one point: the y value is the throughput obtained by OLSR using LOM, and the x value is the throughput obtained by OLSR using ETX. The line y=x corresponds to cases where ETX and LOM both choose the same path or paths with the same throughput. Points above the line y=x are pairs where LOM outperformed ETX. Results of Figure 13 show largely better performance of LOM compared to those of ETX. This is illustrated by the dense region above the line y=x where points with x near zero and y relatively higher. That region shows that routing based on LOM finds often paths with higher throughputs. In fact, with ETX metric which is load insensitive, links with good quality are always used to transmit data traffic even when they become overloaded or supporting many simultaneous data flows. With LOM, however, the routing decision is load-sensitive and can dynamically switch to links less occupied or offering a total unused bandwidth higher than the residual capacity of first
chosen link. Hence, this metric allows a load-balancing routing so that all links in the network would be used fairly. 0 50 100 150 200 250 300 0 50 100 150 200 250 300
Throughput when LOM (Mbits/sec)
Throughput when ETX (Mbits/sec)
y=x
Figure 13 Per Pair Cumulative Throughput.
In the rest of this section, we compared the performances of OLSR using ETX, OLSR using LOM and OLSR using RLC in terms of throughput, delay and packet loss. For that, we choose one representative pair of nodes to carry out our performance tests. Nodes are numbered as shown in Figure 7. This pair includes the node n17 and the node n16 which are distant enough
to have different routes with different characteristics (distance between nodes, number of hops, link quality, etc.). In this series of experiments, we generate an UDP traffic from node n17to reach node n16while varying the
transmission rate and we pick up the average throughput of 10 series of tests.
Figure 14(a) plots the average throughput for each metric experienced by node n17when pinging node n16.
For the three metrics, the throughput increases with transmission rate. For small amount of data, the three metrics are achieving the same throughput because they are using the same route. For greater data traffic, some links would be then more occupied and loaded compared to others. In that case, based on LOM and RLC, OLSR would change route and choose links with a better availability which explains the variations in the pattern of OLSR-LOM and OLSR-RLC. Figure 14(b) shows the average packet loss of the same scenario described above. For light traffic, the pattern is approximately the same for the three metrics. By increasing the transmission rate, the packet loss also increases greatly. We note, however, for higher transmission rates, a slightly higher packet loss with ETX. Indeed, the more the link is overloaded by heavy traffic, the more is the risk of loss because of congestion or timeout in queues, particularly at bottleneck nodes such as node n19 which is the most
used with ETX. This phenomenon is avoided with LOM since it is a load-sensitive metric and can dynamically adapt the routing decision based on the bandwidth availability of other links in the network. However, using Link Occupancy Metric, the increase of packet loss is considerably higher at important transmission rates and is represented by several pics which show in general the route switch. Residual Link Capacity based
(a) (b) (c)
Figure 14 Performance comparison between OLSR-ETX, OLSR-LOM and OLSR-RLC, (a) Throughput (b) Packet Loss Rate (c) End-to-End delay.
routing is more regular because it reproduces physical conditions and resources availability better than LOM based routing. Figure 14(c) shows the end-to-end delay to reach node n16 from the node n17. For all metrics, as
the transmission rate increases, the packet loss rate also increases over the time.
Compared to OLSR-RLC, this increase is particularly important with Link Occupancy based routing as we note several pics especially for higher transmission rates (from 5Mbits/sec). These delays are caused essentially by buffering and queuing delays at intermediate nodes. Since both metrics are load sensitive, packets are crossing different paths when the traffic is getting higher. However, using Link Occupancy Metric, the routing decision can change frequently, as explained in section III-B, according to the availability of freer links. These freer links don’t always offer more bandwidth to support large amount of data which causes congestion and huge buffering delays. Using Residual Link Capacity, the route decision changes only if there are links with larger residual bandwidth and then are more convenient to support larger data traffic which explains the regular increase of the delay pattern of that metric.
4 Conclusion
In the first part of this paper, we studied by simulation the impact of PHY/MAC/Routing strategies on the performance of multi-hop wireless mesh networks. We combined the routing protocols (AODV, OLSR and HWMP) with the MAC strategies (802.11, 802.11n and 802.11s) along with different PHY technologies (802.11b PHY layer, MIMO technology). We found out that, to achieve good performance in the network, all the parts and parameters of the protocol stack must be considered together. In fact, the choice of PHY/MAC features has a great impact on the routing protocols performance. Hence, the routing strategy can significantly impact the network performance only if it is strongly linked to the characteristics of the lower layers. According to the
simulation results, we may state that the throughput offered by the MIMO technology has a great impact in the general network throughput which is suitable for data transfer applications. We found out also, from routing view, HWMP is still very sensitive to the network traffic and size, its scalability is not guaranteed. OLSR however suits better the static topologies and its performance may be better than reactive protocols.
The second part provides a measurement-based performance evaluation of the OLSR protocol. Three versions of OLSR are configured and evaluated in order to get a comparative study of the most known routing metrics: Hop-Count, ETX and ETT in a wireless mesh testbed. Our measurements show that OLSR-ETT outperforms OLSR-ETX and OLSR-Hop-Count in terms of packet loss, delay and load balancing. Results obtained are related to the considered topology, further study of other topologies is needed to validate this conclusion. Although, our results remain coherent with other works [Esposito et al. (2008)][Sinky et al. (2010)]. At the best of our knowledge, we are the first to study these routing metrics in a MIMO and 802.11n based mesh network. By taking into account the PHY/MAC diversity of nodes, we focused on the shortcomings of these metrics to adapt a heterogeneous environment. As improvement of the existing metrics, we proposed also in this paper, two novel link quality aware routing metrics. The first proposal is a load-sensitive and additive metric that aims to fairly distribute the traffic load between nodes in the network while taking into account their occupancy and availability. The second metric is a concave metric based on residual link capacity estimation. We mean by a concave metric when the total cost of a path is the minimum of the costs of individual links along the path. It represents accurately how much of additional traffic can the link support. Both are based on real traffic estimation and are updated periodically using the control messages of OLSR. Performances of the proposed metrics are evaluated by experimentation. The first series of experiments show that LOM and RLC outperforms ETX since it reproduces better the real
behavior of nodes when they are solicited by several data flows simultaneously. According to the results obtained, the Residual Link Capacity based routing decision is more accurate since it considers better the bandwidth heterogeneity between links.
In further work, we focus in the problem of interferences and we intend to validate our proposals by further experiments deployed in tetaneutral.net in Toulouse, France which offers a more realistic environment, traffic and wireless constraints. It allows us also to check the scalability of our proposal when deployed in a large scale network. Future work will consist of the proposal of an adaptive routing protocol taking into account our new proposed metrics.
References
http://tetaneutral.net. Last access: December, 2013. G. R. Hiertz, S. Max, R. Zhao, D. Denteneer, L.
Berlemann. ’IEEE 802.11S: THE WLAN MESH STANDARD’, IEEE Wireless Communications, 104-111 February 2010.
802.11-2012. ’IEEE Standard for Information technology–Telecommunications and information exchange between systems Local and metropolitan area networks–Specific requirements Part 11: Wireless LAN Medium Access Control (MAC) and Physical Layer (PHY) Specifications’.July 2005.
Nor Surayati Mohamad Usop, Azizol Abdullah and Ahmad Faisal Amri Abidin. ’Performance Evaluation of AODV, DSDV and DSR Routing Protocol in Grid Environment’. International Journal of Computer Science and Network Security (IJCSNS), VOL.9 No.7, July 2009.
S. Gowrishankar, T.G. Basavaraju, M. Singh and Subir Kumar Sarkar. ’Performance Analysis of AODV and OLSR in Mobile Ad hoc Networks’. Proceedings of the 24th South East Asia Regional Computer Conference, Bangkok, Thailand, November 2007.
F. Bertocchi, P. Bergamo and G. Mazzin. ’Performance Comparison of Routing Protocols for Ad hoc Networks’. Proceedings of IEEE GLOBECOM 2003. A. Rhattoy and A. Zatni. ’The impact of propagation
environment and traffic load on the performance of routing protocols in Adhoc networks’. International Journal of Distributed and Parallel Systems (IJDPS) Vol.3, No.1, January 2012.
http://lab.iut-blagnac.fr/bluemelab. Last access: May, 2013.
Stefano Paris, Cristina Nita-Rotaru, Fabio Martignon and Antonio Capone. ’EFW: A cross-layer metric for reliable routing in wireless mesh networks with selfish participants’. IEEE INFOCOM, pp. 576-580, 2011.
Chih-Yu Wang and Hung-YuWei. ’IEEE 802.11n MAC Enhancement and Performance Evaluation’. Mobile Netw Appl (2009). Vol. 14. Pages: 760-771.
Jeffrey M. Gilbert, Won-Joon Choi and Qinfang Sun. ’MIMO Technology for advanced Wireless Local Area Networks’. Proceedings of the 42nd annual Design Automation Conference DAC’05, 2005.
Charles E. Perkins, Elizabeth M. Belding-Royer and Samir Das. ’Ad hoc On-Demand Distance Vector (AODV) Routing’. Internet Request For Comments RFC 3561, Internet Engineering Task Force, July 2003.
Thomas Clausen and Philippe Jacquet. ’Optimized Link State Routing Protocol (OLSR)’. Internet Request For Comments RFC 3626, Internet Engineering Task Force, October 2003.
Michael Bahr. ’Proposed routing for IEEE 802.11s WLAN mesh networks’. Proceedings of the 2nd annual international workshop on Wireless internet WICON ’06. New York, NY, USA 2006.
G. R. Hiertz, S. Max, R. Zhao, D. Denteneer, L. Berlemann, ’Principles of IEEE 802.11s’. IEEE ICCCN’2007, Honolulu, Hawaii, USA, 13-16 August 2007.
D. S. J. D. Couto, D. Aguayo, J. Bicket, and R. Morris. ’A high-throughput path metric for multi-hop wireless routing’. ACM MobiCom, California, Sept. 2003, pp. 134-146.
R. Draves, and B. Zill. ’Routing in radio, multi-hop wireless mesh networks’. ACM MobiCom, pp. 1-8, Sep. 2004.
S. Ghannay, S.M. Gammar, F. Filali, F. Kamoun. ’Multi-radio multi-channel routing metrics in IEEE 802.11s-based wireless mesh networks - And the winner is ...?’. Communications and Networking (ComNet), Hammamet, Nov. 2009, pp.1-8.
http://linuxwireless.org/en/users/Drivers/ath9k. Last access: May, 2013.
https://openwrt.org/. Last access: May, 2013 http://www.olsr.org. Last access: May, 2013.
L. Zhao and A. Y. Al-Dubai. ’Routing Metrics for Wireless Mesh Networks: A Survey’. Recent Advances in Computer Science and Information Engineering Lecture Notes in Electrical Engineering, Vol. 127, 2012, pp 311-316.
J. Tang, G. Xue, and W. Zhang. ’Interference-Aware Topology Control and QoS Routing in Multi-Channel Wireless Mesh Networks’. ACM MobiHoc, pp. 68-77, May 2005.
P. M. Esposito, M. E. M. Campista. , I. M. Moraes, L. H. M. K. Costa, O. C. M. B. Duarte, M. G. Rubinstein. ’Implementing the Expected Transmission Time Metric for OLSR Wireless Mesh Networks’. IFIP Wireless Days, Dubai, Nov. 2008, pp. 1-5.
H. Sinky and B. Hamdaoui. ’Implementation and performance measurement and analysis of OLSR protocol’. International Wireless Communications and Mobile Computing Conference (IWCMC), New York, Jul. 2010. pp. 286-290.
C. Houaidia, A. Van Den Bossche, H. Idoudi, T. Val, L. Saidane. ’Experimental Performance Analysis of Routing Metrics in Wireless Mesh Networks’. IWCMC, Cagliari, Jul. 2013.
C. Houaidia, A. Van Den Bossche, H. Idoudi, T. Val, L. Saidane. ’Link Availability Aware Routing Metric For Wireless Mesh Networks’. ACS International Conference on Computer Systems and Applications AICCSA, Morroco, May. 2013.
IEEE 802.11s, ’Draft Standard for Information Technology - Telecommunications and Information Exchange Between Systems - LAN/MAN Specific Requirements - Part 11: Wireless Medium Access Control (MAC) and physical layer (PHY) specifications: Amendment: ESS Mesh Networking, IEEE Unapproved draft P802.11s/D1.06’, Jul. 2007