Assessing the Fate of PAHs in the Boston Inner Harbor Using
Semipermeable Membrane Devices (SPMDs)
by
Amparo E. Flores
Environmental Engineering Science, B.S. University of California at Berkeley, 1996
Submitted to the Department of Civil and Environmental Engineering
In Partial Fulfillment of the Requirements for the Degree of
MASTER OF ENGINEERING
IN CIVIL AND ENVIRONMENTAL ENGINEERING
at theMASSACHUSETTS INSTITUTE OF TECHNOLOGY
June 1998The author hereby grants to M.I. T permission to reproduce & distribute publicly
paper & electronic copies of this thesis document in whole or in part.
Signature of the Author
r or_ Department of Civil and Environmental Engineering
May 15, 1998
Certified by__
i/ Philip Gschwend, Ph.D.
Professor of Civil and Environmental Engineering Thesis Supervisor
Certified by
Professor Joseph Sussman Chairman, Department Committee on Graduate Studies
Assessing the Fate of PAHs in Boston Inner Harbor Using
Semipermeable Membrane Devices (SPMDs)
by
Amparo E. Flores
Submitted to the Department of Civil and Environmental Engineering In Partial Fulfillment of the Requirements for the Degree of Master of Engineering in Civil and Environmental Engineering
ABSTRACT
This study used a relatively new sampling tool called semipermeable membrane devices (SPMDs) to quantify dissolved concentrations of the following polycyclic aromatic hydrocarbons (PAHs) in three locations of the Boston Inner Harbor: phenanthrene,
methyl-phenanthrene's, fluoranthene, pyrene, benz(a)anthracene, and chrysene. The field
measurements ranged from 0.61 to 90 ng/L for the various PAHs at the base of Tobin Bridge, the mouth of Chelsea River, and near the Logan Airport. A vertical gradient in PAH concentrations was observed at the base of Tobin Bridge, revealing a concentration ten times greater in the upper layer (4 m from the surface) than the lower layer (8 m from the surface). The concentrations increased with distance from the mouth of the Inner Harbor.
The ratios of methyphenanthrene's-to-phenanthrene and pyrene-to-fluoranthene were
calculated as possible indicators of source and transport behavior. In all three sites, methylated phenanthrene levels were found to be about twice that of phenanthrene levels, indicating that one of the main sources of low molecular weight PAHs into these sections of the harbor is of petrogenic origin. The abundance of small analytes in the samples suggested a low-molecular weight petroleum source such as diesel, creosote, and/or coal tar. The ratios of fluoranthene suggested another type of origin. Based on the pyrene-to-fluoranthene ratios obtained here, Boston air, street dust, and creosote are also potential major primary sources of PAHs in the study area.
SPMDs appear to be a useful tool for quantifying dissolved PAHs in the field. The measurements obtained in this study were in good agreement with the results of a box model and 3-D hydrodynamic model of PAH concentrations in the Inner Harbor.
Thesis Supervisor: Philip Gschwend, Ph.D.
ACKNOWLEDGMENTS
I would like to thank the following people who have been instrumental in helping me achieve this work
... my project group members, Sharon Ho, Peter Israelsson, and Ricardo Petroni, for their insights and esprit de corps.
... John MacFarlane, for being an excellent and patient teacher who never tired of my endless questions.
... Rachel Adams, for her assistance with the SPMD deployment and analysis.
... Professor Philip Gschwend, for always pushing the boundaries of my knowledge and inspiring me with his brilliance and energy.
... James Huckins of the US Geological Survey's Midwest Science Center, for taking the time to guide me on the application of SPMDs.
... The US Coast Guard, for their help and cooperation in the deployment of the SPMDs. They truly went beyond the call of duty.
On a more personal note, I would like to express my deepest gratitude to the following people:
... Ana Pinheiro, without whom I would not have been able to stay awake during those long nights. You were always there to provide support, friendship, and distractions. ... Charles Njendu, for the pleasure of discussing DNA sequences and Ayn Rand in the
wee hours of the night.
... Conny Mitterhofer, Ricardo Petroni, and Peter Israelsson, for sharing your friendship and work experience with me. You taught me many things.
... My sister, Adeliza Flores, who has always provided unconditional support. You inspired me with your patience and enthusiasm for your research work in
Chemistry. You deserve the best in life and I share all my accomplishments with you. ... a very special man in my life, Dr. Daniel Barsky, full-time biophysicist, part-time
SPMD and C. parvum consultant. I am so lucky.
And, lastly, the people who showed me the beauty of science and inspired me with their enthusiasm and encouragement, my teachers at Contra Costa College, Dr. Joseph Ledbetter, Dr. James Conrad, and Mr. Don Wieber. Thank you.
This material is based upon work supported under a National Science Foundation Graduate Fellowship. I am grateful to the NSF for providing me the incredible opportunity
to study here at MIT.
Any opinions, findings, conclusions or recommendations expressed in this publication are those of the author and do not necessarily reflect the views of the National Science Foundation.
TABLE OF CONTENTS
L IST O F F IG U R E S ... ... 6
L IST O F T A B L E S... ... 7
1. IN T R O D U C T IO N ... ... 8
2. POLYCYCLIC AROMATIC HYDROCARBONS (PAHS)... 13
2.1 Chemical Structure and Properties... 13
2.2 Sources and Fate in the Environment ... .... ... 17
3. BOSTON HARBOR BACKGROUND AND HISTORY... ... 21
3.1 Physical and Hydrographic Characteristics ... ... 21
3.2 Sources of Contamination in Boston Harbor... ... 24
4. PROBLEM STATEMENT AND OBJECTIVES... 27
5. SEMIPERMEABLE MEMBRANE DEVICES... 31
5.1 H istorical D evelopm ent... 31
5.2 D esign of SP M D s... ... 35
5.3 U ptake K inetics of SPM D s... ... 39
6. EXPERIM ENTAL PROCEDURE... ... 42
6.1 R eagents and M aterials... ... 43
6.1.1 Reagents and solvents 6.1.2 Materials 6.2 M eth od s... ... 45
6.2.1 General glassware cleaning procedure 6.2.2 Laboratory experiment
6.2.2.1 Preparation of the spikes
6. 2.2.2 Analyte discharge from the SPMDs
6.2.3 Field Experiment
6. 2.3.1 Construction of the SPMD cages 6. 2.3.2 Sampling Sites
6.2.3.3 Deployment of the SPMDs: February 13, 1998 6. 2.3.4 SPMD collection: February 24, 1998
6.2.4 Extraction and Analysis of the SPMDs
6.2.4.1 Dialysis
6.2.4.2 Kuderna-Danish Concentration 6.2.4.3 N2 blowdown and hexane exchange
6.2.4.4 SiO2 Gel Column Chromatography
6.2.4.5 Gas Chromatography
7. RESULTS AND DISCU SSION ... ... 56
7.1 Laboratory Experiment: Dissipation of Compounds from SPMDs... 56
7.2 Field M easurem ents... 60
7.3 Comparison of Measurements to a Mass Balance (Box) Model and a 3-D H ydrodynam ic M odel... ... 73
7.4 Comparison of Measured Water Column Concentrations to Sediment C oncentrations... ... 76
7.5 C om parison of Loadings... ... 78
8. C O N C L U SIO N ... ... 80
REFERENCES... 81
APPENDIX A - Laboratory Experiment Data and Calculations... ... 88
APPENDIX B - Field Experiment Data and Calculations...99
LIST OF FIGURES
Figure 1.1. Summary of estimated PAH loadings to Massachusetts Bay broken down by
source type (Menzie-Cura and Associates, 1995)...11
Figure 2.1 The structures of some polycyclic aromatic hydrocarbons commonly found in the environm ent... ... 16
Figure 3.1. B oston H arbor... ... 22
Figure 3.2. Boston Inner H arbor...23
Figure 5.1. Correlation of log Ktw with log Kow for selected organic compounds...37
Figure 5.2. An exploded view of the triolein-membrane-water film model...39
Figure 6.1. SPMD-loaded wire cage...48
Figure 6.2. Components of creosote...50
Figure 7.1. Dissipation of pyrene from the SPMDs in the laboratory experiment...57
Figure 7.2. PAH chromatogram of the Logan Airport -Buoy #12 (LA) sample after first run through the silica column...61
Figure 7.3. (a) GC-FID chromatogram of the Tobin Bridge-surface PAH sample fraction.62 (b) High resolution gas chromatogram of PAHs in Charles River sediment...62
Figure 7.4. (a) Gas chromatogram of a PAH standard... ... 64
(b) Gas chromatogram of the Tobin Bridge-bottom PAH fraction sample...64
Figure 7.5. Summary of PAH concentrations at the different sampling sites...70
Figure 7.6. Vertical profile of pyrene concentrations at the confluence of the Chelsea and Mystic Rivers predicted by 3-D hydrodynamic model and data from SPMD measurements at the Base of Tobin Bridge and box model or mass balance predicted steady-state concentration... .... 75
Figure 7.7. Sampling locations in the PAH sediment concentration study by Shiaris et al. (19 86)... ... 76
LIST OF TABLES
Table 1.1. Low molecular weight (LMW) PAHs and high molecular weight (HMW) PAHs
as defined by Menzie-Cura and Associates (1995)... .... 10
Table 2.1. Physical/chemical constants of some PAHs commonly found in the
environm ent... 14 Table 2.2. Typical concentration ranges of benzo(a)pyrene and total PAHs in various
aquatic system s... ... 19 Table 5.1. A comparison of log Kow values versus log Ktw values for a range of organic
compounds (Chiou, 1985)...38
Table 6.1. Sampling depths at the different sites...49 Table 7.1. Rs or sampling rates (relative standard deviation in % ), KSPMD, and ke or
dissipation rates at different temperatures...59
Table 7.2. Phenanthrene and Methyphenanthrene concentrations in ng/L and their ratios
at various sites... ... 68
Table 7.3. Fluoranthene and Pyrene concentrations in ng/L and their ratios at various
sites... ... 68 Table 7.4. Benz(a)anthracene and chrysene concentrations in ng/L at various sites...68 Table 7.5. Pyrene-to-fluoranthene concentration ratios of common sources of PAHs in the
environm ent... ... 71 Table 7.6. (a) Pyrene and fluoranthene loadings from rivers and CSOs and stormwater
drains into Boston Harbor... 72 (b) Pyrene-to-fluoranthene ratios in rivers and CSOs and stormwater...72
Table 7.7. Sources and sinks of PAHs in the Inner Harbor... ... 73 Table 7.8. SPMD-derived concentrations (accounting for + 42% error), predicted steady
-state concentration from mass balance or box model, and predicted
concentrations from 3-D hydrodynamic model... ... 74
Table 7.9. Weighted sediment pyrene concentrations...77
Table 7.10. Loadings of pyrene into the Inner Harbor... ... 79
1. INTRODUCTION
For centuries, Boston Harbor has served as a receptacle for human waste (MWRA, 1996). Over the past decades, the public has become increasingly concerned with the impact of sewage disposal on the harbor. In the 1980's, litigation over the pollution of Boston Harbor resulted in the development of a Federal court-ordered schedule to plan and build proper sewage treatment facilities for the over five hundred million gallons of sewage generated by
2.5 million people and 5,500 businesses in Boston and surrounding areas (MWRA, 1991). In
1985, the Massachusetts Water Resources Authority (MWRA) was created for the purpose of
managing water and sewer services in the area. One of the MWRA's biggest projects is the Boston Harbor Project, whose main goal is the improvement of water quality in the harbor. Upon completion, the project is expected to cost an estimated 4 billion dollars (Sea Grant,
1996). Since the development of the MWRA, extensive work has been done to try to abate
the pollution in Boston Harbor.
Currently, metropolitan Boston is attempting to fix a different sort of problem in the harbor. Much of the region's economy depends on the area's access and accessibility to the waters of the Atlantic Ocean. As of 1996, harbor commerce was generating $8 billion annually in revenue (MWRA, 1996). However, as rivers and sewage outfalls empty into the harbor, sediments carried by these sources settle to the harbor floor. Eventually, sediment build-up raises the harbor floor to the point where the water column is too shallow for large ships to navigate. To correct this problem, the state of Massachusetts has been allocating funds to remove sediment from the bottom of the harbor floor. By dredging both accumulated and native sediment, shipping lanes in the harbor will be deepened and better access will result
(USACOE, 1988).
Fortunately, the dredging could also have a significant positive impact on the harbor's water quality. It has been noted that the Boston Harbor sediments are extremely contaminated with a multitude of toxic metals and organic compounds (MWRA,1990). Sediment concentrations of certain metals and PAHs are so high that it is suspected that there is a chemical flux of contaminants from the sediment to the harbor water column (Stolzenbach and Adams, 1998). By removing this possible source of contaminants, the water column concentrations of these chemicals may be decreased. If so, dredging could actually improve the water quality in the harbor.
Because the sediments are extremely contaminated, they must be treated as hazardous waste if they are removed from the harbor. The complete treatment and disposal of hazardous waste can be extremely expensive, so an alternate plan was conceived. The United States Army Corps of Engineers (USACOE) proposed to bury the contaminated sediments in the harbor itself. Disposal cells will be dug in the northern area of the Inner Harbor and filled with the dredged material. The cleaner sediments that are excavated to make the cells will be dumped elsewhere. The cells will then be "capped" with approximately three feet of clean sand, which is intended to eliminate (or at least drastically reduce) the chemical releases from the dredged materials.
Both dredging and capping have been used in other areas as a means of remediation (Stivers and Sullivan, 1994), but they have not been demonstrated to be effective in an area such as Boston Harbor. In order to evaluate the impact of the dredging and capping processes on the water quality of the harbor, it is necessary to first determine the pre-dredging and -capping conditions. A particular group of compounds, polycyclic aromatic hydrocarbons (PAHs), is taken here to represent the general state of the harbor's water quality. It has been recognized for many years that some PAHs can cause cancer in laboratory mammals and possibly humans, and occupational exposures to PAHs have been correlated with the incidence of human cancer (International Agency for Research on Cancer, 1973; National Academy of Sciences, 1972; Bridboard et al., 1976) so PAHs are of major concern to regulators and the
general public. As a consequence, sixteen PAH compounds are on the EPA priority pollutant list (MWRA, 1993).
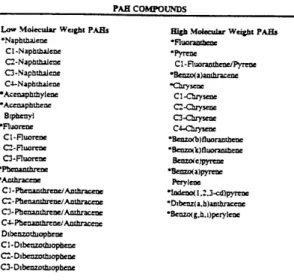
Starting in 1991, a major study sponsored by the MWRA estimated PAH inputs into the near shore regions of Massachusetts Bay, including Boston Harbor, using site-specific non-point and point source PAH concentration data from waterborne sources (Alber and Chan, 1994). A study by Golomb et al. (1996) looked into atmospheric PAH loadings into Massachusetts Bay. The MWRA study found that the major waterborne sources for low molecular weight (LMW) PAHs versus high molecular weight (HMW) PAHs varied. Low molecular weight compounds ranged from naphthalene to dibenzothiophene, while high molecular weight compounds ranged from fluoranthene to benzo(g,h,i)perylene (Table 1.1). The greatest loadings of LMW compounds were from sewage and sludge discharges from publicly-owned treatment works or POTWs, while the greatest source of HMW compounds were from non-point sources including rivers (Cura and Studer, 1996) (Figure 1.1). The difference in sources, and therefore discharge points, may have important implications for the distribution of PAH compounds over Boston Harbor. Since PAHs vary in their toxicity (National Academy of Sciences, 1972), it is important to identify and quantify the individual PAHs found in the water column of different regions of the harbor.
PAH COMPOUNDS
Low Molecular Weaght PAEs High MolecuLa Weight PABs
*Naphtabalee Fluormram=c C1-Naphthalen .Py* =
C2-Naphtbhalen CI- Fluoranthen/Pyre
C3-Naphthale= *Benzo(a)ahr;acene C4-Naphrhalene *Chrysen *Ac•phthylene CI-Chrysene *Acenaphthene C-Chzrysec Brphenyl C3-Chrysc *Fluorenc C4schylsec CI-Fluoree *Benzo(b)fluoranthezn C2-Fluorne *Bcnzczk)fluorashcnr C3-Fluore• Benzo(e)pyrne *Pb t °Bezo(:a)pyreW *Anhrcen Perylene
C -Phen-nhrene/Anthracenc *Ideo(1 .2.3-cd)pyrene
C-PhenanthrneAnrhracccime 'D*benz(a.h)anthracenc
C3-Phcnaarm/ AathrneA •hrcee * o(g.h.i)perylene
C4-PhbenanthreAnthracenc Dibenzothiophene CI-Dibentothiopbene
C2-Dibenzothopbene C3-Dibenzothiopbnew SPrtorty PoUutant PAHs
Table 1.1. Low molecular weight (LMW) PAHs and high molecular weight (HMW) PAHs as defined by Menzie-Cura and Associates (1995).
Summary of Estimated HMW PAH Loadings to Massachusetts Bay by Source Type 2242 1562 395 272
1,14
iH-t~-Coastal Coastal Coastal River TOTAL
NPOES Runoff CSO D•scharge LOADING
of HMW
PAHs
Figure 1.1. Summary of estimated PAH loadings to Massachusetts Bay broken down by
source type (Menzie-Cura and Associates, 1995).
Introduction 2600 2400 2200 2000 1800 1600 1400 1200 1000 800 600 400 200 0 2242
T
iFigure 1.1. Summary of estimated PAH loadings to Massachusetts Bay broken down by source type (Menzie-Cura
The quantification of PAH concentrations in the water column is not a trivial procedure. Because of the low solubilities of hydrophobic PAHs, they tend to be found in very low concentrations in the aquatic environment, often exceeding the detection capabilities of current analytical techniques (MWRA, 1991). One may wonder why there is a need to quantify such minute concentrations. The problem lies in the ability of certain PAH compounds to elicit sublethal toxicological responses even at concentrations near or below the current analytical limits of detection (Hofelt and Shea, 1997).
The conventional procedure for quantifying PAHs requires collecting large volumes of water which are then extracted with an organic solvent. This procedure can be labor-intensive and typically overestimates dissolved PAH concentrations because it includes PAHs that may be bound to colloids and other fine particulate matter. To determine PAH concentrations for an evaluation of the potential health hazards associated with them, one needs to look at the freely-dissolved fraction at a given moment in time because only the freely-dissolved fraction is instantaneously available for uptake by aquatic organisms (Lebo et al., 1992). Also, the dose-response functions developed for compounds like benzo(a)pyrene were developed for freely-dissolved concentrations so environmental data based on total concentrations, that is, including bound PAHs, may not be comparable (Hofelt et al, 1997).
New devices, called semipermeable membrane devices or SPMDs, have recently been developed for the purpose of quantifying PAHs without the problems described above. These devices were used in this study to test their ability to determine accurately PAH concentrations in the aquatic environment. The data was sought to reveal information about the fate, including the distribution, of PAHs in the Boston Inner Harbor. The results from the measurements will be compared to the results of the mass balance and 3-D models of PAH concentrations for Boston Harbor developed by Ricardo Petroni and Peter Israelsson (1998).
2. POLYCYCLIC AROMATIC HYDROCARBONS
2.1 Chemical Structure and Properties
Polycyclic aromatic hydrocarbons, commonly referred to as PAHs, are composed of two or more aromatic rings. The term "aromatic" was originally used to describe these compounds because of their fragrant odor. Over time, the term aromatic has evolved to mean the stable nature of a particular group of organic compounds. Polycyclic aromatic hydrocarbons have greater stability and lower reactivity than similar, acyclic conjugated compounds because of resonance stabilization.
PAHs are planar hydrocarbons, that is, composed of carbon and hydrogen atoms only (Figure 2.1). The smallest and lightest PAH is naphthalene (C10oH), a PAH composed of two fused
benzene rings. On the other extreme is graphite, a form of elemental carbon.
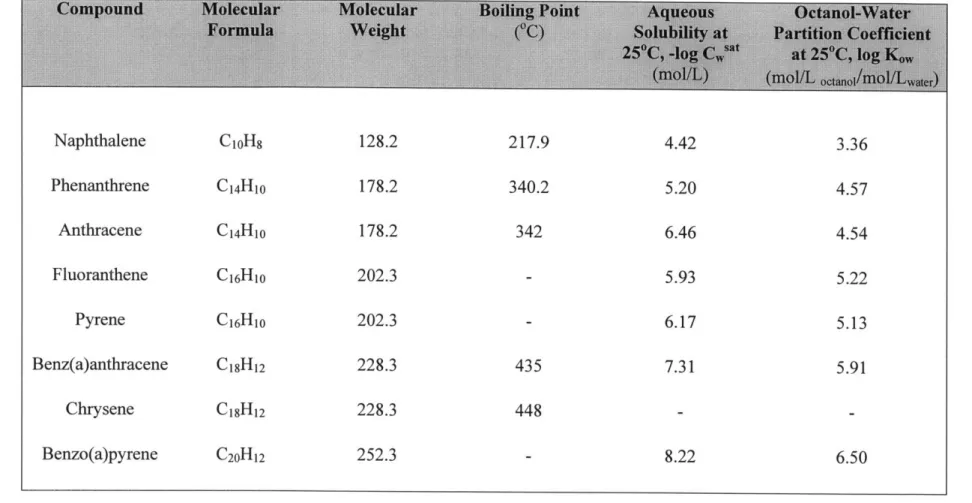
Physical and chemical characteristics of PAHs generally vary in a regular fashion with molecular weight (Neff, 1979). For example, resistance to oxidation and reduction tends to decrease with increasing molecular weight. Vapor pressure and aqueous solubility decrease almost logarithmically with increasing molecular weight (Table 2.1). In general, PAHs have very low solubilities in water because of their nonpolar, hydrophobic structures. There is a wide range in the behavior, distribution in the environment, and the effects on biological systems of individual compounds. Toxicities of individual PAHs vary widely and are of concern because some are carcinogenic, tumorigenic and/or mutagenic compounds (Crunkilton and De Vita, 1997).
0
*1"
0i 0-0
Table 2.1. Physical/chemical constants of some PAHs commonly found in the environment. Note the wide range in solubilities and
octanol-water partition coefficients. In the case of naphthalene and benzo(a)pyrene, for example, the solubilities differ by almost four orders of magnitude (Schwarzenbach et al., 1993).
In general, polycyclic aromatic hydrocarbons undergo the following reactions to varying degrees: electrophilic and nucleophilic substitutions, free radical reactions, addition reactions, reduction and reductive alkylations, oxidation, rearrangements of the aromatic ring system, and complex formations (Harvey, 1997). The transformation of PAHs through oxidation is an important reaction of PAHs. The oxidative metabolism of PAHs (e.g., benzo(a)pyrene) by the cytochrome P-450 microsomal enzymes is responsible for their carcinogenic potential in organisms (Harvey, 1997).
N N NZ - / (X N6 Naphthalene Tar Camphor While Tar Moth Flakes 2-Methylnaphthalene P-Methylnaphthalene Acenaphthene Naphthyleneethylene Phenanthrene o-Osphenylene ethyene Anthracene 4 -Methylphenanthrene 1 -Methylphenanthrene 3-Methylphenanthrene 2-Methylphenanthrene CO IN
0,
oz&N&Qc"ý
9-Methylphenanthrene Fluoranthene Idryl •2-Benzacenaphthene Benzojk] fluorene Benz(a]ac enaphthylene Benz a Janthracene I 2 Benzanthracene Tetraphene 2 3-Benrophenanthrene Naph1thanthracene Chrysene 1.2 Benrophenanthrene oenzoc a]phenanthrene Pyrene Benro(del]phenanthrene Benzof b fluoranthene 23- Genzofluoranthene 34- Senzofluoranthene Benz(feacephenanthrylene Benzo[ j] fluoranthene 78- Senzofluoranthene 10 11- Bentofluoranthene Benzo( k If luoranthene @9-Benzofluorantherfe 11 17 Benzofluoranthene Benzo e pyrene .5- Benzpyrene I 2-Bentopyrene Benzolol pyrene 1.2- 8enzpyrene 3.L-Benzoyrene Benzo(def chrysene Perylene per- Dinaphlhalene Coronene lHeiabeniobenzeneFigure 2.1. The structures of some polycyclic aromatic hydrocarbons commonly found in
the environment (Bjorseth, 1983).
2.2 Sources and Fate in the Environment
Polycyclic aromatic hydrocarbons are ubiquitous in the environment. Significant levels are found in the atmosphere, in the soil, and in the aquatic environment (Neff, 1979). The PAHs present in the atmosphere are primarily derived from the fossil fuels used in heat and power generation, refuse burning, and coke ovens. These sources together contribute more than 50% of the nationwide emissions of benzo(a)pyrene, a hydrocarbon that is widely employed as a standard for PAH emissions (Harvey, 1997). Vehicle emissions are another major source of PAHs, particularly in the urban areas of industrialized countries, contributing as much as 35% to the total PAH emissions in the USA (Bjorseth et al., 1985). Natural sources, such as forest fires and volcanic activity, also contribute to the input of PAHs into the atmosphere, but anthropogenic sources are considered to be the most significant sources of PAHs in atmospheric pollution. Because of their high melting points and low vapor pressures, atmospheric PAHs are generally considered to be associated with particulate matter (National Academy of Sciences, 1972).
The combinations of PAHs produced in pyrolytic reactions vary according to the temperature of combustion. High temperatures result in relatively simple mixtures of unsubstituted PAHs. At intermediate temperatures, such as that of smoldering wood, complex mixtures of alkyl-substituted and unsubstituted PAHs are formed (Harvey, 1997). Lower temperatures lead to products predominantly composed of methyl- and other alkyl-substituted PAHs. Crude oils formed from the fossilization of plants exhibit characteristic patterns of aromatic hydrocarbon components in which alkyl-substituted PAHs are found in a much higher percentage than unsubstituted ones (Harvey, 1997). The ratio of alkyl-substituted (e.g., methylnaphthalene) to unsubstituted compounds (e.g., naphthalene) present in a sample can be used as an indicator of the source (Speers and Whitehead, 1969; Youngblood and Blumer, 1975). Petrogenic (derived from petroleum) sources exhibit abundance patterns high in alkylated forms, while pyrogenic (derived from combusted products, including petroleum) sources are characterized by the dominance of the unsubstituted forms.
Besides being found in the atmosphere and in the soil, PAHs are widely distributed in the aquatic environment because of various pathways of transport. PAHs, bound to particulate matter carried through the air, can deposit onto aquatic surfaces; PAHs in water undergo exchange with the air depending on the concentration gradient between the two media; runoff of PAH-polluted ground sources drain into rivers and other water bodies; and municipal and industrial effluents containing PAHs are discharged into receiving waters. Direct spillage of petroleum into water also serves as a major source of PAHs (Neff, 1985). In the aquatic environment, PAHs can then enter the food chain by being absorbed or ingested by plankton, mollusks, and fish which may eventually be consumed by human populations. Because of their hydrophobicity and low solubility in water, PAHs tend to be associated with the complex matrix of organic matter in particulate matter which eventually settle to the bottom. Thus, relative concentrations of PAHs are usually highest in the sediments, intermediate in the aquatic biota, and lowest in the water column (Neff, 1985).
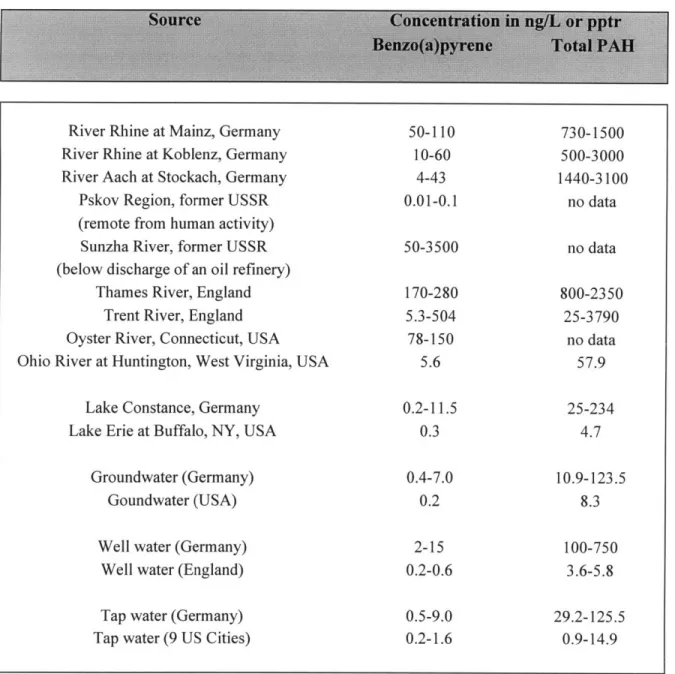
PAH concentrations in natural waters are a function of the sources and the sinks in the system. In most cases, there is a direct correlation between PAH concentrations in rivers and the degree of industrialization and other human activity along the banks and the rest of the watershed. Groundwater and well water usually contain PAH concentrations which are lower than those in river water by a factor of ten or more (Neff, 1979). PAHs in groundwater are thought to be derived from the leaching of surface waters through soils contaminated with PAHs (Borneff and Kunte, 1969; Hellmann, 1974; Suess, 1976). Purified tap water and reservoir water contain a PAH concentration similar to, or slightly higher than, that of ground water (Table 2.2).
River Rhine at Mainz, Germany 50-110 730-1500
River Rhine at Koblenz, Germany 10-60 500-3000
River Aach at Stockach, Germany 4-43 1440-3100
Pskov Region, former USSR 0.01-0.1 no data
(remote from human activity)
Sunzha River, former USSR 50-3500 no data
(below discharge of an oil refinery)
Thames River, England 170-280 800-2350
Trent River, England 5.3-504 25-3790
Oyster River, Connecticut, USA 78-150 no data
Ohio River at Huntington, West Virginia, USA 5.6 57.9
Lake Constance, Germany 0.2-11.5 25-234
Lake Erie at Buffalo, NY, USA 0.3 4.7
Groundwater (Germany) 0.4-7.0 10.9-123.5
Goundwater (USA) 0.2 8.3
Well water (Germany) 2-15 100-750
Well water (England) 0.2-0.6 3.6-5.8
Tap water (Germany) 0.5-9.0 29.2-125.5
Tap water (9 US Cities) 0.2-1.6 0.9-14.9
Table 2.2. Typical concentration ranges of benzo(a)pyrene and total PAHs in various aquatic systems. These values were taken from Tables 33 and 34, pp. 67-68 of Polycyclic Aromatic Hydrocarbons in the Aquatic Environment (Neff, 1979). For exact references of individual measurements, see Neff (1979).
In general, PAHs are quite stable and persistent, especially once they have become incorporated into the anoxic environment of bottom sediments. Under certain conditions, they can be subjected to various chemical transformations and degradative processes. In the
natural environment, the most important processes are photooxidation and biological transformation (Neff, 1985). The delocalized pi-electron orbital system in PAHs makes them susceptible to direct photolysis (the absorption of light energy directly) (Neff, 1985). PAHs can also be transformed or metabolized by microorganisms such as bacteria, fungi, and algae (Warshawsky et al., 1995). In aquatic systems, biodegradation occurs in oxidized, surficial sediments (Shiaris, 1989). The rates of PAH degradation tend to decrease with increasing molecular weight (Neff, 1985).
3. BOSTON HARBOR BACKGROUND AND HISTORY
3.1 Physical and Hydrographic Characteristics
Boston Harbor is located in the Northwest corner of Massachusetts Bay, which is itself a part of the Gulf of Maine. Boston Harbor comprises an area of about 50 square miles, bounded by
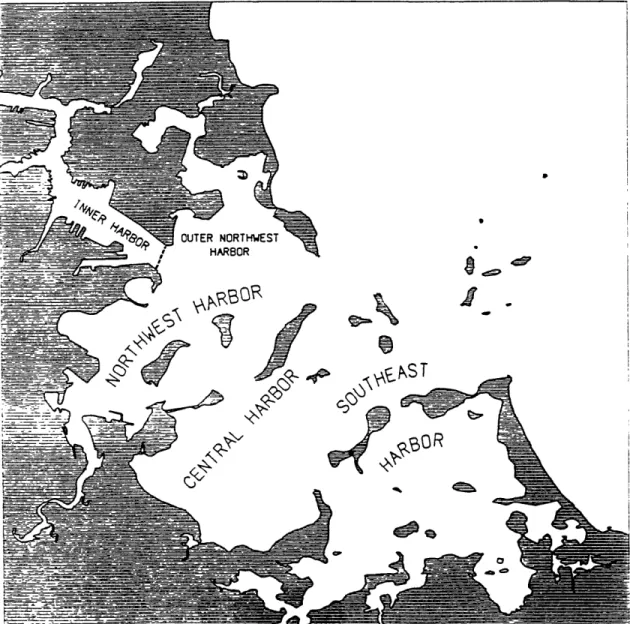
180 miles of shoreline. The harbor can be divided into sub-regions which are easily defined by topographical boundaries (Figure 3.1). The regions north and south of the boundary
between Dorchester Bay and Quincy Bay are commonly referred to as the North Harbor and South Harbor, respectively. The North Harbor can further be divided into the Inner Harbor and the Northwest Harbor while the South Harbor can further be divided into the Central Harbor and the Southeast Harbor.
The focus of this study is the Boston Inner Harbor region shown in Figure 3.2. The Inner Harbor is bound by the confluence of the Mystic and Chelsea Rivers up North and the entrance to Massachusetts Bay down South. The volume of the Inner Harbor varies from approximately 7.8 x 10⁷ m3 at high tide to 5.6 x 10⁷ m3 at low tide. The Inner Harbor is
relatively shallow, with a nearly constant depth of 10 m under mean low water (MLW) conditions (Bumpus et al., 1953; Alber and Chan, 1994). During winter, the residence time of water in the Inner Harbor is approximately 2.7 days (Petroni and Israelsson., 1998).
Boston Harbor is only slightly stratified by salinity gradients because its freshwater input is relatively small compared to tidal flushing. The Inner Harbor receives freshwater inputs from the Charles River, Mystic River, and Chelsea River. The largest input is from the Charles
River with an average flow (1931-1992) of 8 x 10⁶ m3/day (USGS, 1992). In the summer
months, Boston Harbor becomes thermally-stratified. the thermal stratification contribute to surface Massachusetts Bay; but, overall, this mechanism (Stolzenbach and Adams, 1998).
The density currents that result from and bottom water exchange with is minor relative to tidal flushing
MAMUUM
S=4
X/C
Figure 3.1. Boston Harbor.
Boston Harbor Background and History
A
/
I
I _ ___ ___ i __ ~i_
·__~___~____e__l__~=_ II__ C==iL~- --. _ ____~ __r -3i3i
Lii=~· ~i---
---I-- ---I---I---I---I-- ---I---I--iii--- ---3 --_~i~=_
P
REVERE EVERETT CHELSEA McArdle EAST BOSTON CHARLES
and Callahan Turnnels
Logan Airport
SThird Harbor Tunnel (Proposed)
BOSTON
Deepen
Mystic River to 40'
Inner Confluence to 40' Reserved Channel to 40'
Chelsea River to 38' SOUTH BC
Scale in Feet
0 2000' 4000'
ere
)STON
US Army Corps of Engineers
New England Division
Boston Harbor, Massachusetts Navigation Improvement Project
July 1993
Figure 3.2. Boston Inner Harbor (USACOE, 1988). The sampling locations of this study are
marked with a filled circle( * ).
3.2 Sources of Contamination in Boston Harbor
Contaminants have both point and non-point sources in Boston Harbor. These include tributary rivers and groundwater flows, runoff from stormwater drains and combined sewer overflows, industrial discharges, ship and boat traffic, sewage and sludge discharges from treatment plants, and the atmosphere.
Each of the six major tributaries (Charles River, Neponset River, Weymouth Back River, Mystic River, Weymouth Fore River, and Weir River) which empty into the harbor carry with them varying levels of contaminants. The identities and the concentrations of these contaminants vary according to the domestic and industrial activities within the corresponding watersheds. Groundwater flowing into the harbor's shoreline also carries with it contaminants resulting from current human activities and leachate from wastes in old landfills (Alber et al., 1994).
In the 1800s, combined sewer-storm drains (commonly referred to as combined sewer overflows or CSOs) were constructed by the surrounding towns of Boston, Cambridge, Chelsea, and Somerville (MWRA, 1993) to handle both sewage and rainwater flows. During heavy rain, some of these drains still empty directly into the harbor along the shoreline or into tributaries which ultimately flow into Boston Harbor. Outflows from CSOs can carry significant loads of contaminants into Boston Harbor. Stormwater runoffs carry contaminants that have been washed away from the ground surface. Spilled motor oil on roadways and driveways, for example, winds up in storm drains after being washed away by the rain. Of the over 80 CSOs that discharge a combination of storm water and raw or partially-treated sewage into Boston Harbor, 35 CSOs discharge directly into the Inner Harbor. As of 1992, the average flow from these CSOs corresponded to about 1% of the average Charles River
input (Chan-Hilton et al., 1998).
Many industries developed along the harbor shoreline in the late 1800's. Historically, these industries were able to discharge their raw wastes directly into the harbor. Even in this era of heavy regulation, industries are still allowed to discharge controlled concentrations of chemical wastes into the water. Both industrial (commercial) and private boat and ship traffic also contribute to contamination in the harbor through fuel leaks and motor emissions.
Sewage effluent and associated sludge discharges have, by far, been the largest sources of organic contaminant input into Boston Harbor. Starting in 1878, sewage vats on Moon Island with a capacity of 50 million gallons discharged raw waste into the harbor twice daily with the outgoing tide (MWRA, 1996). Raw sewage pump stations were constructed in East Boston in 1889 and on Deer Island in 1899. It was not until 1952 that the first primary wastewater treatment plant was constructed on Nut Island. This facility provided screening and sedimentation of solids and chlorination to reduce bacterial levels which had become a recognized health risk within the harbor (Stolzenbach et al., 1998). Starting in 1968, primary treatment was begun at Deer Island and the Moon Island outfall was reserved for wet weather flows only (ceased in 1992). A new primary treatment plant was constructed in 1995 at Deer Island and was upgraded to secondary treatment in 1997. A new outfall discharging 9.5 miles out into Massachusetts Bay is expected to be in operation at the end of 1998. As of 1991, the Boston sewer system was transporting an average 500 million gallons of sewage per day from Boston and surrounding communities to the Deer Island and Nut Island sewage plants (MWRA, 1991).
According to Alber et al. (1994), the total (LMW+HMW) PAH input (Table 1.1) into Boston Harbor was approximately 20,000 kg/yr. Most of this total PAH input originated from sewage effluent and sludge discharge. However, the major source of low molecular weight PAHs like 2-methylnaphthalene (total loading of 1,800 kg/yr) was found to be sewage, while that of high molecular weight compounds like benzo(a)pyrene (total loading of 22 kg/yr) was found to be tributaries. Their study also estimated that 89% of the 2-methynaphthalene
discharged into the harbor was added to the North Harbor and 73% of the benzo(a)pyrene was added to the South Harbor (Alber and Chan, 1994).
4. PROBLEM STATEMENT AND OBJECTIVES
Measurement of aqueous concentrations of organic contaminants such as polycyclic aromatic hydrocarbons is problematic. Because of their nonpolar and highly hydrophobic nature, they tend to be associated with dissolved organic matter such as humic acids and suspended solids. As a consequence, their truly-dissolved concentrations in the water column are typically at trace levels, on the order of parts per billion or less (Table 2.2). These aqueous concentrations are frequently below conventional detection limits, thus requiring concentration of the contaminants. A gas chromatograph with a flame ionization detector,
for example, typically has a detection limit in the order of a few nanograms per microliter or a few parts per million.
It is important to quantify the truly-dissolved concentrations of chemical compounds in surface waters for two main reasons. First, water quality criteria and aquatic toxicity data are typically based on truly-dissolved concentrations. Second, in order to completely characterize the fate of a particular chemical of interest, one needs to look at its physical-chemical phase distribution because this plays a significant role in determining its physical-chemical behavior. This applies to both inorganic and organic compounds of toxicological interest. For example, in natural waters, nearly all of the mercury that accumulates in fish tissue is in a dissolved methylated form, methylmercury (CH3Hg) (CA EPA, 1994). This form of mercury also happens to be the most toxic form of mercury, capable of causing serious damage to the nervous system. The inorganic forms of mercury, such as the free metal, are less efficiently absorbed and more readily eliminated from the body than methylmercury. They do not tend to bioaccumulate and are, therefore, of less concern from a toxicological point of view.
PAHs bound to particulate matter have reduced bioavailability and toxicity (Crunkilton and De Vita, 1997). For example, only truly-dissolved contaminants are instantaneously available for bioconcentration across biological membranes such as fish gills (Moring and Rose, 1997). Direct measurement of PAHs in bulk (or unfiltered) water samples from natural aquatic systems which may contain moderate to high concentrations of suspended solids can therefore lead to a misleading estimate of the concentration immediately available for uptake by biota. A large fraction of soot-bound PAHs, for example, is unavailable for equilibrium partitioning with the water and may be irreversibly bound on time scales of 50-100 years (McGroddy et al., 1996).
In an attempt to quantify only the dissolved fractions of organic compounds in water, large quantities of water are filtered with filters with sub-micron pores and the "dissolved" contaminants are then extracted into an immiscible organic solvent in which the compounds have greater solubilities. The solvent typically has a low boiling temperature so that it can be further concentrated through volatilization. The cost associated with this type of analytical procedure makes it unacceptable for implementation in a routine contaminant monitoring program. As a result, bulk or unfiltered water samples are often analyzed instead, leading to a definite overestimation of the truly-dissolved concentration of contaminants.
Even the use of filters does not guarantee that only the truly-dissolved fraction will be measured. Particles in a filtered solution considered to be dissolved may range in size up to 0.1 p~m which is about 100 times greater than the largest size hydrophobic molecules which can cross biological membranes by passive processes (Crunkilton and De Vita, 1997). When this "dissolved" fraction is analyzed, contaminants bound to these very small particles are included, still leading to an overestimation of the total amount of bioavailable contaminants.
The collection and subsequent filtration of large samples for extraction is also a labor-intensive process complicated by quality assurance and quality control (QA/QC) issues. Volumes typically ranging from 4 to 10 L per sample need to be collected and transported.
These water samples then need to be stored in containers that would protect the PAHs from photodegradative processes. The EPA requires the use of large amber bottles or foil-lined containers for this purpose. It is also important that the method of collection and transport minimize volatilization from the samples. Once the samples are collected, they have to be extracted and analyzed in a timely fashion. For aqueous samples, the EPA recommends a holding time of 7 days (EPA, 1998b).
Another problem with the conventional method is that grab samples will only reflect the concentrations at the moment of sampling. Random events such as the passing of a leaky motor boat at the sampling location may give an unreasonably high concentration at that location that is not representative of typical conditions. In aquatic systems with varying levels of flow and concentrations over a tidal cycle, for example, concentrations at a given point in time may be deceptive.
An alternative, cost-effective, and convenient method has been sought after that can be used to derive a more toxicologically-relevant measure of available PAHs in the field. A relatively new approach toward this end is the use of semipermeable membrane devices or SPMDs. SPMDs were developed in the early 1990's by researchers at the Environmental and Contaminants Research Center of the U.S. Geological Survey (Huckins et al., 1993). SPMDs are designed to sample only the truly-dissolved fractions of organic compounds and also provide a time-averaged concentration of compounds. Because they are synthetic, uniform physical devices, the development of a standardized protocol for the monitoring and assessment of trace contaminants in diverse environmental settings should also be possible. This is an advantage over the use of bivalves or fish, organisms typically used in monitoring trace contaminant uptake, because organisms tend to have anatomical, physiological, and behavioral differences which can affect their rate of contaminant uptake (Ellis et al., 1995).
The objective of this study was to examine the utility and applicability of SPMDs for the assessment of the fate of PAHs in the Boston Inner Harbor. A distribution of sampling points
over the Inner Harbor was chosen to reveal possible variations in the sources and sinks of PAHs in the Harbor and other relevant information about their fate. In order to evaluate their effectiveness, the results from the SPMD measurements were compared to those predicted by mass-balance and 3-D hydrodynamic modeling of PAH transport in the Inner Harbor.
5.
SEMIPERMEABLE MEMBRANE DEVICES
5.1 Historical Development
The use of organic solvents to extract hydrophobic organic compounds from aqueous solutions is a well-established procedure (Santodonato et al., 1981). Chemists often use so-called liquid-liquid extractions to transfer organic compounds in water to a water-immiscible organic solvent for which the target compound has greater affinity. Typically, the water sample is vigorously mixed with the solvent (e.g., methylene chloride) to allow the target compounds to dissolve into the solvent. The water and the organic solvent are then allowed to separate and the solvent is extracted. These procedures employ the organic solvent-water partitioning properties of hydrophobic compounds which, at equilibrium, can be described by their K,,sw:
C_[mol/Is1
Cw mol/ LwJ'where Ksw = solvent-water partitioning coefficient, Cs = concentration in the solvent,
Cw = concentration in the water.
As the equation demonstrates, the greater the Ksw for the analyte, the greater the concentration in the solvent as compared to water. One way of interpreting the physical meaning of the Ksw is by thinking in terms of volumes; for a given number of moles of a compound in one liter of a particular solvent, Ksw liters of water will be required to hold the same number of moles. In the case of a highly hydrophobic compound like benzo(a)pyrene which has a log Ksw of 6.50 in octanol at 250C (Schwarzenbach et al., 1993), 1 liter of octanol in contact with water will hold a mass of benzo(a)pyrene equivalent to that dissolved in 3,200,000 liters of the water.
The low aqueous solubilities of many organic compounds, especially hydrocarbons, result in low concentrations that are difficult to quantify. For example, benzo(a)pyrene has an aqueous solubility of only 10-8.22 mol/L or 1.52 ptg/L at 250C. The capacity of certain solvents
for dissolving organic compounds out of water can thus be used to concentrate them to levels which can be more easily measured. This concept has been used extensively in laboratory settings, but it has only been applied to in-situ field sampling recently. Field deployment requires a convenient means of separating the solvent from the water so that the solvent can later be collected and analyzed, while still allowing for the transfer of targeted compounds from the water and into the solvent. In the last couple of decades, various groups have developed the use of semipermeable membranes for this specific application.
Huckins et al. (1990) credit a group led by Miere (1977) as the first investigators of the use of polyethylene film for dialysis of nonpolar organic contaminants from water into organic solvents. Their work suggested that nonporous, synthetic polymeric films, including low density polyethylene and polypropylene, could serve as semipermeable membranes allowing for diffusion and concentration of organic molecules from water into relatively nonpolar organic solvents. This process is governed by solvent-water partitioning coefficients which, in the case of hydrophobic compounds, strongly favors concentration into the organic solvents.
In 1980, a pair of investigators from the United Kingdom obtained a patent for a device consisting of a nonpolar organic solvent contained in a semipermeable membrane such as regenerated cellulose, vinyl chloride, polyvinylidene fluoride, or polytetrafluoroethylene. As stated in the patent, the device was to be used as a concentrator for removing organic contaminants from aqueous systems (Byrne and Aylott, 1980). Their design represented a new application of dialysis to liquid-liquid extraction of organic compounds from an aqueous environment.
In 1987, Sodergren used solvent-filled dialysis membranes to simulate uptake of pollutants by aquatic organisms (Sodergren, 1987). In his study, he used dialysis membranes to crudely
mimic biological cell membranes and 3 mL of n-hexane as the lipid pool capable of collecting lipophilic organic compounds. The solvent-filled bags were exposed to organochlorine aqueous solutions (p,p'-DDE, p,p'-DDT, Clophen A50) in the lab for 8-10 days and various aquatic environments in the field (e.g., a 4-day exposure to a bleach pulp plant effluent and a 2-week exposure to an activated sludge basin of a sewage treatment plant) to examine uptake behavior. The samples were analyzed by using a syringe to penetrate the membrane and extract the solvent and shooting the extract directly into a gas chromatograph (GC) without any clean-up procedure.
Johnson extended this study by using bigger volumes of n-hexane (40 mL) and performing a 32-day exposure of the bags to well water to examine the uptake kinetics of Arochlor 1248 into the bag (Johnson, 1991). As in Sodergren's study, the n-hexane was injected directly into the GC after extraction from the bags. He also used fugacity-based bioconcentration kinetics, interpreted with respect to Fickian diffusion across water and a lipid, to provide a theoretical basis for the observed behavior of the solvent-filled bags.
In the early 1990's, researchers led by Huckins at the US Geological Survey's Midwest Science Center developed a design based on the organic solvent-water partitioning concept used in the previous studies (Sodergren, 1987; Johnson, 1991). Their design, which they named Semipermeable Membrane Device (SPMD), consists of a 91-cm long strip of low density polyethylene (LDPE) film as the membrane and the lipid, triolein, as the organic solvent. Huckins and his group also developed a mathematical model of the uptake and dissipation kinetics of the SPMDs (Huckins, 1993). While Johnson used his solvent-filled bags for qualitative monitoring only, these SPMDs are designed to quantitatively determine analyte concentrations in the field based on measured concentrations in the triolein after a given exposure time. The design and the kinetics model of these standardized and commercially-available SPMDs are discussed in more detail in the following sections. Huckins and his group also patented a new procedure for performing the analysis on these
devices (US Patents #5,098,573 and 5,395,426). Unlike Sodergren's and Johnson's
procedure, where the lipid was shot directly into the GC, a dialysis is performed on SPMDs
to first extract the analytes from the triolein. The dialyzing solvent, e.g. cyclopentane, is then concentrated using volume reduction techniques and fractionated into various groups
(e.g. PAHs, halogenated compounds, etc.) before analysis by a GC.
Since their development, these devices have been used and tested for a wide variety of purposes in diverse environmental settings. In recent years, SPMDs have been used to measure freely-dissolved concentrations of organic contaminants in urban streams (Crunkilton and De Vita, 1997), to determine contaminant residence times in an irrigation water canal (Prest et al., 1997), to evaluate the bioavailability of contaminants associated with sediments (Cleveland et al., 1997), to quantify organic contaminant concentrations in compost (Strandberg et al., 1997), to simulate uptake by bivalves, the traditional biomonitors (Hofelt and Shea, 1997), and to develop a spatial distribution of PAH concentrations in urban streams (Moring and Rose, 1997).
SPMDs have been deployed in the waters of Dorchester and Duxbury Bays in Massachusetts (Peven et al., 1996), the metropolitan areas of Texas (Moring et al., 1997), the Upper Mississippi River (Ellis et al., 1995), the San Joaquin and Sacramento Rivers in California (Prest et al., 1992), Corio Bay in Australia (Prest, Richardson et al., 1995), and Central Finland (Herve et al., 1995), among others. They have also been used for toxicity testing of sediments from Antarctica (Cleveland et al., 1997). Note that SPMDs are also capable of extracting organic compounds from the air and have been used as passive air samplers (Petty et al., 1993 and Prest et al., 1995) for organic contaminants.
5.2. Design of SPMDs
A semipermeable membrane device consists of two components: the membrane and the
solvent or sequestration phase. The membrane is typically a thin-walled (50-250 micrometers) nonporous polymer like LDPE, plasma-treated silicone or silastic, polypropylene, polyvinylchloride, or other similar materials (Huckins' tutorial, 1997). Although the membranes used in SPMDs are typically referred to as "nonporous", they actually have pores up to approximately 10 A in diameter. The pores are transitory and are formed by the random thermal motions of the polymer chains. For the membrane to serve its purpose well, it needs to retain the sequestering phase within the membrane while allowing for the diffusion of target compounds. The lower limit of the molecular size of the sequestration phase or solvent is such that the solvent molecules are not able to cross the membrane and escape to the surrounding water to a significant extent.
Besides containing the solvent within the device, the small diameters of these cavities dictate an upper limit for the sizes of the compounds that can penetrate the membrane and reach the solvent. Huckins pointed out that the diameters of many environmental contaminants of interest approach the maximum size of the pores in nonporous membranes; therefore it is likely that analytes associated with aqueous particulate matter and dissolved organic carbon, such as humic acids, cannot penetrate the membrane (Huckins, 1993). The use of nonpolar membranes will also impede the passage of ions into the membrane. SPMDs can therefore be expected to sequester only freely-dissolved, nonionic compounds, an advantage over conventional PAH sampling procedures.
Studies have shown that polar nonporous membranes such as cellulose can reduce or eliminate solvent losses to the surrounding environment, but a corresponding reduction in the uptake rates of nonpolar analytes was also observed (Huckins, 1993). A study by Gray et al. (1991) compared the concentration potential of lipid-containing polyethylene membranes to hexane-filled cellulose dialysis bags (Sodergren, 1987) and found that lindane and trifluralin
were sequestered to a much a greater extent in the former.
The sequestration phase is typically a large molecular weight (2 600 Daltons) nonpolar liquid such as a neutral lipid, silicone fluid, or other lipid-like organic fluid (Huckins' tutorial, 1997). Various investigators have used relatively low molecular weight, nonpolar compounds like hexane, but this resulted in losses to the surrounding water because of their membrane solubility and permeability. Huckins et al. (1993) noted that the diffusion of the sequestration phase out of the membrane may also impede analyte uptake because the analyte will have to diffuse against an outward solvent flux leading to concentration polarization at or near the membrane exterior surface. Obviously, this problem is eliminated when a solvent is chosen such that the molecules are too large to significantly diffuse through the membrane.
Huckins' commercially-available standardized SPMDs consists of LDPE layflat tubing and high-purity synthetic triolein (> 95%). The SPMDs are 2.5 cm wide by 91.4 cm long flat tubes which contain 1 mL (0.915 g) of triolein as a thin film spread over the entire tube. The LDPE tubing is 75-90 micrometers thick. The SPMDs are heat-sealed at both ends.
Triolein or glyceryl trioleate is 9-octadecenoic acid, 1,2,3-propanetriyl ester. It has a molecular weight of 885.45 g and consists of 57 C's, 104 H's, and 6 O's (Budavari (ed.) et al., 1996). Triolein is approximately 27 angstroms in length and approximately 28 angstroms in breadth so it should not be able to diffuse through the 10-angstrom cavities in the membrane to a significant extent. Triolein is the major neutral lipid in many aquatic organisms and was chosen as the sequestration phase because SPMDs are designed to simulate bioaccumulation in aquatic organisms. Chiou's work (1985) demonstrated that when the published bioconcentration factors (BCF) of organic compounds in water, that is, the ratio of the steady-state concentration of a compound in the organism (or a part of it) compared to that in water, are based on lipid content rather than on total mass, they are approximately equal to the equilibrium triolein-water partition coefficients, Kt. This suggests that partitioning of organic compounds between fish and the surrounding water are determined by the near equilibrium partitioning between triolein and water. The uptake of
organic contaminants by SPMDs can therefore simulate passive, that is, non-metabolic, uptake of organic contaminants by fish and, perhaps, other aquatic organisms.
Besides minimizing solvent loss and simulating bioconcentration, the use of pure triolein as the sequestering media for SPMDs has other major advantages. Chiou demonstrated that there is a close correlation between Ktw's and the corresponding octanol-water partition coefficients, Kow's, for many organic compounds (Chiou, 1985). Figure 5.1 shows a plot of the log Ktw's versus the log Kow's of a wide range of organic compounds. Table 5.1 lists some of the actual values for log Kt that were measured by Chiou and the corresponding published log Kow's.
As demonstrated by Figure 5.1, a compound's Ktw can be closely approximated by its Kow, a value that is well documented by the pharmaceutical industry because of its significance in toxicity studies. In addition, since Kow's are large for hydrophobic organic contaminants (see Table 5.1), the concentration capacity of triolein-containing SPMDs for these contaminants is also large. 0
5
04 03
(4 C 2 0 C U 0 I-0 Figure 5.1. Correlati 1985). 1 2 3 4 5 6Octanol-Water Partition Coefficient. Log Ko
of log Ktw with log Kow for selected organic 7
compounds (Chiou,
Semipermeable Membrane Devices
36, P37838~ 34 29/ ~2 22 20ý9 17 10 2 16 96 4 201 p on r, LI
Table 5.1. A comparison of log Kow values compounds (Chiou, 1985).
versus log Kt, values for a range of organic
Semipermeable Membrane Devices
aniline 0.90 0.91 benzene 2.13 2.25 hexachloroethane 4.14 4.21 1,2,4,5-tetrachlorobenzene 4.70 4.70 2-PCB 4.51 4.77 2,5,2',5'-PCB 5.81 5.62 p,p'-DDT 6.36 5.90
5.3. Uptake Kinetics of SPMDs
In modeling the uptake kinetics of compounds from water into the SPMDs, Huckins et al.
(1993) made the following assumptions: a) the chemical concentration in the water is
constant and there is no significant resistance to diffusion in the lipid (i.e., rapid mixing occurs), b) the steady-state flux, F, of an analyte into the device is controlled by the sum of the resistances to mass transfer in the membrane and a water boundary layer, and c) the capacity of the membrane to dissolve chemicals is negligible.
The diagram below shows an exploded view of a membrane bounded by water on one side and solvent on the other. In the case of Huckins' SPMD, the membrane is polyethylene and the solvent is triolein.
[1
UIKC
Cm
-Ml
Cvl0ir
,
mb
membrane
, water film trioleinS = concentration in the triolein
Figure 5.2. An exploded view of the triolein-membrane-water film model. The diagram shows the tortuous pathways created by the membrane polymer which allow for retention of the triolein and transport of smaller compounds through the membrane. (Drawing courtesy ofAna Pinheiro.)
Semipermeable Membrane Devices
At constant temperature, the flux F (g/h) is given by the mass-transfer equation:
dCs D
(1) F = Vs dCs = A(CMo - Cm) = kpA(CMo - Cw) = kwA(Cw - Cwi)
dt Y
where D = diffusivity or permeability of the analyte in the membrane (m2/h)
A = membrane surface area (m2) Y = membrane thickness (m)
k,= membrane mass-transfer coefficient (MTC) = D/Y (m/h) kw = water boundary layer MTC (m/h)
Vs = volume of the lipid or solvent used for the sequestering media (m3) t = time of exposure (h)
CMO = analyte concentration at the outer surface of the membrane (g/m3 membrane) CMI = analyte concentration at the inner surface of the membrane (g/m3 membrane) Cw = analyte concentration in the bulk water (g/m 3 water)
Cwi = analyte concentration at the interface or the water boundary layer (g/m3 water) Cs = analyte concentration in the solvent (g/m3 solvent)
= Ct in Figure 5.2, where t refers to triolein.
Defining equilibrium partition coefficients for the inner membrane and the solvent as
KMs = CMI/Cs, for the outer membrane and water as KMW = CMo/CwI, and for the solvent and water as Ksw = Cs/Cw, the interfacial concentrations can be eliminated and equation (1) can be simplified to
dCs
(2) F = Vs = koA(CwKfw - CsKMs) dt
where ko is the overall MTC and is a measure of the combined resistances of the water-boundary layer and the membrane to molecular transport:
1 1 Kmw
(3)
-
+k
Implicit in this equation is the assumption that the resistances for the membrane, 1/kp, and the water layer, KMw/kw, are additive and independent of each other. It has been suggested that in the case of the solvent, triolein, and the membrane, polyethylene, the membrane resistance
is typically the dominant term so ko is approximately equal to kp. In the case of a very large value for KMw, the second term can become significant and the resistance may become dominated by the water boundary layer. There is currently insufficient data on the transition from membrane-controlled diffusion to aqueous film-controlled diffusion for SPMDs.
Assuming that Cw is constant, integrating equation (2) yields KMw
(4) Cs = Cw (1 - exp(-koAKMst / Vs)) = CwKsw(1 - exp(-kut))
KIS
where ku = overall uptake rate constant (hrl )
KMs
(5) k = koA s Vs
and the response time, zr, for the analyte in the SPMD is given by the reciprocal of ku. Huckins' model is similar to those used by other investigators who have modeled other membrane systems (Johnson, 1991; Hassett et al., 1989; Yasuda, 1967).
The value of ku can be determined by measuring the loss or dissipation of a compound from the device into pure water over time. This assumes that the uptake behavior of the system is identical to its dissipation behavior. The loss from the SPMD can then be described by the following equation where Cso is the initial concentration of the compound:
(6) Cs = Csoexp(-kut).
Equation (4) can be modified to account for the lag time, to, required for the analyte to first penetrate the membrane resulting in a delay in the concentration increase in the solvent. In the early stages of uptake, to is the positive intercept of the model on the time axis.
(7) Cs=I - exp koAKs (t -t°) jKswCw , t > to.