This is an author-deposited version published in:
http://oatao.univ-toulouse.fr/
Eprints ID: 5744
To link to this article:
DOI:10.1016/J.DESAL.2008.11.038
URL:
http://dx.doi.org/10.1016/J.DESAL.2008.11.038
To cite this version:
Causserand, Christel and Pierre, Gwenaelle and
Rapenne, Sophie and Schrotter, Jean-Christophe and Sauvade, Patrick and
Lorain, Olivier (2010) Characterization of ultrafiltration membranes by
tracer's retention:Comparison of methods sensitivity and reproducibility.
Desalination, vol. 250 (n° 2) pp. 767-772. ISSN 0011-9164
O
pen
A
rchive
T
oulouse
A
rchive
O
uverte (
OATAO
)
OATAO is an open access repository that collects the work of Toulouse researchers and
makes it freely available over the web where possible.
Any correspondence concerning this service should be sent to the repository
administrator:
[email protected]
Characterization of ultrafiltration membranes by tracer's retention:
Comparison of methods sensitivity and reproducibility
☆
Christel Causserand
a,⁎
, Gwenaelle Pierre
a, Sophie Rapenne
b, Jean-Christophe Schrotter
b,
Patrick Sauvade
c, Olivier Lorain
daLaboratoire de Génie Chimique (UMR 5503), Université de Toulouse, Université Paul Sabatier, 31062 Toulouse cedex 09, France bVeolia Environnement, Anjou Recherche, Chemin de la Digue, BP 76, 78603 Maisons-Laffitte Cedex, France
cDegrémont Technologies, Aquasource, 20 avenue Didier Daurat, BP 64050, 31029 Toulouse, France dPolymem, Impasse de Palayré, 31100 Toulouse, France
a b s t r a c t
Previous studies have shown that the absolute membrane cut-off and the value quoted by the manufacturers may be very different because of differences in methodologies and testing conditions. The origin of this discrepancy is often difficult to identify as the characterization method used by the membrane manufacturers is not specified. The goal of this study is to evaluate in terms of sensitivity, repeatability and reproducibility the methodologies used by a working group including membrane manufacturers, end-users and a research laboratory. The five selected membranes are hollow fibers used in drinking water pro-duction. They are made of various materials with different configurations (internal–external and external– internal type) and molecular weight cut-offs. Different types of tracers are used: dextrans, poly (ethylene glycol)s, poly(ethylene oxide)s, MS2 bacteriophage filtrated in single sized solution or in mixture. Results collected lead to a better understanding of the origin of discrepancies and allow to define the best operating conditions (tracer's type, working conditions range, data treatment methods,…) providing the most appropriate, accurate and reproducible testing protocol according to the selected application.
1. Introduction
In ultrafiltration, the membrane selectivity is driven by the porous structure, which is characterized by the sieving curves. These curves are obtained from a plot of retention of some selected solutes, called tracers, versus their molar mass. Tracers have to satisfy multiple criteria such as: (i) well defined size (ii) minimum membrane interaction to limit fouling during the characterization procedure; (iii) availability in a large range of size; (iv) reasonable price. From sieving curves, manufacturers generally define the membranes nominal cut-off as the molar mass of the solute that is (or would be) 90% retained by the membrane. However, numerous authors [e.g.1,2]have shown that the absolute membrane cut-off and the value quoted by the manufacturers may be very different because of differences in methodologies and testing conditions. The origin of this discrepancy is often difficult to identify as the characterization method used by the membrane manufacturers is not specified. For instance previous studies have shown differences between the filtration of single tracers and mixtures. This is explained by the pore blockage of larger tracer's molecules which therefore enhance
the retention of the smaller ones leading to an underestimation of the measured cut-off in mixture[3].
In most applications such as water treatment, the quantification of an absolute cut-off is a critical factor in assessing the ability of a membrane to potentially remove particles or micro-organisms.
In this paper, experimental results from a working group includ-ing membrane manufacturers, end-users and a research laboratory are presented and discussed. This consortium is working under the framework of the “POME” project supported by the French National Research Agency. The goal of this study is to evaluate the methodologies used by each other in terms of sensitivity, repeatability and reproducibil-ity. The overall objective of this work is to define a robust protocol and the associated operating conditions necessary to characterize membrane properties according to the final application, i.e. water filtration.
The selected membranes are hollow fibers used in drinking water production. They are made of various materials: polyethersulfone, polysulfone, polyvinyl difluoride or cellulose acetate, with different configurations (internal–external and external–internal type) and molecular weight cut-off. Different types of tracers are used: dextrans, poly (ethylene glycol)s, poly(ethylene oxide)s. Filtration with single tracers will be performed with poly (ethylene glycol)s, and poly (ethylene oxide)s whereas only mixtures will be used for dextrans.
Results collected in this study lead to a better understanding of the origin of discrepancies and allow to define the best operating
☆ Presented at the Conference on Membranes in Drinking and Industrial Water Production, 20–24 October 2008, Toulouse, France.
⁎ Corresponding author. Tel.: +33 561 55 86 90.
conditions (tracer's type, working conditions range, data treatment methods,…) providing the most appropriate, accurate and reproduc-ible testing protocol according to the selected application.
2. Materials and methods
2.1. Solutes and analytical equipment
The characterization tests were performed according to the French AFNOR (Association Française de Normalisation) Standard NF X 45-103[4]. The tracers' solution to be used should have a wide molar mass distribution corresponding to partial rejection coefficients ranging from 0 to 100% by the tested membrane. Depending on the announced cut-off of the membrane, the French Standard recom-mends the use of mixtures of Poly (ethylene glycol) or of dextran molecules.
In the present study these two types of tracers were used, filtrated in single sized solutions or in mixtures. Finally viral challenges tests were also conducted with a bacteriophage: MS2.
2.1.1. Dextrans solution
Dextrans are polydisperse synthetic polymers. Depending on the selectivity of the tested membrane, two mixtures have been selected: Mixture no. 1: T10: 25%w, T40: 50%w, T70: 25%w for a total con-centration of 2 g L− 1 (Sigma-Aldrich);Mixture no. 2: T70: 25%w,
T110: 50%w, T500: 25%w for a total concentration of 2 g L− 1
(Sigma-Aldrich).
Sodium azide (NaN3 0.1 g L− 1) was added to prevent bacterial
proliferation.Single sized solution of Blue dextran 2000 kg mol− 1was
also used in this study (Sigma-Aldrich) at a concentration of 0.5 g L− 1.
2.1.2. PEGs/PEOs solution
Poly (ethylene glycol)s (PEGs) are monodisperse synthetic poly-mers. Above the molar mass 35 kg mol− 1 they are only available
under oxidized form: poly (ethylene oxide)s (PEOs). The concentra-tion of PEG/PEO single sized soluconcentra-tion is 1.0 g L− 1. In the case of PEGs in
mixture, the concentration of each fraction is 1 g L− 1with the
addi-tion of sodium azide at 0.1 g L− 1.
PEGs selected in this study were 1, 2, 4.6, 10, 20 and 35 kg mol− 1
(Fluka). PEOs used are 55 (Fluka), 100 and 200 kg mol− 1(Acros).
2.1.3. Analytical equipment
In the case of mixtures (PEGs or dextrans) permeate and feed samples were analyzed by gel permeation chromatography using a TSK G4000PW column coupled with a Waters refractive index detector. The analyses were carried out at 35 °C (oven for column for thermoregulation) using ultrapure water containing 0.1 g L− 1of
NaN3as eluent at a flow rate of 0.5 ml min− 1.
In the case of the filtration of single sized PEGs/PEOs, samples were analyzed by a total organic carbon analyzer (TOC-5050A, Shimadzu, Japan).
Blue dextran was analyzed by spectrophotometry at 480 nm.
2.1.4. Data treatment
From a comparison between solute concentrations in the retentate and the permeate, we calculated for each tracer molecule (or each fraction i) the partial rejection coefficient (also named observed retention) defined by the relationship:
Ri;obs= 1−CCi;p
i;r
!
× 100% ð1Þ
Ci,pconcentration of the tracer fraction i in the permeate (g L− 1)
Ci,rconcentration of the tracer fraction i in the retentate (g L− 1)
The molecular weight cut-off (classically noticed MWCO) of a membrane is deduced from the characteristic retention curve at 90% retention. According to the literature, it is necessary to minimize and even to cancel the effects of concentration polarization to be able to consider the retention curve as a characteristic of the membrane porous structure. Two methods are available. The first method involves successive filtrations at various permeation fluxes of the same solution[5,6]. Then for each fraction, the observed retention Robsis plotted vs. the flux and extrapolated to zero flux in order to
obtain membrane retention coefficient Rmusing film relationship:
ln 1−Robs Robs # $ = ln 1−Rm Rm # $ + J kBL # $ ð2Þ J flux density (m3m− 2s− 1);
kBLmass transfer coefficient in the boundary layer (m s− 1) ;
The second one requires the choice of a flux and a cross-flow velocity for each tracer used so that the calculated J/kBLvalues
cor-respond to a negligible concentration polarization[2]. In this latter case, only one experimental permeation flux has to be studied.
The two methods end up to a curve Rm= f (Molar Mass) which
provides, in most cases, a satisfactory characterization of ultrafiltra-tion membranes[7].
Moreover, it has been demonstrated[8]that the hydrodynamic radius is more appropriate than the molar mass for a standard characterization of membranes, since it should allow to predict the behavior of one class of solutes from the data collected with a different class. One can then also determine, rather than a cut-off expressed in molar mass, the hydrodynamic radius of the molecule retained at 90% by the membrane (size cut-off).
The hydrodynamic radius rhydis calculated according to the Eq. (3)
[8]:
rhyd= 3⋅μ⋅MM 4πξN # $13
ð3Þ
With µ the intrinsic viscosity of the solution (m3g− 1), MM the molar
mass (g mol− 1), µ∙MM the hydrodynamic volume (m3mol− 1), ξ the
constant proportionality between the radius of the equivalent sphere and the radius of gyration of the polymer molecule (taken as equal to 1) and N the Avogadro number (mol− 1).
Where for dextrans: μ = 2:43⋅10−7
MM0:42 ð4Þ and for PEGs/PEOs:
μ = 4:9⋅10−8MM0:672
ð5Þ
2.1.5. MS2 bacteriophage
Virus filtrations were also performed in this work to study the relationship between virus challenge tests and tracer retention exper-iments. For these series of experiments, the MS2 bacteriophage was chosen, as it is often used by membrane manufacturers to challenge membranes. The advantages of MS2 are numerous: it is one of the smallest viruses (then it should reveal smaller defects of pores), close in shape and size to the polio and hepatitis viruses (25 nm) and espe-cially non-pathogenic.
Virus stocks (Pasteur Institute (Paris)) at a concentration of 1011
PFU/mL were stored at −80 °C before use. The following protocol for challenge tests was based on previous studies[9]. Before virus' filtration, module integrity was checked. Virus suspension at 106PFU/
mL was prepared from virus stocks using 10− 4M phosphate buffer as
solvent. Challenge tests were conducted in triplicate with modules placed in parallel. Samples of retentate and permeate were collected
and analyzed in duplicate by the Plaque Forming Units method. The determination of MS2 concentration in the retentate CMS2,rand the
permeate CMS2,pallows the calculation of the Logarithmic Reduction
Value (LRV) defined by:
LRV = Log CMS2;r CMS2;p !
ð6Þ
2.2. Membranes and ultrafiltration set-up
Five hollow fibber ultrafiltration membranes have been tested. They are commercial membranes provided by the different partners of the project. Their main characteristics are reported inTable 1.
Tracer solutions have been filtered on a cross-flow filtration unit with hollow fiber modules. Each module tested (30 cm in length) contains a few fibers (active surface between 55 and 150 cm²). The hydrodynamic conditions correspond to laminar flow (Reynolds number: 1600–1800 for PEGs/PEOs and dextrans and 800 for blue dextran). The desired pressure, adjusted by means of a valve, was set between 0.2 and 1.5 bar. Permeate and retentate were recycled to maintain a constant volume (and concentration) in the tank. Once the flux had stabilized (after a filtration period of 20 min), filtrate and retentate samples were collected for subsequent analysis. The tank temperature was maintained at 20 °C.
The membrane water permeability was measured before and after each experiment. In accordance with AFNOR standard[4]the loss of permeability has to be < 30%.
As mentioned inSec. 2.1.4, the effect of polarization concentration has to be minimized. In this purpose, for dextrans in mixture and blue dextran it was chosen to use only one experimental permeation flux corresponding to a low polarization whereas for single sized PEGs/ PEOs successive filtrations of the same solution at various permeation fluxes were conducted.
3. Experimental results and discussion 3.1. Mixture of PEGs
Characterization experiments with mixtures of one type of polymers are easier because a single run is sufficient to obtain a full selectivity curve. The analysis method was first developed for PEG mixtures. 5 single sized PEGs and the same 5 PEGs in mixture have been analyzed by gel permeation chromatography. The chromato-grams obtained are reported inFig. 1. As it can be seen: (i) only 4 peaks are observed in the mixture while 5 solutes have been dissolved in the solution; (ii) elution times of PEGs seem to be shifted in the mixture by comparison to single sized PEGs peaks. Several operating conditions were tested (different PEGs concentrations and flow rates of the eluent) in order to try to solve the problem without any
improvement. As a consequence it is impossible to attribute one elution time to one molar mass in the mixture. Therefore, no exper-iment with PEGs in mixture was conducted.
In the case of dextrans, no shift was observed on the chromato-grams obtained with the mixture in comparison with the analysis conducted with single dextran samples (results not shown here).
3.2. Selectivity curves
Several selectivity curves of membranes performed with single sized PEGs/PEOs and mixtures of dextrans are reported inFigs. 2–7. These experiments were carried out by different operators with their own filtration set-up.
3.2.1. Effect of membrane fouling
Firstly, the importance of the protocol on retentions and selectivity curves for PEGs and PEOs filtrations was investigated.Fig. 2illustrates this effect on the retention of a single sized PEG 35 kg mol− 1by
mem-brane A. Experiments have been conducted on virgin memmem-branes (after measurement of water permeability, 4 different tests) and on membranes previously used for successive filtrations of single sized PEGs of smaller molar masses: 4.6, 10 and 20 kg mol− 1(3 different
tests). The results show that successive filtrations lead to an increase of PEG 35 kg mol− 1retention by comparison to the retention on
virgin membranes. This increase is explained by membrane fouling which can be sufficiently low to satisfy the criteria of a loss of per-meability ΔLPlower than 30% (AFNOR Standard) while modifying the
retention of the next PEG filtrated. As a consequence the single sized PEGs/PEOs filtration protocol has to be well defined; in particular, successive filtrations have to be done in ascending order of molar mass with the aim of reproducing fouling contribution during each test.
Table 1
Tested membranes.
Material Pore size (µm) / MWCO provided by the manufacturer (kDa)
Geometry and filtration mode Membrane A Cellulose acetate (AC) 0.01 µm/100 kDa Inside/out ;
pressurized Membrane B Polysulfone (PS) 0.02 µm/150 kDa Inside/out ; pressurized Membrane C Polysulfone (PS) 0.01 µm/100 kDa Outside/in ; pressurized Membrane D Polyethersulfone (PES) –/100 kDa Inside/out ; pressurized Membrane E Polyvinyl difluoride (PVDF) 0.02 µm/– Outside/in ; submerged
Fig. 1.Chromatograms of single sized PEGs and of PEGs in mixture.
3.2.2. Reproducibility and comparison between behavior during filtration of PEGs and PEOs
As previously mentioned, in order to obtain the selectivity curve of a tested membrane, tracers solution to be used should be prepared with molecules covering a broad molar mass range, corresponding to partial rejection coefficients ranging from 0 to 100%. For this reason, in some cases, the filtration of PEGs (maximum molar mass 35 kg mol− 1)
has to be completed by the use of PEOs.
Filtration of PEOs leads in most cases to an important loss of permeability (up to 56%). Moreover their behavior in filtration seems to be different from the one of PEGs as the retention of PEOs decreases with the increase in molar mass (hydrodynamic radius) as observed inFig. 3(PEOs 55 and 100 kg mol− 1). The major difference between
PEGs and PEOs other than their molecular structure is the polydis-persity of PEOs as shown inFig. 8. For these reasons the use of PEOs seems to be not adequate in order to obtain sieving curve and cut-off with a good accuracy. As a result of this and due to the fact that PEGs are commercially available up to the molar mass 35 kg mol− 1, we
consider that the use of single sized PEGs as tracers has to be rec-ommended for the characterization of membranes whose cut-off are lower than 35 kDa.
In order to evaluate the reproducibility of the measurements, the results of three tests conducted with single sized PEGs/PEOs filtrated in ascending order of molar mass were reported inFig. 3. For each test, a new module of membrane A samples was used. The difference in retention coefficient values obtained for one molecule can reach 30%. This difference can be attributed for a small part to the sensitivity of the retention measurement (around 5%) while we can assume that
the most important contribution in these differences comes from the variability in the characteristics of the membrane samples. Neverthe-less, the shape of the curves remains similar.
3.2.3. Comparison of selectivity curves obtained with dextrans in mixture and with single sized PEGs
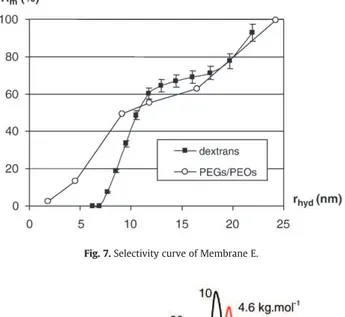
Figs. 4–7show that the shape of the curves obtained with the two kinds of tracers is similar for membranes B and E and quite different for membranes A and D. These differences could be due to (i) the operating conditions such as the operator and the filtration set-up for each type of molecule (ii) weak interactions with membrane material depending on the chemical structure of the molecule whereas for polysulfone (B) and PVDF (E) membranes no specific interaction was reported between Dextrans/PEGs and membrane material [8]. We also noticed in some cases the difficulty to obtain a well defined curve with PEGs due to few available points (specifically around the expected cut-off) leading to a hazardous interpolation. The use of a mixture of dextrans allows drawing a perfectly defined curve. Moreover the presence in the mixture of tracer molecules of high molar masses allows characterizing membranes with an expected cut-off until 150 kDa. However, according to previous studies[3]larger tracer molecules, which accumulate in the boundary layer, enhance the retention of smaller ones due to steric hindrance at the pore inlet. This seems not to be the case in our results as shown inFigs. 4–7
where dextrans of small molar mass are often less retained than PEGs of the same hydrodynamic radius.
Globally, the selectivity curve of membrane A is narrower by comparison to the ones of membranes B, C (not shown here) and D,
Fig. 3.Selectivity curve of Membrane A—Rmreproducibility for single sized PEGs and
PEOs of various molar mass.
Fig. 4.Selectivity curve of Membrane A.
Fig. 5.Selectivity curve of Membrane B.
which exhibit a wider pore size distribution. Concerning the mem-brane E, dextran mixture no. 2 had to be used (retention almost zero with mixture no. 1). The shape of the selectivity curve of this mem-brane is quite atypical and reproducibility tests exhibit an important dispersion in term of cut-off (seeTable 2). It can be concluded that the mean pore radius of membrane E is more important and that in this case the protocols used are not well adapted.
3.3. Synthesis of membranes characteristics
Membranes characteristics: permeability, molecular weight cut-off and size cut-cut-off (deduced from curves previously commented), blue dextran retention, loss in permeability during characterization tests and removal of MS2 are reported inTable 2.
The major result deduced from the tests using synthetic polymers is that a good correlation is obtained between cut-off determined by polyethylenes and dextrans if this cut-off is expressed in hydrody-namic radius (size cut-off). We can notice that the disadvantages previously mentioned about the use of PEOs (mainly the important
loss in permeability) do not seem to significantly affect the deduced cut-off.
It is difficult to classify membranes A, B, C and D in terms of cut-off which take into account all the results obtained. Similar removal efficiencies between membranes A, B, C and D were observed with the MS2 bacteriophage (deduced from 3 tests for each type of mem-brane). Only membrane E exhibits a weaker retention of MS2 that is in accordance with the previous comments.
Filtration of blue dextran exhibits weak difference between the tested membranes in term of membrane retention Rmwith a loss of
permeability lower than 30% except for membrane D (result that needs to be confirmed). Consequently, this test seems the least sen-sitive as it does not allow to distinguish membranes C, D and E. This result was expected since the molecular weight of the blue dextran is much higher than the molecular weight cut-off of the studied membranes.
Concerning the loss of permeability obtained with the other tracers, the dextrans mixture exhibits a loss lower than 30% (requested for the validation of the test according to the AFNOR standard). However these membranes can be divided into two groups: first A, B and D, characterized with mixture no. 1 and for which ΔLp ~ 10%, then the membrane E characterized with mixture no. 2 and for which ΔLp ~ 30% (near the maximum allowed by AFNOR standard). On the other hand, filtration of single sized PEGs//PEOs leads to a total loss of permeability equal or higher than 30% that is due to the filtration of PEOs as already mentioned.
4. Conclusion
Characterization tests using polyethylenes as tracers lead to the conclusion that the use of polyethylene oxides has to be avoided due to an important membrane fouling during filtration. As a conse-quence, the use of single sized PEGs is mainly considered for char-acterization of ultrafiltration membranes with an expected cut-off lower than 35 kDa. In any case, the protocol of filtration has to be precisely defined; in particular successive filtrations have to be con-ducted in ascending order of molar mass.
Despite drawbacks related to the analytical method of dextran such as time consuming and the lack of accuracy, the use of dextrans in mixture, leads to reproducible results. As dextrans are available in a large range of molar masses (or sizes), they allow the determination of cut-off all over the range of ultrafiltration membranes. Neverthe-less, the choice of the composition of the mixture has to be made with regard to membrane selectivity (case of membrane E).
As long as hydrodynamic radius is used, filtration experiments with single sized polyethylenes or mixture of dextrans provide the same cut-off. However, the lack of points on the selectivity curve could be a drawback for single sized PEG/PEO filtrations.
Moreover, this size cut-off is not significantly affected by the cho-sen method for minimizing polarization concentration. This method can be either a unique filtration at an experimental flux of permeation corresponding to a low polarization (used for dextrans in mixture and for blue dextran) or successive filtrations of the same solution at various permeation fluxes (used for single sized PEGs/PEOs).
Fig. 7.Selectivity curve of Membrane E.
Fig. 8.Chromatograms of single sized PEGs and PEOs.
Table 2
Characteristics of membranes A, B, C, D and E deduced from filtration of each type of tracer. Membrane Lp (L/h m² bar)
at 20 °C
Single sized PEGs/PEOs Dextrans mixture Blue dextran LRVMS2
MWCO (kDa) Size cut-off (nm) ΔLp % MWCO (kDa) Size cut-off (nm) ΔLp % Rm % ΔLp % A 200–300 75 14 28 60–80 8–10 8.6 – – 5–7 B 688–788 51 11 – 180–230 14–16 9.0 – – 5–7 C 130–255 92 16 – – – – > 99.3 20 5–7 D 420–514 41 10 – 140–180 12–14 9.6 97.8 ± 0.7 90 5–7 E 291–481 170 22 86 450–800 22–29 26.0 99.1 ± 0.2 25 3–5
Although no simple correlation was observed between the reten-tion of synthetic polymers and MS2 bacteriophage, the results pres-ented in this paper underline a good consistency between the trends observed.
References
[1] B. Schlichter, V. Mavrov, H. Chmiel, Comparative characterization of different commer-cial UF membranes for drinking water production, J. of Water Supply: Res. Technol.-AQUA (2000) 321–328.
[2] S. Platt, M. Mauramo, S. Butylina, M. Nyström, Retention of pegs in cross-flow ultra-filtration through membranes, Desalination 149 (2002) 417–422.
[3] C.M. Tam, A.Y. Tremblay, Membrane pore characterization—comparison between single and multicomponent solute probe techniques, J. Memb. Sci. 57 (1991) 271–287. [4] French Standard NF X 45-103, AFNOR Association Française de Normalisation (1997).
[5] P. Pradanos, J.I. Arribas, A. Hernandez, Mass transfer coefficient and retention of PEGs in low pressure cross-flow ultrafiltration through asymmetric membranes, J. Memb. Sci. 99 (1995) 1–20.
[6] R. Nobrega, H. de Balmann, P. Aimar, V. Sanchez, Transfer of dextran through ultrafiltration membranes: a study of retention data analyzed by gel permeation chromatography, J. Memb. Sci. 45 (1989) 17–36.
[7] C. Causserand, S. Rouaix, A. Akbari, P. Aimar, Improvement of a method for the characterization of ultrafiltration membranes by measurements of tracers retention, J. Memb. Sci. 238 (2004) 177–190.
[8] M. Meireles, A. Bessieres, I. Rogissart, P. Aimar, V. Sanchez, An appropriate molecular size parameter for porous membranes calibration, J. Memb. Sci. 103 (1995) 105–115. [9] J.-C. Schrotter, S. Rapenne, C. Machinal, C. Arnal, P. Jacob, K. Delabre, Toward a deeper understanding and characterization of membrane in water treatment, IWA Regional Conference, Membrane Technologies in Water and Waste Water Treatment, Moscow, Russia, 2–4 June, 2008.