Publisher’s version / Version de l'éditeur:
Plant Physiology, 176, 3, pp. 2376-2394, 2017-12-29
READ THESE TERMS AND CONDITIONS CAREFULLY BEFORE USING THIS WEBSITE. https://nrc-publications.canada.ca/eng/copyright
Vous avez des questions? Nous pouvons vous aider. Pour communiquer directement avec un auteur, consultez la première page de la revue dans laquelle son article a été publié afin de trouver ses coordonnées. Si vous n’arrivez pas à les repérer, communiquez avec nous à PublicationsArchive-ArchivesPublications@nrc-cnrc.gc.ca.
Questions? Contact the NRC Publications Archive team at
PublicationsArchive-ArchivesPublications@nrc-cnrc.gc.ca. If you wish to email the authors directly, please see the first page of the publication for their contact information.
Archives des publications du CNRC
This publication could be one of several versions: author’s original, accepted manuscript or the publisher’s version. / La version de cette publication peut être l’une des suivantes : la version prépublication de l’auteur, la version acceptée du manuscrit ou la version de l’éditeur.
For the publisher’s version, please access the DOI link below./ Pour consulter la version de l’éditeur, utilisez le lien DOI ci-dessous.
https://doi.org/10.1104/pp.17.01311
Access and use of this website and the material on it are subject to the Terms and Conditions set forth at
Transcriptomic insights into phenological development and cold
tolerance of wheat grown in the field
Li, Qiang; Byrns, Brook; Badawi, Mohamed A.; Diallo, Abdoulaye Banire;
Danyluk, Jean; Sarhan, Fathey; Laudencia-Chingcuanco, Debbie; Zou, Jitao;
Fowler, D. Brian
https://publications-cnrc.canada.ca/fra/droits
L’accès à ce site Web et l’utilisation de son contenu sont assujettis aux conditions présentées dans le site LISEZ CES CONDITIONS ATTENTIVEMENT AVANT D’UTILISER CE SITE WEB.
NRC Publications Record / Notice d'Archives des publications de CNRC:
https://nrc-publications.canada.ca/eng/view/object/?id=83b64aca-18e9-4982-8761-4ca6b6e98699 https://publications-cnrc.canada.ca/fra/voir/objet/?id=83b64aca-18e9-4982-8761-4ca6b6e98699Transcriptomic Insights into Phenological Development
and Cold Tolerance of Wheat Grown in the Field
1[OPEN]
Qiang Li,a,b Brook Byrns,a Mohamed A. Badawi,c,d Abdoulaye Banire Diallo ,c Jean Danyluk,c Fathey Sarhan,c Debbie Laudencia-Chingcuanco,e Jitao Zou,b and D. Brian Fowlera,2
aDepartment of Plant Sciences, University of Saskatchewan, Saskatoon, Saskatchewan S7N 5A8, Canada bNational Research Council Canada, Saskatoon, Saskatchewan S7N 0W9, Canada
cDépartement des Sciences Biologiques, Université du Québec à Montréal, Montreal, Quebec H3C 3P8, Canada dAgricultural Genetic Engineering Research Institute (AGERI), Agricultural Research Centre, Giza, Egypt 12619 eCrop Improvement and Genetics, U.S. Department of Agriculture-Agricultural Research Service, Albany,
California 94710
ORCID IDs: 0000-0002-9192-8255 (D.L.-C.); 0000-0002-2692-3116 (D.B.F.).
Cold acclimation and winter survival in cereal species is determined by complicated environmentally regulated gene expression. However, studies investigating these complex cold responses are mostly conducted in controlled environments that only consider the responses to single environmental variables. In this study, we have comprehensively profiled global transcriptional responses in crowns of field-grown spring and winter wheat (Triticum aestivum) genotypes and their near-isogenic lines with the VRN-A1 alleles swapped. This in-depth analysis revealed multiple signaling, interactive pathways that influence cold tolerance and phenological development to optimize plant growth and development in preparation for a wide range of over-winter stresses. Investigation of genetic differences at the VRN-A1 locus revealed that a vernalization requirement maintained a higher level of cold response pathways while VRN-A1 genetically promoted floral development. Our results also demonstrated the influence of genetic background on the expression of cold and flowering pathways. The link between delayed shoot apex development and the induction of cold tolerance was reflected by the gradual up-regulation of abscisic acid-dependent and C-REPEAT-BINDING FACTOR pathways. This was accompanied by the down-regulation of key genes involved in meristem development as the autumn progressed. The chromosome location of differentially expressed genes between the winter and spring wheat genetic backgrounds showed a striking pattern of biased gene expression on chromosomes 6A and 6D, indicating a transcriptional regulation at the genome level. This finding adds to the complexity of the genetic cascades and gene interactions that determine the evolutionary patterns of both phenological development and cold tolerance traits in wheat.
Allohexaploid bread wheat (Triticum aestivum; 2n = 6x = 42, AABBDD) is the most widely cultivated food crop and represents the majority (;95%) of wheat pro-duction in the world. Wheat is grown mainly in temperate
climates, where it is subjected to a wide range of seasonal environments and stresses. It is normally planted in the spring (spring habit) or in the autumn (winter habit). Consequently, factors determining the rate of phenologi-cal development and maximum cold tolerance are of critical importance in determining the successful adapta-tion to such a wide range of environments (Fowler and Limin, 2004). Although the way in which plants perceive and respond to temperature cues is not well understood, wheat winter survival involves two important evolu-tionarily adaptive mechanisms: cold acclimation and vegetative/reproductive transition (VRT; Fowler et al., 2001; Sung and Amasino, 2005; Dhillon et al., 2010).
Cold acclimation enables plants to acquire freezing tolerance in response to a period of exposure to low temperatures prior to the onset of 20°C (Thomashow, 1999; Sung and Amasino, 2005). Freezing-tolerant wheat plants that have not been cold acclimated are generally killed at temperatures of 25°C, but they may survive as low as 222°C or colder when fully accli-mated (Limin and Fowler, 2002; Fowler and Limin, 2004). The molecular basis of cold acclimation and ac-quired freezing tolerance in plants has been studied extensively in Arabidopsis (Arabidopsis thaliana) and cereals such as wheat and barley (Hordeum vulgare;
1
This work was supported by funding from Genome Canada/ Genome Prairie (D.B.F.), Ducks Unlimited Canada (D.B.F.), the Sas-katchewan Ministry of Agriculture and the Canada-SasSas-katchewan Growing Forward 2 bilateral agreement (D.B.F. and J.Z.), a Natural Sciences and Engineering Research Council of Canada discovery grant (F.S.), and the National Research Council Canada-Wheat Im-provement Program (J.Z.). This is publication NRCC #56351.
2Address correspondence to brian.fowler@usask.ca.
The author responsible for distribution of materials integral to the findings presented in this article in accordance with the policy described in the Instructions for Authors (www.plantphysiol. org) is: D. Brian Fowler (brian.fowler@usask.ca).
D.B.F., J.Z., and D.L.-C. conceived the study; D.B.F. and J.Z. coor-dinated the research and provided materials; D.B.F. carried out the phenotypic analysis and tissue collection; Q.L. isolated the RNA; Q.L. and B.B. analyzed the data; B.B., D.L.-C., A.B.D., J.D., and M.A.B assisted in data interpretation; Q.L., D.B.F., F.S., and J.Z. drafted the article; all authors contributed to the interpretation of results and read, edited, and approved the article.
[OPEN]
Articles can be viewed without a subscription. www.plantphysiol.org/cgi/doi/10.1104/pp.17.01311
Thomashow, 1999, 2010; Kim et al., 2009; Vashegyi et al., 2013). Despite the evolutionary diversity, part of the cold acclimation pathways is conserved among the different plant species. A molecular model of cold sig-naling, linking cold sensing and transcriptional regu-lation, has been put forward (Kim et al., 2009; Shi et al., 2015). The cold signal is transduced downstream, and many pathways are activated in concert with the pre-cise regulation of expression of cold-responsive genes (Thomashow, 2010). It has been a major challenge to separate the critical genes for freezing tolerance from those that merely respond to cold. Transcriptome analysis revealed that up to 20% of genes in the Ara-bidopsis genome are regulated by cold (Ishitani et al., 1998; Lee et al., 2005; Zhao et al., 2015). In wheat, thousands of genes were affected during cold treatment in controlled environments (Winfield et al., 2010; Laudencia-Chingcuanco et al., 2011). Many lines of evidence indicate that parallel or branched signaling pathways activate distinct suites of the cold acclimation response (Gilmour et al., 2004; Lee et al., 2005; Pitzschke and Hirt, 2006). The only well-characterized cold acclimation pathway is the INDUCER OF CBF EXPRESSION (ICE)-C-REPEAT-BINDING FACTORS (CBF)-COLD REGULATED (COR) transcriptional cas-cade (Stockinger et al., 1997; Jaglo-Ottosen et al., 1998; Liu et al., 1998; Kim et al., 2009; Shi et al., 2015). The ICE-CBF-COR pathway has been suggested to be functionally conserved in different plant species (Kim et al., 2009; Shi et al., 2015). In this pathway, cold-activated ICE genes rapidly up-regulate the ex-pression of CBF genes that subsequently initiate the transcription of COR genes, known as the CBF regulon, that confer freezing tolerance (Fowler and Thomashow, 2002; Chinnusamy et al., 2003; Badawi et al., 2007; Kim et al., 2009; Shi et al., 2015). Although the CBF-dependent pathway plays a crucial role in cold acclimation and freezing tolerance, only ;12% of cold-responsive genes are controlled by CBFs, as revealed by transcriptome analysis (Lee et al., 2005; Zhao et al., 2016). The endogenous phytohormone abscisic acid (ABA) levels have been shown to increase in Arabi-dopsis and wheat during low-temperature exposure (Zhu et al., 2004). Cold-responsive genes containing the C-repeat/dehydration-responsive motif and ABA re-sponse cis-elements, such as RD29A, RD22, COR15A, COR47, and WCOR410, also are responsive to ABA (Danyluk et al., 1998; Shi et al., 2015). Clearly, cold ac-climation pathways are highly interactive and modu-lated by multiple signaling pathways.
In spite of extensive transcriptional and metabolic regulation of responses to cold, freezing temperatures are normally fatal to the cold-sensitive floral meristems. Vernalization is the process that allows winter habit
Figure 1. Physiological and phenological traits of NO and MA and the NILs, SN and WM, grown under field conditions. A and B, Soil and air temperatures during autumn cold acclimation and LT50values at five sampling time points (T1, T2, T3, T4, and T5) in 2010 (A) and 2013 (B).
LT50, Temperature at which 50% of the plants are killed. C, Represen-tative images of shoot apex development of crowns at five time points (T1, T2, T3, T4, and T5) in MA, NO, WM, and SN.
plants to synchronize flowering with favorable spring conditions after exposure to an extended time starting at low, nonfreezing temperatures in the autumn, while spring habit (VRN) plants do not have this require-ment (Dhillon et al., 2010; Greenup et al., 2011). VERNALIZATION1 (VRN1), or VRT1, is homologous to the meristem development genes APETALA1 (AP1), CAULIFLOWER, and FUL in Arabidopsis (Danyluk et al., 2003; Yan et al., 2003). There are three VRN1 loci in wheat: VRN-A1, VRN-B1, and VRN-D1, on the A, B, and D genomes, respectively. VRN-A1 has the largest effect in reducing the vernalization requirement com-pared with the other VRN loci (Yan et al., 2003). A recent study suggests that VRN1 in barley binds to the promoter of its target genes to activate or repress their transcription in barley seedlings (Deng et al., 2015). Potential targets of VRN1 include genes in-volved in hormone synthesis, reproductive develop-ment, and cold acclimation (Deng et al., 2015). Transcript analysis also has shown that VRN1 di-rectly regulates CBF genes and represses their ex-pression, suggesting a negative feedback loop between cold acclimation and VRT (Seo et al., 2009; Alonso-Peral et al., 2011). We have shown previously that spring Norstar (SN), which is generated from a winter genotype Norstar (NO) but harboring the VRN-A1 gene, is almost as cold tolerant as NO under short days that delay plant development (Limin and Fowler, 2002). These observations demonstrate that delaying the VRT confers greater cold tolerance in wheat. However, the molecular mechanisms con-trolling the VRT during cold acclimation, and par-ticularly how it interacts with cold responses, are largely unknown (Kazan and Lyons, 2016).
To date, cold acclimation studies in wheat have been conducted primarily under controlled environ-ments that focus on single factors and, thus, do not represent the complexity of nature, where plants are exposed to multiple environmental factors (Campoli et al., 2009; Sutton et al., 2009; Winfield et al., 2010; Greenup et al., 2011; Laudencia-Chingcuanco et al., 2011). Consequently, changes observed under con-trolled environments are not a true reflection of those that occur when plants experience a variable but gradual decline in temperature, light, photoperiod, etc., under field conditions (Winfield et al., 2010). Unfortunately, much less effort has been devoted to elucidating the underlying molecular mechanisms to gradual temperature decline during the autumn-winter progression in natural conditions. In this study, we grew four wheat genotypes: winter habit NO, spring habit Manitou (MA), and their near-isogenic lines (NILs) winter Manitou (WM) and SN, with the VRN-A1 alleles swapped, under field con-ditions to better understand the transcriptional changes and assist in unraveling the allelic effects of VRN-A1 and vrn-A1 on shoot apex development and cold tolerance in autumn environments found in na-ture.
RESULTS AND DISCUSSION
Phenological Development and Cold Tolerance
The pattern of change in soil temperatures was no-tably different in the two years of this study (Fig. 1). On September 1, the soil temperature was 16.7°C in 2010 compared with 19.7°C in 2013. Soil temperatures remained warmer in 2013 until September 25, after which they were consistently warmer in 2010. As a re-sult, the average soil temperature for the sampling pe-riods was only 0.3°C warmer in 2013 compared with 2010. The importance of these differences was clearly demonstrated where the increase in soil temperature after the September 22 sampling date stalled cold ac-climation until after October 4 in 2010 and resulted in greater cold tolerance (LT50) for all genotypes except MA in 2013.
Plants reached the three-leaf stage by the first sam-pling date and had developed five to six leaves by the end of the sampling period in both trial years. Shoot apical meristem development reached the double ridge stage for MA by October 18 in 2010 (Fig. 1C). This was the only genotype to advance to this stage before soil temperatures fell below freezing in both years. Both MA and SN are spring habit (VRN-A1), but SN normally produces two more leaves on the main stem than MA before the VRT (Limin and Fowler, 2002). This increase in minimum final leaf number significantly delayed the time required to VRT and was correlated with an extended period where the cold tolerance genes were up-regulated in SN com-pared with MA.
There were significant differences (ANOVA, P , 0.001) in the LT50levels and acclimation patterns of the geno-types considered in this study (Fig. 1). The superior cold tolerance genetic potential and the effect of the delayed VRT due to the vernalization requirement of NO quickly became evident (Fig. 1C). The superiority of the NO ge-netic background also gave SN a cold tolerance advan-tage over WM in the early sadvan-tages of acclimation. However, most of this advantage was lost gradually to the delayed VRT due to the vernalization requirement of WM, and these two genotypes ended up with similar LT50values by the end of the sampling periods.
mRNA Transcriptome Profiling and Data Analysis
The majority of studies on transcriptional changes during cold acclimation in wheat have been conducted under controlled environments where cold responses are unlikely to behave the same way as in nature (Campoli et al., 2009; Greenup et al., 2011; Laudencia-Chingcuanco et al., 2011; Tchagang et al., 2017). Previ-ous microarray studies using this set of unique genetic materials were limited to examining relative differences of gene expression under cold treatments in a con-trolled environment (Laudencia-Chingcuanco et al., 2011; Tchagang et al., 2017). Furthermore, the influ-ences of spring and winter genetic backgrounds on cold
tolerance or floral transition have not been fully explored (Greenup et al., 2011; Laudencia-Chingcuanco et al., 2011; Tchagang et al., 2017). To obtain a complete picture of the global changes of the transcriptome during cold acclimation, we designed field experiments to system-atically identify differentially expressed genes (DEGs) that low temperature activated in wheat NILs with dif-ferent VRN-A1 alleles and genetic backgrounds.
The global transcriptome in crowns, the plant part that is necessary for winter survival, was determined in MA, NO, SN, and WM as cold acclimation and vernalization progressed under field conditions from early autumn to winter in 2010 and 2013 (Fig. 1). We employed RNA sequencing (RNA-seq) to interro-gate the expression patterns of 151,960 transcripts (Supplemental Data S1), which represents more than triple the number of Affymetrix Wheat Genome Gen-eChip array probes in an earlier study (Laudencia-Chingcuanco et al., 2011). The 100-bp paired-end RNA-seq yielded over 2.5 billion reads (442 Gb) from 80 libraries of the four lines at five time points in each year (Supplemental Fig. S1; Supplemental Table S1). We took a system approach to identify the genetic dif-ferences between winter and spring wheat and their cold responses simultaneously to gain a systematic view of transcriptional reprogramming during the progression of autumn cold acclimation under field conditions. This approach eliminates batch effects and removes unknown noise in RNA-seq data. To achieve that, we applied surrogate variable analysis to detect potential latent factors and correct for systematic vari-ation in the RNA-seq data (Li et al., 2014). The latent factors were then incorporated into a DESeq2 design in order to specifically identify DEGs affected by temperature, genotype, genotype-time interaction, and genotype-temperature interaction in any sample through a likelihood ratio test (Supplemental Fig. S2A). In total, 15,176 DEGs (false discovery rate [FDR] , 0.05) were identified from different time points in all samples during both 2010 and 2013 (Supplemental Fig. S2B), while microarray studies identified no more than 3,000 DEGs (Laudencia-Chingcuanco et al., 2011; Tchagang et al., 2017).
Cluster Analysis of DEGs during Cold Acclimation
Since the 15,176 DEGs identified in this study repre-sented multiple effects from genotype and environmen-tal differences plus cold responses, we applied weighted gene coexpression network analysis (WGCNA) to sep-arate similarities and differences underlying the au-tumn field responses in the NILs. WGCNA allowed the identification of modules of coexpressed genes constructed from the expression profiles of all sam-ples simultaneously by using a dynamic hierarchical clustering approach (Supplemental Fig. S3). This step operates on all data simultaneously and does not re-quire any a priori information about the biological source of sequenced libraries. Twenty-five clusters
were identified, and the module eigengenes (MES), which represent the first principal component of each cluster, were calculated (Supplemental Fig. S4). Pearson correlation coefficient values of MES were calculated between 2010 and 2013 to evaluate data consistency between the two years (Supplemental Table S2). We identified 12 clusters containing 10,728 genes with sig-nificant positive correlations between 2010 and 2013 (r . 0 and FDR , 0.05), while the other 13 clusters (containing 4,448 genes) were considered as environ-mental noise and excluded in the following analysis (Supplemental Data S2; Supplemental Table S2).
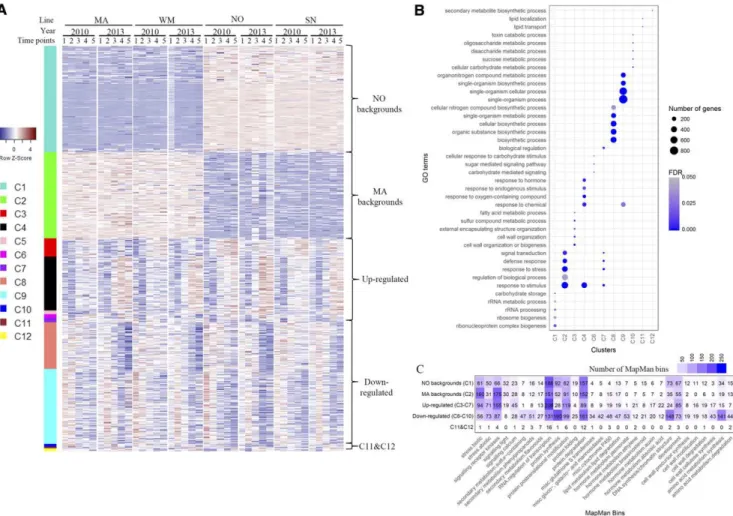
To investigate transcriptional regulation and sepa-rate cause-and-effect adjustments of the NILs to au-tumn environmental cues, we further categorized the coexpression gene clusters through principal compo-nent analysis (PCA) and tree diagrams. Tree diagrams were generated from principal component scores using Malhalanobis distances with P values for the null hy-pothesis reported at each branch (Supplemental Fig. S5; Supplemental Table S2). Generally, the 12 clusters could be classified into four categories (Fig. 2; Supplemental Table S2): genetic background effects (C1, NO backgrounds; and C2, MA backgrounds), up-regulated (C3–C7), down-regulated (C8–C10), and VRN-A1 effects (C11 and C12). NO backgrounds con-tain genes highly expressed in NO and SN, while genes in MA backgrounds were more highly expressed in MA and WM. Generally, clusters C3 to C7 was up-regulated while clusters C8 to C10 was down-regulated as au-tumn progressed to winter. Cluster C11 contained 50 genes that were more highly expressed in NO and WM with vrn-A1 than MA and SN, which harbor VRN-A1. In contrast, cluster C12 (containing 71 genes) showed relatively higher gene expression in VRN-A1 lines.
Gene Ontology (GO) enrichment revealed that vari-ous biological processes were affected during cold acclimation (Fig. 2B). Genes in NO backgrounds (cluster C1) were enriched in carbohydrate storage, ri-bonucleoprotein complex biogenesis, rRNA processing, and ribosome biogenesis. On the other hand, genes in MA backgrounds (cluster C2) were highly enriched in response to stimulus, response to stress, defense re-sponses, and signal transduction. The accumulation and deposition of soluble carbohydrates has been pro-posed to contribute to cold tolerance (Trischuk et al., 2014). In support of this observation, our results showed that genes involved in carbohydrate storage and RNA-protein complex biogenesis in NO and SN promoted cold tolerance. Up-regulated genes (clusters C3–C7) were highly enriched in cell wall organization or biogenesis, lipid metabolism, response to stimulus and hormones, and response to oxygen-containing compound. Thus, cold stress induced cell wall biogenesis (Griffith and Yaish, 2004), membrane lipid remolding (Li et al., 2015), and various signaling pathways from temperature, hormones, and oxygen-containing molecules (Kim et al., 2009). Down-regulated genes (clusters C8–C10) were enriched
mainly in biosynthetic processes, carbohydrate meta-bolic process, ribosome assembly, and DNA packaging, suggesting a general suppression of DNA and protein synthesis as well as metabolic processes by cold. Genes in cluster C11 were enriched in lipid transport and lipid localization, while genes in cluster C12 were enriched mainly in secondary metabolite biosynthetic process. Cold stress often modulates lipid compositions in cel-lular membranes (Li et al., 2015) and increases the ac-cumulation of secondary metabolites (Griffith and Yaish, 2004). Our results suggested that both processes also could be affected by VRN-A1.
Transcriptional Reprogramming in Biological Pathways
Many lines of evidence indicate that parallel or branched signaling pathways activate or deactivate distinct suites of cold acclimation responses (Gilmour et al., 2004; Lee et al., 2005; Pitzschke and Hirt, 2006). DEGs were further categorized into different biological pathways to integrate the biological processes that were inherently activated in NO and MA genetic back-grounds and triggered by cold (Fig. 2C; Supplemental Fig. S6; Supplemental Data S3). While most biological processes were affected, the numbers of genes in each pathway varied according to the types of gene
Figure 2. Heat map display of DEGs separates genetic effects and cold responses by clustering analysis. A, Heat map visuali-zation of DEGs in each cluster. Clustering was performed with regularized log2-transformed (rlog) counts using the dynam-icTreeCut program (Langfelder and Horvath, 2008). A total of 12 clusters were identified from four wheat lines (MA, WM, NO, and SN) at five time points in both 2010 and 2013. Twelve clusters were further categorized into NO backgrounds (C1) and MA backgrounds (C2), up-regulated (C3–C7), down-regulated (C8–C10), and C11 and C12 using PCA and tree diagrams. Genes in each cluster are colored on the left of the heat map. Expression is scaled across genes (z score). Each column represents a sample; sample names indicate the corresponding wheat line (MA, WM, NO, and SN), the year of samples (2010 and 2013), and sampling time points (1, 2, 3, 4, and 5). B, GO enrichment analysis. The y axis represents GO terms in biological processes, and the x axis stands for each cluster (no significant GO terms in cluster C5). The top five GO terms are shown. The number of genes equals the number of DEGs in each GO term. Fisher’s exact test was performed to indicate the significance of GO enrichment (FDR , 0.05). C, Pathway analysis of DEGs. Transcript sequences of DEGs were categorized into different pathways through the Mercator pipeline for automated sequence annotation (http://www.plabipd.de/portal/mercator-sequence-annotation; Lohse et al., 2014). The numbers of genes in MapMan bins in different types of expression patterns are shown.
expression (Fig. 2C). For background effects, more DEGs involved in RNA regulation of transcription and DNA synthesis/chromatin structure were highly expressed in NO and SN (C1). In contrast, more stress-and signaling-related genes were expressed at higher levels in MA and WM (C2). For cold responses, genes in signaling receptor kinases and RNA regulation of transcription were up-regulated (C3–C7), while protein synthesis, protein degradation, and amino acid me-tabolism were down-regulated (C8–C10). These results suggested that multiple mechanisms, including stress responses, signaling, transcriptional regulation, and posttranscriptional regulation, are involved in cold re-sponses. More importantly, the stress and signaling responses were constitutively expressed at higher levels in MA and WM when compared with NO and SN. This suggests that the genetic background of MA is more sensitive to cold stress relative to that of NO.
The NILs not only have different ability to tolerate cold, as demonstrated by LT50values (Fig. 1), but dis-played different phenological development stages (Fig. 1C). Both cold tolerance and phenological devel-opment involve multiple biological pathways. There-fore, we specifically investigated DEGs in flower development and cold-responsive pathways. Cold re-sponses included Ca2+signaling and kinase cascades, CBFs, CORs, and ABA-dependent pathways. Floral development pathways included floral meristem iden-tity, vernalization, hormones, sugar, ambient temper-ature, light quality, and circadian, general, and autonomous pathways. In previous microarray studies, only three VRNs and a few CBF and COR genes were identified based on selected microarray probe sets (Supplemental Data S4; Laudencia-Chingcuanco et al., 2011; Tchagang et al., 2017). These genes gave only a partial picture, supported only by the known and se-lected genes and possibly missing many crucial undis-covered genes. With the complete transcriptome RNA-seq in this study, we identified a total of 355 genes in flowering and cold signaling path-ways (Table I; Supplemental Data S4).
DEGs in Cold-Responsive Pathways
Current evidence shows that multiple pathways are involved in activating cold responses in plants, in-cluding Ca2+signaling, ICE1-CBF-COR pathway, ABA-dependent pathway, and hormones and lipids, etc. (Thomashow, 1999; Kim et al., 2009; Vashegyi et al., 2013). Using this knowledge as a guide, we investigated
gene expression in wheat cold response pathways (Fig. 3; Supplemental Data S4). In the wheat lines con-sidered in this study, 160 DEGs were involved in cold-responsive pathways, of which 21 were highly expressed in NO backgrounds and 14 were highly expressed in MA backgrounds. In the calcium signal-ing and kinase cascade pathways (Sheen, 1996), 12 genes were highly expressed in NO genetic back-grounds, while MA backgrounds included 11 genes (Supplemental Fig. S7). The CBF pathway is the major ABA-independent pathway that is involved in cold acclimation (Fig. 3). Indeed, nine genes encoding CBF3, COLD REGULATED314 THYLAKOID MEMBRANE 2 (COR314-TM2), COLD-REGULATED413 PLASMA MEMBRANE PROTEIN1, COLD SHOCK120 (CS120), three CS66s, the cold acclimation protein WCOR410b, and LOW EXPRESSION OF OSMOTICALLY RE-SPONSIVE GENES2 (LOS2) were highly expressed in NO and SN, while two CS66 genes and one LOS2 gene were highly expressed in MA and WM. Studies have shown that the HvCBF2 in barley (Campoli et al., 2009) and TaCBF14, TaCBF15, and TaCBF16 in wheat (Vágújfalvi et al., 2005) are expressed at higher levels in the winter genotype than in the spring genotype. In this study, NO and SN maintained the CBF pathways at a higher level than MA and WM at all test time points, indicating superiority of the NO genetic background for cold tolerance.
It has been proposed that cold-activated ICE1 genes rapidly up-regulate the expression of CBF genes that subsequently initiate the transcription of various COR genes (Danyluk et al., 1998; Fowler and Thomashow, 2002; Lee et al., 2005; Fursova et al., 2009; Kim et al., 2009; Shi et al., 2015). We identified 80 genes that were up-regulated and 41 down-regulated genes in cold-responsive pathways (Fig. 3A; Supplemental Data S4). Up-regulated genes contain 23 genes while down-regulated genes include 31 genes in the calcium sig-naling pathway. In the CBF pathway, 47 genes were up-regulated while only six were down-regulated. The 47 up-regulated genes encode ICE1 and 46 CORs and dehydrins (DHNs; Supplemental Data S4), such as CS120, COR314-TM2, WCOR18, LATE
EMBRYO-GENESIS ABUNDANT, COR413-TM2,
COLD-REGULATED PROTEIN BLT14, COLD-COLD-REGULATED PROTEIN2 (CR2), WCS19, Wrab17, COR27, WCOR413, DHN-like, WZY1-1, and WDHN13. Fifteen of them have been identified previously as cold-induced genes (Laudencia-Chingcuanco et al., 2011; Tchagang et al., 2017). Six genes encoding ICE1, CBF3, COR413-PM2, DREB1B, and two DEHYDRATION-INDUCED19
Table I. DEGs in cold pathways and flower pathways
Pathway NO Backgrounds (C1) MA Backgrounds (C2) Up-Regulated (C3–C7) Down-Regulated (C8–C10) C11 and C12 Total
Calcium signaling 12 11 23 31 2 79
ICE1-CBF-COR pathway 9 3 47 6 2 67
ABA-dependent pathway 0 0 10 4 0 14
proteins were down-regulated. We noted that 47 CORs/DHNs, but only one ICE1 gene, were up-regulated. This is different from the previous microarray studies, where 16 CBFs and three ICE1-encoding genes (Tchagang et al., 2017) were iden-tified as cold-regulated genes. This discrepancy could be caused by different sampling intervals and
environmental differences. It should be noted that samples from previous microarray studies were col-lected as early as after 48 h of cold treatment (Laudencia-Chingcuanco et al., 2011), while samples in this study were harvested at 7-d intervals. Previous studies also reported that ICE1 and CBFs are induced rapidly by cold and that the expression of CBFs
Figure 3. Expression profiles of DEGs in cold-responsive pathways. A, Expression of genes in the ICE1-CBF-COR pathway. B, Expression of genes in the ABA-dependent pathway. Heat maps show the expression of genes in cold-responsive pathways. Expression is scaled across genes (z score). Genes in different types of expression patterns are colored on the left of the heat map. Li et al.
displayed a diurnal pattern (Achard et al., 2008; Campoli et al., 2009). Due to the constantly changing environment in the field, it is also possible that the ex-pression peaks of CBFs are not detected. Nonetheless, our results emphasized the important role of CORs/ DHNs in cold tolerance during autumn cold acclima-tion in all NILs.
It is known that ABA accumulates when plants are exposed to low temperature, which is perceived sub-sequently by ABA receptors such as PYRABACTIN RESISTANCE1-LIKE (PYL) proteins (Gonzalez-Guzman et al., 2012; Valdés et al., 2012). PYL proteins inhibit protein phosphatase type 2C to relieve the SUCROSE NONFERMENTING1-RELATED PRO-TEIN KINASE2 (SNRK2) activity, which, in turn, phosphorylates ICE1 to activate the transcription of CBFs and CORs (Gonzalez-Guzman et al., 2012; Ding et al., 2015). Ten genes in the ABA-dependent pathway were up-regulated while four genes were down-regulated in the four genotypes evaluated (Fig. 3B). The up-regulated genes include those encoding HOMEOBOX7 (HB7), CYP707A4, SNRK2, HIGHLY A B A - I N D U C E D P R O T E I N P H O S P H A T A S E TYPE 2C GENE3, NINE-CIS-EPOXYCAROTENOID DIOXYGENASE9 (NCED9), and ABSCISIC ACID RESPONSIVE ELEMENTS-BINDING FACTOR3. Down-regulated genes encode three PYL5 homo-logs and one SNRK2-5. NCED9 is a key enzyme in the biosynthesis of ABA. Up-regulation of NCED9 sug-gested a higher ABA level in wheat during cold accli-mation, which, in turn, activates the transcription of CBFs or CORs through the ABA-dependent signaling pathway under cold acclimation. HB7 represses the transcription of PYL5 in response to ABA (Valdés et al., 2012), which may explain the down-regulation of PYL5 genes.
DEGs in Phenological Development Pathways
Unlike previous microarray studies that focused only on the expression of VRN-A1 on shoot development (Laudencia-Chingcuanco et al., 2011; Tchagang et al., 2017), we identified a total of 196 DEGs related to floral development under the autumn field conditions of this study (Fig. 4; Supplemental Fig. S8; Supplemental Data S4). Genes related to flower development and meristem identity, flowering time integration, temperature, ver-nalization, and hormone pathway responses during phenological development and cold acclimation were considered in depth (Fig. 4). Of these genes, 42 were highly expressed in NO and SN (NO backgrounds) while 33 were highly expressed in MA and WM (MA backgrounds), indicating that they were regulated by NO or MA genetic backgrounds. Nine genes in the flower development and meristem identity pathway were highly expressed in MA and WM, including AUXIN RESPONSE FACTOR3 (ARF3), ENHANCER OF AG-4 1 (HUA1), CYTOKININ-HYPERSENSITIVE2 (CKH2), SUPPRESSOR OF OVEREXPRESSION OF CO1 (SOC1), SHORT VEGETATIVE PHASE (SVP), and
HISTONE DEACETYLASE1 (HDA1). Three AP1 genes were expressed at higher levels in VRN-A1 lines (MA and SN) compared with vrn-A1 lines (NO and WM), suggesting a role of VRN-A1 in regulating AP1 ex-pression. On the other hand, seven genes were highly expressed in NO and SN, including AP2, three SVPs, two SOC1s, and HUA ENHANCER4 (HEN4). These genes are important flowering time integrators con-trolling the VRT. More importantly, AP1, ARF3, CKH2, and HDA1 are genes that promote flowering, while AP2, HEN4, and SVPs negatively regulate floral de-velopment (Lee et al., 2007; Marín-González et al., 2015; Bouché et al., 2016). These results suggested that the MA genetic background (MA and WM) generally pro-motes flowering while the NO genetic background delays shoot apex development through repression of the meristem development pathway. Our previous studies have shown that SN is almost as cold tolerant as NO under short days, with a delayed plant develop-ment, but is less cold tolerant than NO under long days (Limin and Fowler, 2002). Thus, the superiority of cold tolerance in NO could be contributed, at least partly, by the genetic background though delaying shoot apex development.
Previous studies have shown that the SHORT VEG-ETATIVE PHASE-like MADS box genes, BARLEY MADS1 (BM1) and BM10, and VRT2, which inhibits floral meristem identity, are up-regulated by cold in barley (Trevaskis et al., 2007) and wheat (Kane et al., 2005). Three MADS box transcription factors and one FLOWER PROMOTING FACTOR (FPF) were found to be involved in the floral transition in wheat (Laudencia-Chingcuanco et al., 2011; Tchagang et al., 2017). We identified 67 up-regulated and 53 down-regulated genes in flower pathways that showed temperature-dependent regulation (Fig. 4; Supplemental Fig. S8; Supplemental Data S4). Nine genes, including HUA1, AP1, AP2, AGL8, and SVP from the meristem identity pathway and VRN-A1, VRN-B1, and VRN-D1 from the vernalization pathway, were up-regulated. Two negative regulators, EARLY FLOWERING MYB FLOWERING (EFM) and TEMPRANILLO2 (TEM2; Marín-González et al., 2015) from the ambient temper-ature pathway, also were induced (Fig. 4; Supplemental Data S4). Down-regulated genes included two EFMs, FCA, and two FLOWERING LOCUS D (FD) and TEM2 genes from the ambient temperature and photoperiod-ism pathways (Fig. 4B). Notably, both FD and FCA are major genes that promote the floral transition (Jeon and Kim, 2011; Zheng et al., 2017). In addition, AG-AMOUS-LIKE24 (AGL24) and AGL19, genes control-ling the floral transition in response to vernalization, also were down-regulated (Jeon and Kim, 2011). A decrease of cold tolerance has been associated with the accumulation of wheat AP1 family proteins (Danyluk et al., 2003) and VRN1 (Dhillon et al., 2010). In addi-tion to VRNs and AP1s, our results provide new in-sight into the mechanisms that delay shoot apex development by repressing major meristem develop-ment genes (e.g. FCA, AGL24, and AGL19) and the
induction of negative regulators (e.g. EFM, TEMs, and LATE FLOWERING PROTEIN [LATE]). Indeed, as noted earlier, SN is almost as cold tolerant as NO under short days that delay plant development (Limin and Fowler, 2002).
GA is an important phytohormone that regulates key processes in plant growth and development, such as seed germination, growth through elongation, and the floral transition (Lee et al., 2005). GA metabolism
Figure 4. Expression profiles of DEGs in flower development pathways. A, Expression of genes in flower development and flower time integrator pathways. B, Expression of genes in ambient temperature and vernalization pathways. C, Expression of genes in the hormone pathway. Heat maps show the expression of genes in flower development pathways. Expression is scaled across genes (z score). Genes with different types of expression patterns are colored on the left of the heat map.
involves successive metabolic steps catalyzed by GA REQUIRING1 (GA1), GA2, GA3, GIBBERELLIN 20-OXIDASE (GA20ox), and GA3ox to produce bioac-tive GAs, while GA2ox deactivates bioacbioac-tive GAs (Hsieh et al., 2002). GAs bind to receptors to initiate the GA signaling pathway. The GA receptors subsequently bind with DELLA proteins (GA INSENSITIVE [GAI], REPRESSOR OF GAI-3 [RGA], and RGA-LIKEs [RGLs]) to form a complex, which can be recognized by the SLEEPY (SLY1)-based SCF-type E3 ligase that deactivates DELLAs in the presence of GA (Bouché et al., 2016). We identified 13 genes encoding GA3ox1, GA20ox1, GAST1 PROTEIN HOMOLOG4, ARF2, RE-SPONSIVE TO DESSICATION20, GAI, and RGL2 that were all up-regulated (Supplemental Data S4). Down-regulated genes from the hormone pathway include GA2ox1, GA2, ARGININE DECARBOXYLASE2, FPF1, and SLY1. The down-regulation of GA2, which cata-lyzes the second step in GA synthesis (Hsieh et al., 2002), indicated a reduced level of GA during cold ac-climation. An opposite expression pattern was ob-served in Arabidopsis seedlings, where cold treatments up-regulate GA2ox transcript levels and down-regulate GA20ox transcript levels (Lee et al., 2005). The dis-crepancy could be due to these studies being conducted in Arabidopsis leaves or seedlings, while our study was conducted in crowns. It is noteworthy that DELLA ac-cumulation in GA-insensitive mutants results in in-creased levels of GA20ox1 and GA3ox1 and dein-creased levels of GA2ox due to a feedback mechanism (Achard et al., 2008; Hedden and Thomas, 2012). In our study, down-regulation of SLY1 and up-regulation of GAI and RGL2s also suggested DELLA accumulation in the shoot apex. Thus, it is likely that the increase in GA20ox1 and GA3ox1 and the decrease GA2ox1 in transcript levels during cold acclimation are the result of such a feedback mechanism. In addition, the accu-mulation of DELLAs in NO is related to its increased cold tolerance and late phenological development compared with MA.
Nucleotide Polymorphisms of VRN-A1 in NIL Lines
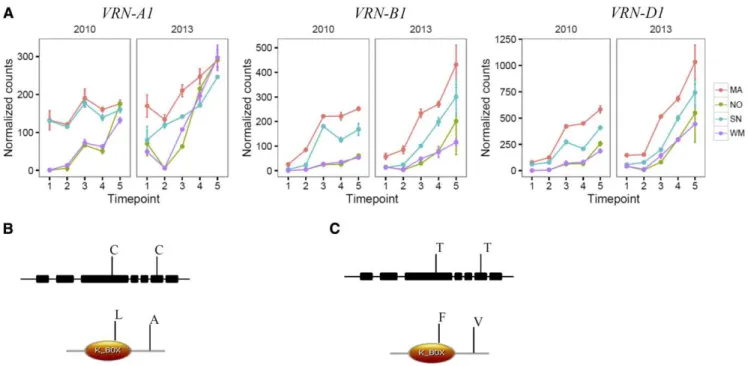
Although the phenological differences between NO and MA have been well characterized in previous studies (Limin and Fowler, 2002; Laudencia-Chingcuanco et al., 2011), the sequence differences between VRN-A1 and vrn-VRN-A1 in our NILs have not been established. The expression of vrn-A1 was very low at the first and second sampling dates but increased rapidly in NO and WM as temperatures dropped in the autumn, while VRN-A1 was expressed at a higher level in MA and SN (Fig. 5A) in both years of this study. These changes were consistent with those reported in previous studies (Laudencia-Chingcuanco et al., 2011). We extracted the mRNA sequences for vrn-A1 in NO and VRN-A1 in MA and identified two nucleotide changes at the third and sixth exons of VRN-A1 that resulted in two amino acid changes (Fig. 5, B and C; Supplemental Fig. S9). The
same single-nucleotide polymorphisms have been reported in VRN-A1 of other wheat lines with or without a vernalization requirement (Li et al., 2013). Studies have shown that the HOMEOBOX1 protein, which promotes flowering and heading date, binds strongly to the VRN-A1 protein but, due to the amino acid changes, its binding ability to the vrn-A1 protein is decreased significantly (Li et al., 2013). This posttrans-criptional regulation mechanism at the protein level explains the delayed crown development in vrn-A1 lines (NO and WM) and provides an explanation for why vrn-A1 was induced to similar transcript levels to VRN-A1 in MA and SN under cold au-tumn conditions. However, the exact molecular function of the polymorphisms needs further in-vestigation.
Allelic Effects of VRN-A1 on Phenological Development and Cold Tolerance
We further determined the allelic effects of VRN-A1 and vrn-A1 in the same genetic backgrounds through pairwise comparisons between WM versus MA and SN versus NO at each of the five time points in both years (Fig. 6; Supplemental Fig. S10). A total of 1,373 genes were significantly differentially expressed between WM and MA (Supplemental Data S5), and 963 genes were significantly differentially expressed between S N a n d N O ( S u p p l e m e n t a l D a t a S 6 ; l o g2[ f o l d
change] . 1 or , 21, FDR , 0.01) during the sampling period (Supplemental Fig. S10). Since the rate of phe-nological development was the major difference be-tween MA versus WM and SN versus NO, we focused on genes in the floral pathways that were affected by VRN-A1 during vernalization.
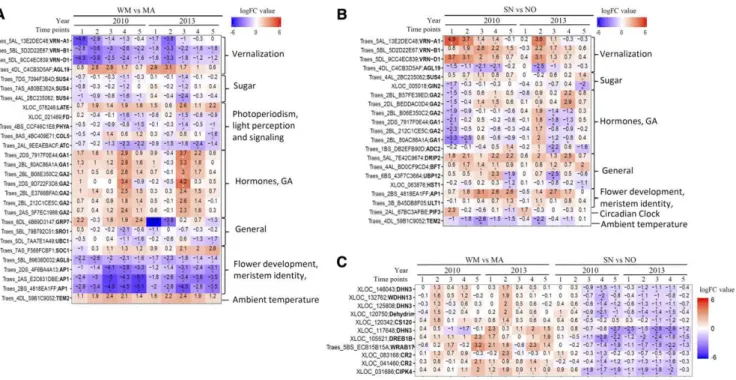
Twenty-eight and 21 flowering genes were differen-tially expressed between the WM versus MA (Fig. 6A) and SN versus NO (Fig. 6B) comparisons. Eleven genes encoding VRNs, AGL19, SUCROSE SYNTHASE4 (SUS4), GA1, GA2, and AP1 were common to the two pairs of comparisons. The expression changes in VRN-A1, VRN-B1, and VRN-D1 has been presented and discussed above (Fig. 5). Traes_4DL_C4CB3D5AF, en-coding an AGL19 protein involved in the vernalization pathway, was more highly expressed in WM than in MA but was down-regulated by cold in both WM and MA to almost equal levels at the fifth time point. The Arabidopsis agl19 mutants are late flowering under short-day conditions (Schönrock et al., 2006). The down-regulation of AGL19, therefore, delays VRT when the daylength is shortened in late winter. Three genes, encoding SUS4, were expressed at low levels in WM. Studies have shown that the overexpression of SUS4 resulted in early flowering (Seo et al., 2011). It is possible that VRN-A1 contributed to up-regulating SUS4 to promote VRT. Overexpression of LATE resul-ted in late flowering in Arabidopsis (Weingartner et al., 2011; Mittal et al., 2015). One LATE gene was elevated more in WM than in MA, suggesting a delayed
flowering by vrn-A1. Four genes involved in photope-riodism pathways were more repressed in WM than in MA. FD encodes a bZIP transcription factor that pro-motes the floral transition at the shoot apex (Abe et al., 2005). A higher expression of FD in MA compared with WM coincided with the promoted VRT by VRN-A1. One AP1 gene (Traes_2BS_4818EA1FF) was affected in both WM versus MA and SN versus NO comparisons. AP1 encodes a MADS box transcription factor that promotes meristem identity (Mandel and Yanofsky, 1995). This was repressed in WM compared with MA and expressed at higher levels in SN relative to NO, suggesting that VRN-A1 activates its expression to promote VRT. Traes_4DL_59B1C9052, encoding a TEM2 protein, which negatively regulates flower development (Mittal et al., 2015), was expressed higher in WM com-pared with MA, but its transcript level was consistently lower in SN compared with NO. We also found that seven genes encoding GA1 and GA2 were more highly expressed in WM (vrn-A1) relative to MA (VRN-A1), while six genes were expressed at lower levels in SN than in NO at the first time point. Overexpression of GA1 and GA2 in Arabidopsis resulted in an increased amount of the early intermediates ent-kaurene and ent-kaurenoic acid but no increase in bioactive GAs and no GA over-dose morphology (Fleet et al., 2003). Therefore, higher transcript levels of GA1 and GA2 in vrn-A1 lines did not result in advanced shoot apex growth in NO and WM. Collectively, VRN-A1 mainly enhanced positive regula-tors (such as VRNs, SUS4, FD, and AP1) from multiple flowering pathways to promote VRT.
There were 361 genes commonly affected in the comparisons between WM versus MA and SN versus NO. Of special note, they showed opposite expression patterns, further demonstrating the VRN-A1 influence on these genes (Supplemental Fig. S10). Studies have shown that increased VRN1 levels resulted in the down-regulation of CBF and COR gene expression, while deletion of VRN1 led to increased cold tolerance (Seo et al., 2009; Dhillon et al., 2010; Alonso-Peral et al., 2011). In addition to flowering genes (Fig. 6, A and B), 11 genes from the CBF pathway, including two CR2s, CS120, DEHYDRATION-RESPONSIVE ELEMENT-BINDING PROTEIN1B (DREB1B), WRAB17, and CIPK4 and CIPK5 dehydrin-encoding genes, were identified (Fig. 6C). These genes were expressed at higher levels in vrn-A1 lines (WM and NO) than in VRN-A1 lines (MA and SN), suggesting a repression of cold-responsive pathways by VRN-A1. More evidence of VRN-A1 effects was found in cluster C11, which contained 50 genes with higher expression levels in NO and WM compared with MA and SN (Supplemental Data S7). LATE-, TEM2-, CIPK4-, and DREB1B-encoding genes were found in this cluster. In contrast, one gene encoding DREB2A-INTERACTING PRO-TEIN2 (DRIP2) was identified in cluster C12, which has a lower expression level in vrn-A1 compared with VRN-A1 lines (Supplemental Data S7; Supplemental Fig. S8). Studies have shown that the loss of DRIP2 in Arabi-dopsis resulted in delayed development, induction of stress-related genes, and more tolerance to dehydra-tion stress (Qin et al., 2008). Together, these results not
Figure 5. Gene expression and nucleotide differences of VRN-A1 in NO and MA. A, Expression levels of VRN-A1, VRN-B1, and VRN-D1 genes in MA, NO, SN, and WM during cold acclimation. Normalized counts were plotted. B and C, Nucleotide changes and amino acid differences in VRN-A1 alleles between MA (B) and NO (C). Domains of amino acid sequences were predicted from the pfam database (http:pfam.xfam.org).
only suggested a role of vrn-A1 and VRN-A1 in regu-lating flowering genes and certain cold-responsive genes but also indicated that the delayed flower development and cold-responsive pathways are interrelated.
A recent study suggests that VRN1 binds to the pro-moter of its target genes to activate or repress their tran-scription in the leaves of barley seedlings (Deng et al., 2015). The CArG box motif is the typical binding site for MADS box transcription factors, such as VRN1 (Deng et al., 2015). We further examined the occurrence of the CArG box motif in the promoters of 361 genes. Our results showed the presence of a putative CArG box motif in the promoters of 298 genes (Supplemental Data S7), suggest-ing that these genes could be targets of VRN-A1 in wheat. Among these, CIPK4, DREB1b, and two DHN3s were from cold pathways and AP1, SUS4, TEM2, AGL19, VRN-A1, VRN-B1, VRN-D1, and AGL8 were from flowering path-ways (Supplemental Data S7). These results further indi-cated a role of VRN-A1 in regulating the transcription of cold genes and flowering genes. One direct binding target of barley VRN1 is FT1/VRN3 (Deng et al., 2015); however, its transcript was not detected in wheat crowns in this study (Supplemental Fig. S11A). The discrepancy could be due to the type of tissues (seedlings without roots versus crowns) used and the different experimental conditions (long-day versus field conditions). It is known that FT is expressed at high levels in leaves and that the FT protein is transported through the phloem to the shoot apical
meristem (Chen and Dubcovsky, 2012). The barley AP1/ MADS3 was identified as one of the VRN1 targets in barley (Deng et al., 2015). We also found the CArG box motif in the promoter of Traes_2BS_4818EA1FF that encodes the wheat AP1 (Supplemental Data S7). Notably, transcript levels of three homeologous genes encoding AP1 (Trae-s_2AS _ E 2 C 6 3 1 D B E , T r a e s _ 2 B S _ 4 8 1 8 E A 1 F F , a n d Traes_2DS_4F6BA4A13) were up-regulated sig-nificantly after the second time point in both MA and SN but were not expressed in NO and WM (Fig. 6A; Supplemental Fig. S11B). These results suggested that the three AP1 genes could be regulated by VRN-A1 in wheat. Furthermore, these genes were up-regulated to much higher levels in MA compared with SN (Fig. 6A; Supplemental Fig. S11B). Since MA was the only genotype to advance to the double ridge stage at the third time point in both years (Fig. 1C), the high transcript levels of the three AP1 genes in MA could be responsible for its ad-vanced shoot apex development. Hence, our results not only revealed the influences of VRN-A1 on the transcrip-tion of AP1 genes but also indicated their important role in shoot apex development.
Genes in Cell Wall Metabolism Are Correlated with Cold Tolerance
As the NILs have different capabilities to tolerate cold, as demonstrated by LT50 values, we further
Figure 6. Allelic effects of VRN-A1 on flower development genes. A and B, DEGs in flower development pathways between WM versus MA (A) and SN versus NO (B). C, DEGs in cold pathways that were identified in both WM versus MA and SN versus NO comparisons. Pairwise comparisons were conducted at each time point for WM versus MA and SN versus NO in 2010 and 2013. Heat maps display log2fold change (logFC) values and FDR values (*, FDR , 0.01) for each comparison at each time point. Rows represent genes as indicated by specific gene names on the y axis. Columns represent comparisons between WM versus MA pairs (A) and SN versus NO pairs (B) in 2010 and 2013 at five sampling time points (1, 2, 3, 4, and 5).
identified 32 DEGs that were highly correlated to LT50
through Pearson correlation analysis between the nor-malized counts and LT50 values (r . 0.85 or , 20.85 and FDR , 0.05 in both 2010 and 2013; Supplemental Data S8). A number of genes that encode glycosyl-transferases, galactosyltransferase, b-glucosidases, hy-drolases, and phosphatases involved in carbohydrate metabolic processes were identified. Of these genes, 14 genes were negatively correlated with LT50. They were up-regulated to the highest expression levels in NO, lowest levels in MA, and intermediate levels in SN and WM (Supplemental Data S8). Six of them encode glycosyltransferases, including nucleotide-diphospho-sugar transferase, glycosyltransferase, and galactosyl-transferase, which catalyze the synthesis of glycosidic bonds to generate polysaccharides in cell walls (Supplemental Data S8; Supplemental Fig. S12; Lairson et al., 2008). In contrast, 18 genes were positively cor-related with LT50. Five encode glycosylhydrolases, such
as b-glucosidases, which hydrolyze the glycosidic bonds with the release of Glc (Supplemental Data S8; Supplemental Fig. S12; Tenhaken, 2015). Our results indicated that the biosynthesis of polysaccharides was up-regulated through glycosyltransferases, while the hydrolysis of polysaccharides was repressed by cold. Genes encoding enzymes capable of synthesizing or hydrolyzing components of the plant cell wall show differential expression when subjected to different stresses (Tenhaken, 2015). It is likely that the high gene expression levels of glycosyltransferase-encoding genes and the low expression for glycosylhydrolases in NO facilitate cold tolerance through changes in cell wall composition. Three genes encoding apyrases also were positively correlated with LT50. The suppression of apyrase-encoding genes in Arabidopsis resulted in in-creased lignification in cell walls, inhibition of root growth, and polar auxin transport in shoots (Lim et al., 2014). Lignification has been shown to increase resis-tance to cold temperatures (Griffith and Yaish, 2004). This suggests that, besides transcriptional regulation, changes in cell wall composition and cross-linking have important roles in determining cold tolerance (Tenhaken, 2015).
Differences in Subgenome Dominance on Chromosome 6 of Winter and Spring Wheat
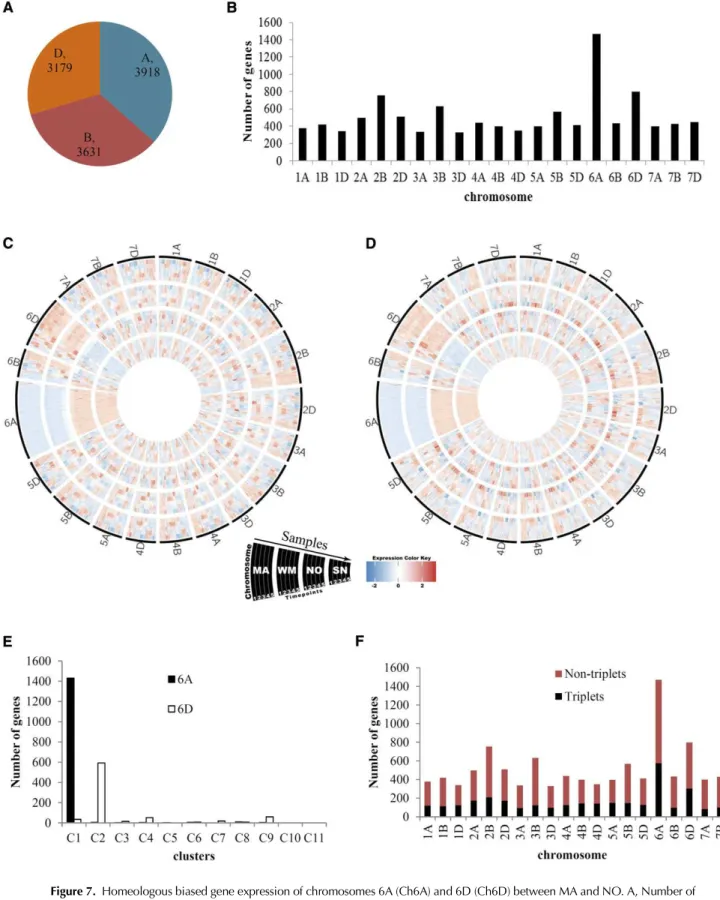
Common wheat is an allohexaploid species, consist-ing of A, B, and D genomes, and each contains seven pairs of homeologous chromosomes. To assess the ge-nome dominance between the NO and MA genetic backgrounds, we investigated the impact of chromo-some positioning of genes on the transcript abundance of A, B, and D genomes. A total of 10,728 DEGs were categorized according to the A, B, and D genome chromosomes. Similar numbers of genes were found in each genome (Fig. 7A). However, Ch6A and Ch6D carried the largest number of genes (Fig. 7B). A striking pattern was identified after plotting the normalized
expression of DEGs for each chromosome for 2010 (Fig. 7C) and 2013 (Fig. 7D). A large number of genes on Ch6A were expressed at lower levels in MA and WM compared with NO and SN. In contrast, most of the genes on Ch6D were more highly expressed in MA and WM relative to NO and SN. We further investigated the distribution of the genes on Ch6A and Ch6D in each cluster. The results showed that 1,430 out of 2,811 genes in cluster C1 were located on Ch6A, while 593 out of 2,277 genes of cluster C2 were located on Ch6D (Fig. 7E). Clearly, the preferential gene expression on Ch6A and Ch6D between NO and MA genotypes could be partly explained by genetic effects.
Homeologous genes have been shown to be expressed preferentially in subgenomes under drought stress in wheat (Pfeifer et al., 2014; Liu et al., 2015). Therefore, we further investigated the homeologous gene expression on Ch6A and Ch6D. Based on the list of triplets (Pfeifer et al., 2014), 3,132 DEGs were triplets, of which Ch6A and Ch6D contain 576 and 303 genes, re-spectively (Fig. 7F; Supplemental Data S9). The number of expressed triplets was notably higher for Ch6A and Ch6D than any other chromosomes. Therefore, the ex-pression pattern on Ch6A and Ch6D was partly at-tributed to homeologous gene expression. The distinct patterns of gene expression between MA and NO ge-netic backgrounds not only suggested critical roles of Ch6A and Ch6D in the expression of spring and winter growth habit but also indicated an important regula-tory mechanism at the genome level to orchestrate the complex intergenomic gene expression in allopolyploid wheat.
Additional evidence can be found supporting the importance of the group 6 chromosomes in determining cold responses. A quantitative trait locus on Ch6A for minimum final leaf number was found to be closely linked to a quantitative trait locus for low-temperature tolerance in a mapping population with WM and NO from this study as parents (Fowler et al., 2016). The Wcs120 gene family located on the group 6 chromo-somes of all three hexaploid wheat genomes plays an important role in maintaining plant cell membrane in-tegrity during freezing (Sarhan et al., 1997). It also has been shown that Ch5A (the location of Frost Resistance2) has a regulatory effect on the expression of the Wcs120 genes found on the group 6 chromosomes (Limin et al., 1997). The biased expression on Ch6A and Ch6D could be the result of natural selection for differences in the levels of cold stress experienced by winter and spring wheat genotypes. Differences in growth habit meant that the winter and spring wheat gene pools have been largely isolated, and it is likely that this isolation led to the evolution and selection for complex gene combi-nations that favor adaptation to environmental ex-tremes. Some of the broader implications of the role of subgenome dominance relate to the wide adaptation of hexaploid wheat and crop improvement breeding strategies. The allopolyploid structure of hexaploid wheat allows for complex homeoallelic interactions and heterotic effects to be fixed, giving a potential
Figure 7. Homeologous biased gene expression of chromosomes 6A (Ch6A) and 6D (Ch6D) between MA and NO. A, Number of DEGs from the A, B, and D genomes. B, Genome-wide distribution of DEGs. DEGs were categorized according to 21 chromosomes in the A, B, and D genomes of hexaploid wheat. C and D, Relative expression levels of DEGs on wheat chromosomes in 2010 (C) and 2013 (D) were plotted using Circos software. Samples were ordered from time points 1 to 5 for MA, WM, NO, and SN, as dem-onstrated. Expression is scaled across genes (z score). E, Number of DEGs on Ch6A and Ch6D in each cluster. F, Homeologous triplets (black) and nontriplets (red) on each of the 21 chromosomes. Triplets were compiled according to the list from Pfeifer et al. (2014).
advantage that is normally associated with hybrid cultivars in lower ploidy species.
CONCLUSION
Whole-transcriptome profiling, using the more ac-curate and holistic RNA-seq technology, of winter and spring wheat and their NILs provided a complete pic-ture of the molecular and genetic interactions between multiple signaling and interactive pathways that in-fluence cold tolerance and shoot apex development in wheat grown under autumn field conditions. Four wheat lines, NO, MA, and their NILs (WM and SN) with the VRN-A1 alleles swapped, were employed to explore the transcriptional changes at five time points in two years from early autumn to winter. The avail-ability of NILs for the VRN-A1 locus in hardy and cold-tender genetic backgrounds allowed us to separate cold acclimation and vernalization responses in wheat (Limin and Fowler, 2002). The progression of cold re-sponses where plants were subjected to a combination of environmental factors present in nature, including temperature, light intensity, photoperiod, etc., added to the uniqueness of this study (Campoli et al., 2009; Sutton et al., 2009; Winfield et al., 2010; Greenup et al., 2011; Laudencia-Chingcuanco et al., 2011). Our results demonstrated several of the cold tolerance strategies wheat has evolved to optimize autumn seedling growth and development in preparation for a wide range of low-temperature challenges.
Genetic backgrounds in winter and spring wheat have a large influence on the expression of cold-responsive and phenologically cold-responsive pathways. We demonstrated that NO and SN maintain the CBF pathways at a higher level than MA and WM. We fur-ther uncovered evidence that the MA genetic back-ground genetically promotes VRT while the NO genetic background delays shoot apex development. These observations showed that the factors responsible for cold tolerance affect active growth and that the link of cold tolerance to phenological development is adaptive for the environment for which the genotype is selected or in which it evolved. This study provides new insights into the molecular mechanisms regulating major flow-ering genes (e.g. FCA, AGL24, AGL19, TEM2, and LATE) to delay the floral transition during cold accli-mation in wheat. Investigation of VRN-A1 effects revealed its role in regulating both flowering genes and cold-responsive genes. VRN-A1 down-regulated the expression of CORs or DHNs and enhanced the tran-scription of multiple positive regulators such as AP1, SUS4, and FD in flowering pathways to promote VRT. Although the influence of VRN-A1 on these genes re-quires further investigation, we identified a putative CArG motif in the promoters of some cold and flow-ering genes, which suggests their interactions with VRN-A1. Another major finding of this study was the subgenome dominance on Ch6A and Ch6D between spring and winter growth habit. This finding added to
the complexity of the genetic systems involved in de-termining phenological development and cold toler-ance in hexaploid wheat. Together, our study provides a valuable data set and a foundation for the future in-vestigation into the environmental and genetic control of VRT in wheat during seasonal cold acclimation un-der field conditions.
MATERIALS AND METHODS Plant Material
The common wheat (Triticum aestivum) genotypes NO, MA, and the NILs SN and WM, which represent different reproductive strategies and cold tolerance potentials, were used in these studies (Limin and Fowler, 2002; Fowler and Limin, 2004). NO is a winter-habit genotype with a long vernalization requirement that has been a primary source of cold tolerance genes in winter wheat breeding programs, and MA was a widely adapted cold-susceptible spring wheat genotype grown in western Canada. The difference in vernalization requirement of the winter habit (vrn-A1, vrn-B1, and vrn-D1) and the spring habit (Vrn-A1, Vrn-B1, and Vrn-D1) genotypes is due to a single dominant gene located on chromosome 5A (Brule-Babel and Fowler, 1988). The reciprocal NILs were developed to de-termine the interactions between cold tolerance and vernalization requirement. The initial hybrid from the NO 3 MA cross was backcrossed to each parent 10 times prior to selfing to produce homozygous NILs (SN and WM) that are theoretically ;99.9% genetically similar to their respective parental cultivars. For each backcross, a phenotype-based selection of progeny with a Vrn-A1 or vrn-A1 locus was used to verify that the donor parent allele was transferred into the genetic background of the recurrent parent.
Field Trials and Sample Collection
NO, MA, SN, and WM were grown in two field trials at Saskatoon (52°N, 107°W; Vertic Haploboroll soil), Saskatchewan, Canada. They were planted in the conventional summer-fallow period on August 26, 2010, and August 29, 2013, which is during the recommended seeding period for winter wheat in this region. The experimental design of both trials was a randomized complete block with two replicates. Plot size was 16 6-m-long rows with row spacing of 23 cm in 2010 and 30 cm in 2013. All trials were seeded with a small plot hoe-press drill at a seeding rate of 185 seeds row21. Phosphate fertilizer (11:51:0) was
applied with the seed at rates based on soil test recommendations for maximum grain yield. Other elements were not considered limiting.
Weather stations located in the plot areas recorded 1-cm soil temperatures (crown depth) each autumn starting on September 1 (daylength = 13.3 h). Plants were collected periodically (Fig. 1) for cold hardiness and morphological measurements and tissue analyses from the third week in September to the first week in November (daylength = 9.3 h; http://www.timeanddate.com/sun/ canada/saskatoon), at which time soil temperatures had reached 0°C. Each sampling date, plants were harvested in the field at the same time (between 10:30 and 11:30AM) to minimize circadian rhythm effect. Plants that have sus-tained severe over-winter low-temperature damage often can produce a flush of green leaves in the spring, but these plants will die unless new roots are established by the crown (Chen et al., 1983). Because it is the critical region of the plant for winter survival, crown tissue was selected for analyses in this study. Crown tissue (less than a 1-cm-long section at the base of the crown) for RNA extraction was collected from 40 to 60 plants in each treatment and replicate, flash frozen in liquid nitrogen, and stored in a 280°C freezer.
The rate of plant phenological development (dissection of the plant crown to reveal shoot apex development) and cold hardiness were monitored during the acclimation periods. LT50measurements were employed to determine the cold
hardiness of each genotype at each sampling date in each replicate in each year using the procedure outlined by Fowler et al. (2016). For each LT50estimate, five
crowns were frozen at 2°C intervals at each of five test temperatures that were predetermined for each genotype. The crowns were placed in aluminum weighing cans, covered in moist sand, and then loaded into a programmable freezer that was held at 23°C for 12 h. After 12 h, they were cooled at a rate of 2°C h21down to 217°C and then cooled at a rate of 8°C h21until the selected
temperatures in each treatment were reached. The crowns were thawed over-night at 4°C and then transplanted into 52- 3 26- 3 6-cm black plastic trays
(Kord Products) containing Sunshine artificial soil medium for regrowth at 20°C with a 16-h day and 8-h night. Plant recovery was rated (alive versus dead) after 3 weeks, and the LT50was calculated for each genotype within each
rep-licate.
mRNA Sequencing and Data Processing
RNA samples were extracted from crowns using the Plant RNA Isolation Mini Kit (Agilent Technologies). The yield and RNA purity were determined spectrophotometrically with Nanodrop 1100 (Thermo Scientific), and the quality of the RNA was verified by the Agilent 2100 Bioanalyzer (Agilent Technologies). Purified total RNA was precipitated and resuspended in RNase-free water to a final concentration of 100 ng mL21. A total of 80 cDNA libraries were
con-structed using the TruSeq RNA Sample Preparation Kit version 2 (Illumina) with two replicates at each time point for each wheat line in 2010 and 2013. Paired-end sequencing was conducted on the Illumina HiSeq2500, generating 101-nucleotide reads, at the National Research Council, Aquatic and Crop Resource Development, in Saskatoon, Canada. Sequencing adapters were re-moved, and low-quality reads were trimmed using Trimmomatic with default settings (Bolger et al., 2014). The filtered reads from 80 libraries were mapped to the wheat genome survey version 2.1 sequence obtained from Unité de Re-cherche Génomique Info (http://wheat-urgi.versailles.inra.fr/; International Wheat Genome Sequencing Consortium, 2014) using STAR (Dobin et al., 2013). Transcript identification was then performed with Cufflinks in GTF-guided mode and followed by Cuffmerge (Trapnell et al., 2012). Read counts per transcript were estimated using HTSeq (Anders et al., 2015).
Differential Expression Analysis
Differential expression analysis was performed with DESeq2 (Love et al., 2014). Raw data counts were normalized by library size and fit to a negative binomial model. Sample dispersions were estimated and fitted to the predicted fit line using the method of estimating the dispersions. Two different approaches were applied to identify DEGs. (1) Likelihood ratio tests were used to identify DEGs affected by temperature, genotype, and their interactions during acclimation of the NILs. To enable the removal of unwanted noise resulting from unmodeled signals inherent in the data derived from uncon-trolled field conditions, the Surrogate Variable Analysis R package (Leek, 2014) was used to calculate latent factors that were included in the DESeq2 experi-mental design model. DEGs in the NILs were identified using the nbinomLRT function by null hypotheses, which tested whether each gene was affected by genotype and/or the interaction of genotype and time point. P values were adjusted using the Benjamini-Hochberg correction for multiple testing (Benjamini and Hochberg, 1995). Genes with a reported FDR , 0.05 were considered to show a statistically significant difference between samples. (2) Pairwise comparisons at each time point were performed to specifically in-vestigate the effects of swapping VRN-A1 between WM versus MA and SN versus NO on the VRT during vernalization under field conditions with DESeq2 (Love et al., 2014). Genes were determined to be significantly differ-entially expressed if they had a log2(fold change) . 1 or , 21 and FDR , 0.01.
Gene Coexpression Analysis
To identify genes that exhibit similar expression across five time points in different wheat lines, count data were normalized to the log2scale using the rlog
function in DESeq2, which minimizes differences between samples and normal-izes with respect to library size. Clustering was performed with rlog values of DEGs using WGCNA (Langfelder and Horvath, 2008) with a soft thresholding power of 7. Next, groups of closely connected genes were identified by hierar-chical clustering based on the topological overlap matrix and cutting the resulting dendrogram with the dynamicTreeCut program with deepslipt = 4, minModu-leSize = 50 to obtain maximum dynamic gene clusters. Initial clusters with similar expression profiles were merged at cutheight = 0.3. MES values that represented the first principal component of each cluster were calculated. Clusters with negative Pearson correlation coefficient values (r . 0 and FDR , 0.05) of MES between 2010 and 2013 were considered as environmental effects and eliminated for the following analysis.
In order to categorize gene expression patterns among clusters, PCA was performed using the prcomp function from the R base package. Malhalanobis distances and associated P values were calculated using the pca-utils software tools (Worley et al., 2013).
Gene Functional Annotations and Classifications
For gene annotation, coding sequence regions of each gene in the wheat reference genome as well as the novel transcripts were compared (BLASTx) against the TAIR10 protein database as well as the nonredundant Uniprot Plant database using a cutoff of E26. GO annotations for mRNA transcript sequences
were derived from a combination of three protein databases: the National Center for Biotechnology Information nonredundant protein sequence data-base, Uniprot Swiss-Prot manually reviewed protein datadata-base, and Uniprot TrEMBL automatically annotated protein database. mRNA transcript sequence alignments to these protein databases were performed according to De Wit et al. (2012). Alignment results were combined to produce gene-to-GO term associ-ation using python scripts. The custom functional GO annotassoci-ation was used to calculate GO enrichment for gene clusters via Fisher’s exact test and was per-formed using the topGO R package (Alexa and Rahnenfuhrer, 2016). Fisher’s exact tests with FDR , 0.05, computed by taking the whole transcriptome as background, were considered significantly enriched. Only GO terms for bio-logical process are shown. MapMan bins of wheat genes identified were assigned by the Mercator pipeline for automated sequence annotation (http:// www.plabipd.de/portal/mercator-sequence-annotation; Lohse et al., 2014). A value of 50 was used as BLAST_CUTOFF. Genes in cold-responsive pathways were identified based on Arabidopsis genes and BLASTx (E value cutoff = 1e26)
searches against known genes in wheat and barley. Genes in flower develop-ment pathways were compiled from the Flowering Integrative Database (http://www.phytosystems.ulg.ac.be/florid/; Bouché et al., 2016).
For the identification of putative CArG box motifs, known motifs were obtained from the barley CArG box motif (Deng et al., 2015) and the consensus CArG box motifs [C(W)8G, CC(W)6GG, and CC(W)8GG] from the PLACE
da-tabase (Higo et al., 1999). Promoters (3 kb upstream of the transcription start site) of VRN-A1-affected genes (Supplemental Data S7) were scanned for the occurrence of the CArG box motifs using the HOMER program with default parameters (Heinz et al., 2010). The CArG motifs found in the promoters are listed in Supplemental Data S7.
Accession Numbers
RNA-seq data can be found in the Gene Expression Omnibus under the accession number GSE101118.
Supplemental Data
The following supplemental materials are available.
Supplemental Figure S1.Statistics of RNA-seq reads mapped to the bread wheat reference genome assembly.
Supplemental Figure S2.DEGs in 2010 and 2013 field trials.
Supplemental Figure S3.Clustering dendrogram of DEGs together with the assigned module color.
Supplemental Figure S4.Gene expression profiles for the identified coex-pression modules.
Supplemental Figure S5.PCA and tree diagrams of 12 coexpressed clus-ters.
Supplemental Figure S6.Overview of MapMan bin assignment of DEGs. Supplemental Figure S7.Heat map display of genes involved in the
cal-cium signaling pathway.
Supplemental Figure S8.Heat map display of genes involved in flower pathways.
Supplemental Figure S9.Allelic differences between VRN-A1 and vrn-A1. Supplemental Figure S10.Pairwise comparisons to identify the allelic
ef-fects of swapping VRN-A1 in spring and winter habit lines.
Supplemental Figure S11.Transcript levels of genes encoding VRN3/FT-A1, VRN3/FT-B1, and AP1/MADS3 in crowns of NILs.
Supplemental Figure S12.Transcript levels of genes that are highly corre-lated with LT50values.