HAL Id: hal-00304742
https://hal.archives-ouvertes.fr/hal-00304742
Submitted on 1 Jan 2002HAL is a multi-disciplinary open access archive for the deposit and dissemination of sci-entific research documents, whether they are pub-lished or not. The documents may come from teaching and research institutions in France or abroad, or from public or private research centers.
L’archive ouverte pluridisciplinaire HAL, est destinée au dépôt et à la diffusion de documents scientifiques de niveau recherche, publiés ou non, émanant des établissements d’enseignement et de recherche français ou étrangers, des laboratoires publics ou privés.
intertidal flats
E. C. Defew, T. J. Tolhurst, D. M. Paterson
To cite this version:
E. C. Defew, T. J. Tolhurst, D. M. Paterson. Site-specific features influence sediment stability of intertidal flats. Hydrology and Earth System Sciences Discussions, European Geosciences Union, 2002, 6 (6), pp.971-982. �hal-00304742�
Site-specific features influence sediment stability of intertidal flats
Emma C. Defew
1, Trevor J. Tolhurst
2and David M. Paterson
11Sediment Ecology Research Group, Gatty Marine Laboratory, University of St Andrews, Fife, KY16 8LB, Scotland
2Special Research Centre for Ecological Impacts of Coastal Cities, Marine Ecology Laboratories, A11 University of Sydney, NSW, 2006 Australia
Email for corresponding author: [email protected]
Abstract
The factors that influence the sediment stability and the transport of estuarine mudflats are not yet fully understood but knowledge of them is essential in coastal engineering applications and pollution ecology studies. The suggestion that variation in predictive models of sediment stability might be due to site-specific characteristics is investigated using data from four estuarine mudflats (Eden Estuary, Scotland, the Biezelingsche Ham, Zandkreek, and Molenplaat mudflats in The Netherlands). These estuaries differ in their environmental conditions, macrofaunal species composition and local features (e.g. Enteromorpha mats, migratory biofilms). Stable and unstable sediments were compared, and mean chlorophyll-a concentrations and granulometry of the sediments were significantly different between the two groups. Step-wise multiple linear regressions were applied to the sediment stability data of all sites to establish the influences on erosion threshold of microphytobenthic biomass, water content, granulometry, organic carbon content and the abundance of dominant macrofaunal species. The stability of each site was influenced by different factors. Sediment stability of the Eden Estuary was affected by the Enteromorpha bloom; Biezelingsche Ham was influenced by the highly migratory nature of the diatom biofilms and the abundance of Corophium volutator; the polychaete worm Arenicola marina had a net negative effect on sediment stability of the Zandkreek; and the Molenplaat was influenced by microphytobenthic biomass. This research highlights the need for site-specific calibration of models and suggests that a universal proxy parameter for sediment stability is unlikely to be obtained.
Keywords: sediment stability; erosion threshold; cohesive strength meter; microphytobenthos; Enteromorpha spp.
Introduction
Estuarine mudflats are areas of both ecological and economic importance and are under increasing threat from climatic and anthropogenic pressures (Bryant, 1997; Pew Center, 2002). As a result, the factors that influence sediment stability and transport need to be understood. Sediment transport is governed by a combination of physical, chemical and biological properties and processes (Black et al., 2002). Physical factors include bulk density, mineralogy, water content, bed roughness, tidal currents, wave forcing and disturbance by intermittent events such as storms and increased rainfall, whilst chemical properties include salinity, pH and the adsorption and cation exchange capacity (Dade et al., 1992). The impact of biology on the sediment can be stabilising and/or destabilising. Microphytobenthos are well known for their stabilising effects as a result of the secretion of extracellular polymeric substances (EPS) that are produced during locomotion (Underwood and Paterson,
1993; Riethmüller et al., 1998; Austin et al., 1999; Tolhurst
et al., 2002), whilst macrofaunal species can destabilise the
sediment via processes such as bioturbation and grazing (i.e. Daborn et al., 1993; Gerdol and Hughes, 1994; Widdows et al., 1998a; Willows et al., 1998; de Deckere et
al., 2001) or stabilise the sediment due to the construction
of mucus-lined burrows (Meadows et al., 1990; Mouritsen
et al., 1998).
The interactions between these processes are, for the most part, poorly quantified and understood (Widdows et al., 2000), making it difficult for predictive models of sediment stability to be sufficiently accurate. In past studies, chlorophyll-a was found to be an important variable correlating with sediment stability (Hakvoort et al., 1998; Riethmüller et al., 1998; Austin et al., 1999; Paterson et
al., 2000; Riethmüller et al., 2000; Defew et al., in press).
However, the relationships detected are often weak, suggesting that important interactions are being missed.
This paper investigates some of the factors that influence the stability of intertidal surface sediment through field investigations designed to maintain the natural condition of the sediment. Riethmüller et al. (2000) have suggested that variation in sediment stability cited in the literature might reflect site-specific differences and this hypothesis is examined by investigating four estuarine mudflats, covering a broad range of conditions, species composition and local features.
Materials and methods
STUDY SITES
Four intertidal systems were examined: The Eden Estuary (Scotland), Biezelingsche Ham and Zandkreek mudflats and the Molenplaat (all in The Netherlands).
Eden Estuary Mudflats
Two large-scale grids (with grid nodes spaced 100 m apart) were established and sampled on the intertidal mudflats of the Eden Estuary (56° 22’ N, 2° 51’ W) during August 1999. The Estuary has a total area of 8 km2, an average exposure period of 6–7.25 hours and tidal currents dominate the hydrodynamics. Sediment grain size decreases up the Estuary, with the sampled sites containing mud and silty sands that exhibited cohesive behaviour (Taylor, 1998). Dominant sediment infauna found in this study included
Cerastoderma edule, Corophium volutator, Eteone longa, Hydrobia ulvae, Macoma balthica, Mytilus edulis, Nereis diversicolor, Oligochaete spp., Scrobicularia plana, Spio filicornis and Tubificoides spp.
Eden Grid A ran from the top shore down to the channel of the river Eden. One of the local features of this site is the large-scale bloom of the opportunistic macrophyte,
Enteromorpha spp., that forms in the spring and lasts until
late autumn. Grid B was further upstream and was bisected by the channel of the river Eden. Local features of this site included a small bloom of Enteromorpha on the north bank and some minor drainage channels.
Netherlands mudflats
In June 2000, the three mudflats in The Netherlands were sampled extensively, using a grid design on the Biezelingsche Ham and Zandkreek mudflats and a line transect on the Molenplaat. Transect nodes were spaced 100 m apart.
The Biezelingsche-Ham mudflat is a protected embayment located on the north shore of the turbid, eutrophic and well-mixed Westerschelde Estuary (51° 26’ N, 3° 55’ E). It has an area of about 1.5 km2 and a mean tidal range of
approximately 4 m. The mudflat surface is mostly level with some minor drainage channels, and major bedforms are generally absent (de Brouwer et al., 2000). Dominant macrofauna found at this site during this study were C. edule,
C. volutator, E. longa, Heteromastus filiformis, H. ulvae, M. balthica, Oligochaete spp., S. plana, and S. filicornis.
One of the local features of this site was a thick, confluent, migratory biofilm found on the top-shore.
Zandkreek is a small mudflat (<1.5 km2) situated on the south shore of the oligotrophic Oosterschelde Estuary (51° 32’ N, 3° 54’ E). Dominant macrofauna of this study were
Arenicola marina, C. edule, C. volutator, E. longa, H. filiformis, H. ulvae, M. balthica, Oligochaete spp., Scoloplos armiger, S. plana, S. filicornis and Tharyx marioni.
The Molenplaat (51º 26’ N, 3º 57’ E) is a small intertidal flat (~1.5 km2) situated in the Westerschelde Estuary. Most of the tidal flat is located between –1 and +1 m relative to mean tidal level. The mean tidal range is approximately 5 m with the average emersion period ranging between 4.5–8 hours (Herman et al., 2001). Diatoms dominate the microphytobenthic assemblage for most of the year, with the occasional occurrence of cyanobacteria and euglenoids (Sabbe and Vyverman, 1991; Sabbe, 1993; Barranguet et
al., 1997). At the time the measurements were taken, the
dominant macrofaunal species were Bathyporeia spp., C.
edule, C. volutator, H. filiformis, H. ulvae, M. balthica, Pygospio elegans and T. marioni. This mudflat is well
known for the seasonal appearance in the summer months of a centralised area where silt and diatoms interact and accumulate (Lucas and Holligan, 1999; Herman et al., 2001). SAMPLING
The data presented here are from a number of field campaigns carried out during the BIOPTIS (EU MAS3-CT97-0158) and CLIMEROD (EU MAS3-CT98-0166) projects between August 1999 and April 2001. Each measurement of erosion threshold was matched with a measurement of microphytobenthic biomass
(chlorophyll-a (chlorophyll-and minimum fluorescence), m(chlorophyll-acrof(chlorophyll-aun(chlorophyll-al density,
sediment grain size, water content and organic content. The top 3–5mm of the sediment surface was sampled using the contact core method described by Honeywill et al. (2002) and used for sediment analyses. Water content of the sediment was determined from freeze-dried contact cores and was expressed as a percentage of the original sediment wet weight. The concentration of chlorophyll-a in the sediment was measured from freeze-dried sediment, extracted using dimethylformamide (DMF) and measured with high performance liquid chromatography (HPLC) (Wiltshire et al., 1998). Some contact cores from the Eden
Estuary contained Enteromorpha. Surface organic matter was calculated using the ash-free dry weight method. Samples were dried to a constant weight in an oven at 100ºC. A sub-sample of known weight was ashed at 550ºC for 6 hours and then re-weighed after being allowed to cool at room temperature in a desiccator.
Macrofauna were sampled from the top 15 cm using a 19 cm (diameter) stovepipe core (0.028 m2). Samples were sieved over a 1 mm-grade sieve, fixed with 4% formalin and stained with Rose-Bengal. Macrofauna were identified to species level whenever possible.
Minimum fluorescence (F015) was determined using
non-invasive fluorescence from cells that had been dark-adapted for 15 minutes, and was used as a proxy for biomass (Barranguet and Kromkamp, 2000; Honeywill et al., 2002) and to follow the migration of diatom cells towards and away from the sediment surface (e.g. Serôdio et al., 1997; 2001).
In April 2001, sediment stability and biomass at the sediment surface (F015) was mapped (i.e. coupled
measurements taken on the same patch of sediment at each time period) for the duration of a tidal exposure period, on a thick confluent biofilm situated at a high shore site on the Biezelingsche Ham mudflat.
Water content and colloidal carbohydrate concentration were determined from contact cores taken as close as possible to the sediment stability measurement. Colloidal carbohydrate was measured using the phenol-sulphuric acid assay (Dubois et al., 1956). Absorbance was measured on a spectrophotometer against a reagent blank at 485nm, and concentration was calibrated against a glucose standard curve. Results were expressed as microgram glucose equivalents per gram of sediment (µg glucose eq. g–1) (Underwood et al., 1995).
SEDIMENTOLOGY
Granulometry samples were collected with a 70 mm (diameter) core to a depth of 0.1 m. Samples were oven-dried for 48 hours at 100ºC. 25 g oven-dried samples were treated with sodium hexametaphosphate solution and left to stand overnight. Sediment was stirred for 15 mins and wet sieved through a 63 µm sieve. The residue was re-dried at 100ºC for a further 48 hrs before sediments were dry sieved with a stacked shaker (ranging from 2.0 mm to 0.063 mm) (method modified from Buchanan and Kain, 1971). For convenience, grain size distribution was split among five groups: gravel (>2 mm), coarse sand (1–2 mm), medium sand (0.250– 1 mm), fine sand (0.063–0.250 mm) and silt-clay fraction (<0.063 mm).
MEASUREMENTS OF SEDIMENT STABILITY
Sediment stability was measured in situ using the Cohesive Strength Meter (CSM) (Tolhurst et al., 1999). The device consists of a water-filled chamber 30 mm in diameter, pushed into the sediment. A jet of water is released from the top of the chamber and directed at the sediment surface. The velocity of the jet pulse is increased systematically over time. Sediment stability is expressed as a threshold for sediment erosion, determined when the light transmission across the test chamber dropped below 90% (approximately equal to an erosion rate of 0.01 kg m–2) as the bed fails. During this investigation, sediments whose erosion thresholds were >2 Nm–2 were considered to be ‘stable’ and sediments whose erosion thresholds were <2 Nm–2 were considered to be ‘unstable’. At Enteromorpha-dominated sites, this macrophyte was carefully moved off the sediment surface before making CSM measurements.
STATISTICS
Using SPSS (version 10.05), stepwise multiple linear regressions were applied to the sediment stability data to establish the influences of chlorophyll-a, minimum fluorescence, water content, % gravel, % coarse sand, % medium sand, % fine sand, % silt-clay, organic content and the abundance of dominant macrofaunal species on erosion threshold. Prior to analysis, all necessary transformations were applied to the data to conform to normality of distribution and homogeneity of variances. In the analysis of the entire data set, a total of 321 measurements was considered. Significant differences in mean values between ‘stable’ and ‘unstable’ sediments, and between sites in the presence and absence of Enteromorpha spp., were examined using the T-test and one-way ANOVA (Zar, 1999).
Results
Eden Estuary mudflats
All measured variables were compared between sites in the presence and absence of the Enteromorpha for both of the grids (Table 1a). Water content of the sediments was significantly higher under Enteromorpha on both grids (one-way ANOVA; P≤ 0.001). Chlorophyll-a concentration was significantly higher at Enteromorpha sites on Grid A but not on Grid B (one-way ANOVA; P≤ 0.001). The percentage of medium sand was greater on Enteromorpha sites at Grid B but not significantly different on Grid A (one-way ANOVA; P≤ 0.001). The percentage of silt-clay and organic carbon, as well as minimum fluorescence, was greater on Enteromorpha sites at Grid A but not significantly different on Grid B (one-way ANOVAs; P≤ 0.001).
Table 1a. Descriptive statistics of erosion threshold, water content, algal biomass, granulometry and organic carbon for
Eden Estuary sites, with and without Enteromorpha. Mean ± Standard Error, with minimum and maximum values in parentheses.
Grid A: no Grid A: with Grid B: no Grid B: with
Enteromorpha Enteromorpha Enteromorpha Enteromorpha
Number of samples 106 53 65 25 Erosion Threshold 2.9 ± 0.2 (0.6 – 9.1) 2.3 ± 0.2 (0.1 – 5.9) 2.0 ± 0.2 (0.6 – 9.0) 2.1 ± 0.3 (0.6 – 6.2) (Nm-2) Water Content 34.2 ± 1.7 (11.5 – 93.5) 80.7 ± 2.4 (30.8 – 95.0) 42.2 ± 1.2 (25.4 – 67.3) 53.9 ± 4.1 (25.1 – 94.7) (%) Chlorophyll a 172.8 ± 17.4 (18.5 – 303.0) 456.5 ± 53.4 (19.5 – 2091.4) 79.8 ± 3.6 (27.0 – 151.0) 83.1 ± 10.2 (27.0 – 207.0) (mg m-2) Gravel (%) 3.0 ± 0.6 (0.0 – 31.5) 4.4 ± 1.1 (0.0 – 31.5) 0.8 ± 0.2 (0.0 – 8.2) 1.5 ± 0.4 (0.1 – 5.2) Coarse Sand (%) 1.2 ± 0.2 (0.0 – 8.6) 1.2 ± 0.2 (0.0 – 4.7) 0.2 ± 0.02 (0.0 – 1.0) 0.7 ± 0.2 (0.2 – 3.2) Medium Sand (%) 7.2 ± 0.5 (0.1 – 18.6) 6.6 ± 0.6 (0.1 – 18.2) 3.9 ± 0.4 (0.9 – 16.4) 12.3 ± 1.1 (4.0 – 23.2) Fine Sand (%) 78.4 ± 1.7 (0.2 – 98.3) 72.5 ± 2.2 (0.2 – 93.6) 69.1 ± 1.4 (41.8 – 83.5) 61.6 ± 3.6 (23.1 – 82.1) Silt-Clay (%) 8.4 ± 0.7 (0.1 – 37.3) 13.4 ± 1.0 (0.8 – 37.3) 26.0 ± 1.5 (12.9 – 55.8) 24.0 ± 4.2 (10.2 – 72.5) Organic Carbon (%) 5.7 ± 0.9 (0.4 – 65.7) 24.5 ± 1.5 (2.8 – 53.6) 3.6 ± 0.1 (1.9 – 5.4) 3.5 ± 0.3 (1.6 – 6.9) Minimum 187 ± 28 (7 – 2166) 636 ± 67 (12 – 1818) 140 ± 24 (7 – 960) 158 ± 31 (14 – 628) fluorescence
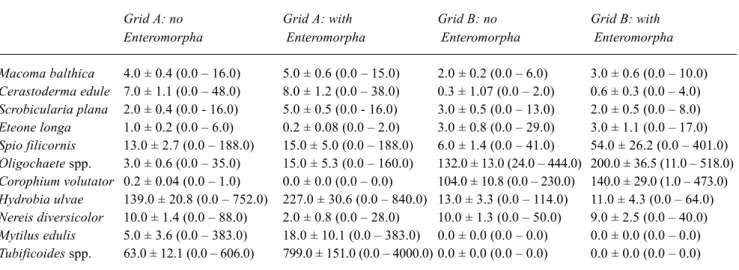
Table 1b. Descriptive statistics of dominant macrofaunal species for Eden Estuary sites, with and without Enteromorpha.
Mean ± Standard Error, with minimum and maximum values in parentheses (individuals 0.028 m-2).
Grid A: no Grid A: with Grid B: no Grid B: with
Enteromorpha Enteromorpha Enteromorpha Enteromorpha
Macoma balthica 4.0 ± 0.4 (0.0 – 16.0) 5.0 ± 0.6 (0.0 – 15.0) 2.0 ± 0.2 (0.0 – 6.0) 3.0 ± 0.6 (0.0 – 10.0) Cerastoderma edule 7.0 ± 1.1 (0.0 – 48.0) 8.0 ± 1.2 (0.0 – 38.0) 0.3 ± 1.07 (0.0 – 2.0) 0.6 ± 0.3 (0.0 – 4.0) Scrobicularia plana 2.0 ± 0.4 (0.0 - 16.0) 5.0 ± 0.5 (0.0 - 16.0) 3.0 ± 0.5 (0.0 – 13.0) 2.0 ± 0.5 (0.0 – 8.0) Eteone longa 1.0 ± 0.2 (0.0 – 6.0) 0.2 ± 0.08 (0.0 – 2.0) 3.0 ± 0.8 (0.0 – 29.0) 3.0 ± 1.1 (0.0 – 17.0) Spio filicornis 13.0 ± 2.7 (0.0 – 188.0) 15.0 ± 5.0 (0.0 – 188.0) 6.0 ± 1.4 (0.0 – 41.0) 54.0 ± 26.2 (0.0 – 401.0) Oligochaete spp. 3.0 ± 0.6 (0.0 – 35.0) 15.0 ± 5.3 (0.0 – 160.0) 132.0 ± 13.0 (24.0 – 444.0) 200.0 ± 36.5 (11.0 – 518.0) Corophium volutator 0.2 ± 0.04 (0.0 – 1.0) 0.0 ± 0.0 (0.0 – 0.0) 104.0 ± 10.8 (0.0 – 230.0) 140.0 ± 29.0 (1.0 – 473.0) Hydrobia ulvae 139.0 ± 20.8 (0.0 – 752.0) 227.0 ± 30.6 (0.0 – 840.0) 13.0 ± 3.3 (0.0 – 114.0) 11.0 ± 4.3 (0.0 – 64.0) Nereis diversicolor 10.0 ± 1.4 (0.0 – 88.0) 2.0 ± 0.8 (0.0 – 28.0) 10.0 ± 1.3 (0.0 – 50.0) 9.0 ± 2.5 (0.0 – 40.0) Mytilus edulis 5.0 ± 3.6 (0.0 – 383.0) 18.0 ± 10.1 (0.0 – 383.0) 0.0 ± 0.0 (0.0 – 0.0) 0.0 ± 0.0 (0.0 – 0.0) Tubificoides spp. 63.0 ± 12.1 (0.0 – 606.0) 799.0 ± 151.0 (0.0 – 4000.0) 0.0 ± 0.0 (0.0 – 0.0) 0.0 ± 0.0 (0.0 – 0.0)
On Grid A, the abundances of S. plana, H. ulvae and
Tubificoides spp. were significantly greater at Enteromorpha
sites, while the abundance of N. diversicolor was significantly lower (one-way ANOVA; P≤ 0.001). On Grid B, the abundances of S. filiformis and Oligochaete spp. were significantly greater at Enteromorpha sites (one-way ANOVA; P≤ 0.001) (Table 1b).
Stepwise multiple linear regressions were carried out on all data from the Eden Estuary. Three variables were found to be significant predictors of erosion threshold at the 1%
level: percentage gravel (a), abundance of N. diversicolor (b) and percentage silt-clay fraction (c) (r2 = 0.12; P < 0.001; S.E. = 1.50 Nm–2; y = 0.069a + 0.026b – 0.018c + 2.37). Since this was a poor predictive model, data were split according to site and whether Enteromorpha was present or absent (Table 2). The predictive model explaining the greatest amount of variation was for Grid B in the absence of Enteromorpha, with water content, chlorophyll-a concentration and abundance of M. balthica explaining 77% of the variation. Mean erosion thresholds were significantly
higher for sediments without Enteromorpha (Fig. 1; T-test; P = 0.013). This difference was also grid-specific, since the two types of site were significantly different for Grid A but not for Grid B (one-way ANOVA; P< 0.001).
Biezelingsche Ham mudflat
Step-wise multiple linear regressions were carried out on the data (excluding the dominant macrofaunal species), and minimum fluorescence was found to be a significant predictor of erosion threshold at the 1% level (r2 = 0.34; P < 0.014; S.E. = 0.71 Nm–2; y = 0.0026x + 0.61). When dominant macrofauna were included in the analysis, the abundance of C. volutator was a significant predictor of erosion threshold at the 1% level (r2 = 0.35; P < 0.013; S.E. = 0.71 Nm–2; y = –0.0048x + 1.63). C. volutator density and diatom biomass were inversely related at high erosion thresholds (Fig. 2).
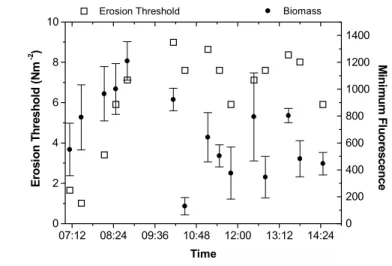
Over a tidal exposure period, both biological and physical processes controlled stability of a thick biofilm. At the beginning of the exposure period, surface stability was
Table 2. Results of stepwise multiple linear regressions on Eden Estuary data.
Variance Significance Standard Error Significant Predictors explained
Eden Estuary Grid A R = 0.45 P = 0.022 1.46 Nm-2 Y = –0.09a + 0.065b + 0.029c -0.0052d + 2.59
(All sites) Where a = Scrobicularia plana abundance,
b = % gravel, c = Nereis diversicolor abundance and d = Mytilus edulis abundance Eden Estuary Grid A R = 0.35 P = 0.006 1.60 Nm-2 Y = 0.09a + 0.031b + 2.40 Where a = % gravel
(Enteromorpha sites and b = Nereis diversicolor abundance
excluded)
Eden Estuary Grid A R = 0.67 P = 0.048 1.01Nm-2 Y = 0.11a – 0.59b – 0.85c – 0.026d +
(Enteromorpha sites 0.0007e + 4.33 Where a = % gravel, b = %
only) coarse sand, c = Eteone longa abundance, d =
water content and e = minimum fluorescence Eden Estuary Grid B R = 0.63 P = 0.041 1.13 Nm-2 Y = 0.014a + 0.0014b + 0.14c + 0.022d – 0.58
(All sites) Where a = chlorophyll-a concentration, b =
minimum fluorescence, c = Macoma balthica abundance and d = water content
Eden Estuary Grid B R = 0.77 P = 0.001 0.94 Nm-2 Y = 0.081a + 0.017b + 0.22c - 3.20 Where a =
(Enteromorpha sites water content, b = chlorophyll-a concentration
excluded) and c = Macoma balthica abundance
Eden Estuary Grid B R = 0.54 P = 0.005 1.21 Nm-2 Y = 0.133a + 0.47 Where a = % medium sand (Enteromorpha sites only) E ros io n Th re sh o ld ( N m -2 ) 0 2 4 6 8 Enteromorpha absent Enteromorpha present
Fig. 1. Erosion thresholds (Nm-2) for sediments in the presence and
absence of an Enteromorpha spp. bloom. The boundary of the box closest to zero indicates the 25th percentile, a line within the box marks the median, and the boundary of the box farthest from zero indicates the 75th percentile. Whiskers above and below the box indicate the 90th and 10th percentiles. Black circles represent the 5th
unstable (<2 Nm–2) and surface biomass was low. For 1.5 hours after the tidal emersion, surface stability and biomass increased at similar rates. This was followed by a decrease in stability and biomass, although the rate of decrease for stability was less than the rate of decrease for surface biomass (Fig. 3a). During the exposure period, water content gradually decreased whilst colloidal carbohydrate increased (Fig. 3b).
Zandkreek mudflat
Step-wise multiple linear regressions were applied to the Zandkreek data set. In the absence of macrofaunal abundance data, erosion threshold was not predicted significantly by grain size, algal biomass or water content. When macrofaunal abundance was included, the abundance of A. marina was a significant predictor of erosion threshold at the 1% level (r2 = 0.14; P = 0.039; S.E. = 0.88 Nm–2; y = –0.14x + 1.33). Increasing abundance of A. marina had a negative effect on sediment stability, although all measured stabilities were below 2 Nm–2, indicating that all the sediments were ‘unstable’ according to the criteria used in this study (Fig. 4).
Molenplaat mudflat
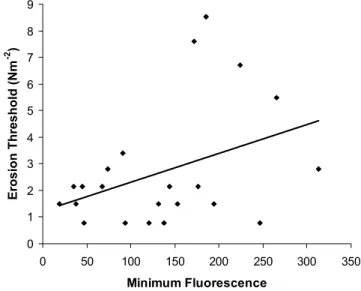
Step-wise multiple linear regressions were applied to the Molenplaat data set. Minimum fluorescence was a significant predictor of erosion threshold at the 1% level (r2= 0.27; P = 0.011; S.E. = 2.15 Nm–2; y = 0.0063x + 1.81) (Fig. 5).
Complete data set
Step-wise multiple linear regressions were applied to the complete data set. Seven variables were found to be significant predictors of erosion threshold at the 1% level: percentage fine sand(a), percentage gravel (b), N.
diversicolor(c), M. balthica(d), minimum fluorescence (e), water content (f)and C. edule(g) (r2 = 0.19; P < 0.001; S.E. = 1.51 Nm–2; y = 0.013a + 0.072b + 0.027c + 0.009d+ 0.001e – 0.013f – 0.022g + 1.48). However, these seven variables described less than half the total variation in the data, highlighting that certain site-specific features (such as Fig. 2. Diatom biomass and Corophium volutator density at the
Biezelingsche Ham site were inversely correlated at high erosion thresholds, with opposing effects on sediment stability. Solid line represents minimum fluorescence (r2 = 0.31; y = 129.07x + 47.96)
and dashed line represents C. volutator density (r2 = 0.29; y =
-64.26x + 177.43). 0 1 2 3 4 0 200 400 600 800 Erosion Threshold (Nm-2 ) M ini m u m Fl uo re sce nce Biomass 0 50 100 150 200 250 300 C o rophi um v o lu ta to r ( indi vi d u al s 0. 028 m -2 ) C. volutator
Fig. 3a. Erosion threshold and sediment surface biomass measured at regular intervals during a tidal emersion period on the Biezelingsche Ham mudflat. Erosion threshold (n = 1) at each time interval matched with minimum fluorescence measurements (n = 3).
Fig. 3b. Water content (%) and colloidal carbohydrate (µg glucose eq. g-1 dry sediment) measured at regular intervals during a tidal
emersion period on the Biezelingsche Ham mudflat (n = 1 at each time interval). Solid line represents water content (r2 = 0.65; y =
-35.49x + 86.53) and dashed line represents colloidal carbohydrate (r2 = 0.13; y = 886.57x + 396.75). 07:12 08:24 09:36 10:48 12:00 13:12 14:24 0 2 4 6 8 10 Time E ros io n T h re sh old ( N m -2 ) Erosion Threshold 0 200 400 600 800 1000 1200 1400 M in im u m F lu o res cen ce Biomass 07:12 08:24 09:36 10:48 12:00 13:12 14:24 60 65 70 75 80 Time % W at er C o nt en t Water content 400 600 800 1000 1200 1400 C oll oid al C ar b ohy dr ate (u g gl u co se e q. g -1 dr y s edi m en t) Colloidal carbohydrate
Enteromorpha beds, migratory biofilms and dominant
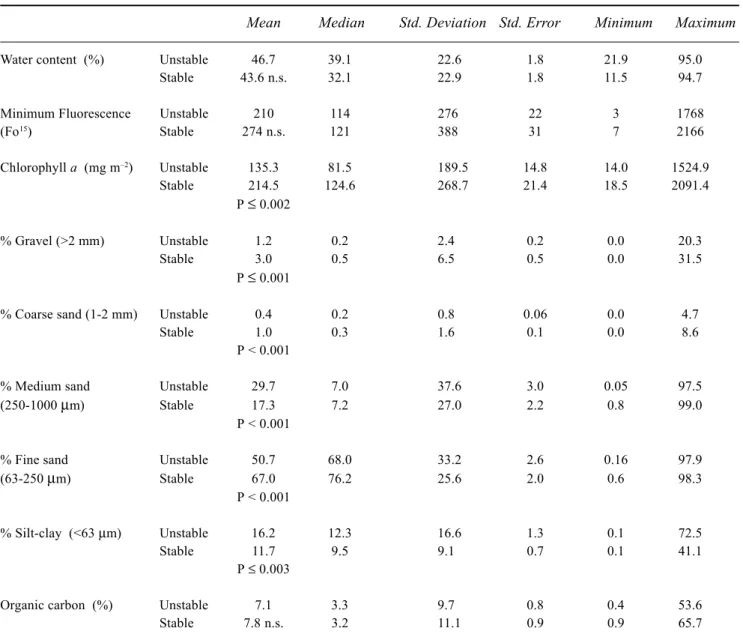
macrofauna) may be having an influential role and need to be investigated more closely. Data from all sites were pooled, and ‘stable’ (erosion threshold >2 Nm–2)and ‘unstable’ sediments (erosion threshold <2 Nm–2) were compared. Mean chlorophyll-a concentration was significantly higher for stable sediments. Mean percent of gravel, coarse sand and fine sand were significantly higher in stable sediments, whilst the mean percent of medium sand and silt-clay fraction were significantly lower for stable sediments.
Discussion
The results of this study, in which multiple variables were measured in conjunction with sediment stability, highlight the complexity of the factors controlling the stability of intertidal sediments. For example, the presence of
Enteromorpha had a major influence on both the biological
(species present) and physical (water content) properties of the sediment bed. However, few studies have investigated these effects (Bolam et al., 2000). Sediment stability of the Eden Grid A was significantly lower under the
Enteromorpha bloom. Since the mat on Grid A was much
thicker, and covered a larger area than the mat on Grid B, it may have different ecological effects compared with the smaller, spatially heterogeneous mat (Bolam et al., 2000). In agreement with the results of Bolam et al. (2000), water content, organic carbon content and silt-clay fraction increased significantly in the sediments under Enteromorpha on Grid A (Table 1a). The stability of sediment without a biofilm would be expected to decrease with increasing water content, as found when mats of Enteromorpha were lifted away from the sediment surface, revealing pools of surface water. This suggests that the sediment below the mat had a highly mobile unconsolidated surface floc layer, which was disturbed when the mat was lifted away for sediment stability measurements. This undoubtedly caused a reduction in the measured erosion threshold, and may have accounted for the observed differences. The overall effect of an
Enteromorpha bloom on sediment transport is complex since Enteromorpha will act to retard water flow, reduce
near-bed shear stress and, thus, will trap fine-grained material (Paterson and Black, 2000). The protection afforded by the mat means that these areas are more likely to be depositional than erosional, highlighting the importance of considering data within the context of such settings.
Different macrofaunal assemblages are known to affect sediment stability in different ways (Meadows et al., 1990; Blanchard et al., 1997; Meadows et al., 1998; Widdows et
al., 1998b, 2000; Willows et al., 1998; Austin et al., 1999;
Riethmüller et al., 2000; Andersen, 2001; de Deckere et
al., 2001). For example, on Eden Grid A, N. diversicolor
had a net positive association with sediment stability, possibly due to the secretions produced during burrow formation and increased drainage of the sediment. However, on the Zandkreek mudflat, A. marina (also a polychaete worm) had a net negative effect on sediment stability. This may have been due to bioturbation effects such as a change in the particle size composition and an increase in the water content, or grazing pressure reducing the number of diatoms and consequently the EPS production (de Deckere et al., 2001). The presence of macroalgal mats impact significantly Fig. 4. Erosion threshold (Nm-2) decreases with increasing
abundance of Arenicola marina (individuals 0.028m-2) on the
Zandkreek mudflat (r2 = 0.16; y = 0.047x + 0.88).
Fig. 5. Erosion threshold (Nm-2) increases with increasing sediment
surface diatom biomass described by minimum fluorescence on the Molenplaat (r2 = 0.15; y = 0.011x + 1.23). 0 2 4 6 8 10 0.2 0.4 0.6 0.8 1.0 1.2 1.4 E rosi on T h res hol d (N m -2 )
Abundance of Arenicola marina (individuals 0.028m-2)
0 1 2 3 4 5 6 7 8 9 0 50 100 150 200 250 300 350 Minimum Fluorescence Erosion Threshold (Nm -2 )
on the invertebrate assemblages, causing declines in some species and increases in others (Hull, 1987; Raffaelli et al., 1991; Everett, 1994; Raffaelli et al., 1998; Bolam et al., 2000; Raffaelli, 2000). A change in macrofaunal assemblage structure may affect sediment stability, due to a change in bioturbatory/feeding behaviour and/or mode of living. On Eden Grid A, the abundance of N. diversicolor decreased under Enteromorpha mats, whilst the abundance of H. ulvae increased (Table 2b). H. ulvae can reduce stability by reducing cohesiveness through faecal pelletisation, and by moving through the surface sediment (Blanchard et al., 1997; Austin et al., 1999).
At Biezelingsche Ham, C. volutator reduced sediment stability by grazing on diatom biomass and via bioturbation; however, stability may also have been enhanced due to the mucus-lined burrows and increased drainage (Meadows et
al., 1990). As diatom biomass and C. volutator density are
inversely related, it is likely that sediment stability of a
Corophium-dominated site will lie along a continuum, with
areas of high stability having high diatom biomass and a low density of C. volutator, and easily eroded areas having low diatom biomass and a high density of C. volutator (Fig. 2). Site-specific features, such as migratory bird populations may influence sediment stability by altering the stable state of the system. For example, Daborn et al. (1993) documented an ecological cascade effect, where migratory birds preyed upon C. volutator, reducing their density and altering their behaviour, which allowed a diatom biofilm to develop and the stability of the sediment to increase significantly.
Matched measurements taken on a diatom biofilm at Biezelingsche Ham provided an excellent example of the complex, and in this case synergistic, interactions between physical and biological processes. Initially upon exposure, biological processes were the predominant influence on sediment stability, which increased with increasing surface diatom biomass. This phenomenon has been described previously by Paterson (1989) although a greater time lag between diatoms appearing at the sediment surface and increased sediment stability was found in the present field study. After diatoms migrated away from the sediment surface (probably as a result of a tidal rhythm; Serôdio et
al., 2001) and for the remainder of the emersion period,
sediment stability decreased slightly, but remained high. This was probably due to the additive effects of the sediment becoming more consolidated and compacted as the water content of the sediment decreased, and also due to the residual EPS pool on the sediment surface. A reduction in water content during the exposure period may result in an increased secretion of EPS by the diatoms to prevent desiccation (Decho, 1990; Hoagland et al., 1993) or
migration; such feedbacks may alter relationships (i.e. from linear to non-linear) and increase the scatter in the data.
The presence of a biofilm can have implications for studies that employ a unified erosion formula which predicts increasing sediment stability with depth, related to increased sediment density (e.g. Sanford and Maa, 2001). These studies still fail to recognise the importance of the spatial scale of biological effects. For example, biofilms result in an inversion in the stability/density relationship, with highly stable low-density sediments at the surface and denser, less stable sediments below the surface. Even over a tidal cycle, diatom migration can alter, significantly, the density-depth stability relationship of the surface few millimetres (e.g. Hay
et al., 1993). If a site has a highly migratory biofilm (such
as Biezelingsche Ham mudflat), then variations found along a grid or transect could be the result of migratory behaviour linked to the time of day and/or tidal cycle. Surface diatom biomass was found to be a significant predictor of erosion threshold for the Molenplaat, although the relationship was weak. This could have been due to the different mud and sand sedimentation patterns across the flat (Herman et al., 2001).
The nature of the sediment, microphytobenthic biomass and the sediment water content have traditionally been considered the primary controls of stability on cohesive sediments, and all were found to be significant predictors in the model that incorporated all the data. The fact that a significant predictive relationship for use on all study sites was not possible, could be due to the complex interaction of factors, particularly local features such as migratory biofilms and Enteromorpha blooms, together with temporal and spatial variation.
It has become obvious that there is large scatter in the data on factors that control sediment stability. However, effective models still require a ‘minimum’ parameter sub-set of the factors responsible for controlling sediment stability (EstProc, 2002). Table 3 provides a preliminary attempt at this, comparing ‘stable’ and ‘unstable’ sediments. Whilst the mean values of sediment granulometry and chlorophyll-a concentration were significantly different between the two groups, the large range in values will increase the difficulty of producing a definitive model.
The results presented here reinforce those of Mitchener and Torfs (1996) who highlighted that there are major gaps in understanding the stability and thus sediment transport of mixed cohesive and non-cohesive sediments. Seasonal deposition cycles on intertidal flats are likely to be site-specific and may be a significant factor in the mud balance of an estuary (Herman et al., 2001). This is likely to be a factor on the Molenplaat, and future models will need to incorporate a seasonality factor.
Table 3. Descriptive statistics for the combined data set (i.e. all sites) of water content, microalgal biomass, granulometry
and organic carbon of ‘stable’ (>2 Nm-2; n = 158) and ‘unstable’ (<2 Nm-2; n = 163) sediments. Mean values compared using the t-test; n.s. defined as not significant.
Mean Median Std. Deviation Std. Error Minimum Maximum
Water content (%) Unstable 46.7 39.1 22.6 1.8 21.9 95.0
Stable 43.6 n.s. 32.1 22.9 1.8 11.5 94.7
Minimum Fluorescence Unstable 210 114 276 22 3 1768
(Fo15) Stable 274 n.s. 121 388 31 7 2166 Chlorophyll a (mg m–2) Unstable 135.3 81.5 189.5 14.8 14.0 1524.9 Stable 214.5 124.6 268.7 21.4 18.5 2091.4 P ≤ 0.002 % Gravel (>2 mm) Unstable 1.2 0.2 2.4 0.2 0.0 20.3 Stable 3.0 0.5 6.5 0.5 0.0 31.5 P ≤ 0.001
% Coarse sand (1-2 mm) Unstable 0.4 0.2 0.8 0.06 0.0 4.7
Stable 1.0 0.3 1.6 0.1 0.0 8.6
P < 0.001
% Medium sand Unstable 29.7 7.0 37.6 3.0 0.05 97.5
(250-1000 µm) Stable 17.3 7.2 27.0 2.2 0.8 99.0
P < 0.001
% Fine sand Unstable 50.7 68.0 33.2 2.6 0.16 97.9
(63-250 µm) Stable 67.0 76.2 25.6 2.0 0.6 98.3
P < 0.001
% Silt-clay (<63 µm) Unstable 16.2 12.3 16.6 1.3 0.1 72.5
Stable 11.7 9.5 9.1 0.7 0.1 41.1
P ≤ 0.003
Organic carbon (%) Unstable 7.1 3.3 9.7 0.8 0.4 53.6
Stable 7.8 n.s. 3.2 11.1 0.9 0.9 65.7
Experimental studies provide only a snapshot of the ecosystem, so that significant weather events (e.g. storms) and longer-term seasonal changes that influence the current state of the ecosystem are often overlooked. Spatial and temporal variation is an intrinsic part of the estuarine environment and it is important, therefore, that this is reflected in measurement programmes. If components are measured inappropriately, then relationships or effects may be weakened, masked or may even disappear. However, it is possible that the relationships that govern sediment stability are too complex to be modelled easily in the current state of knowledge.
Conclusions
Since the living and abiotic elements vary temporally and spatially, it is not surprising that the functions and importance of these various factors in determining sediment stability also vary, resulting in apparently idiosyncratic relationships. Whilst some factors will be similar between estuaries, this research highlights the need for site-specific calibration of models, and suggests that a universal proxy parameter for sediment stability is unlikely to be obtained. The sediment stability of all the sites in this investigation was controlled by different forcing variables, and appeared to be associated with the seasonal influence and difference in local features. The challenge now is to bridge the gap
between understanding of the fine scale and the larger scale properties and processes to produce system-wide models.
Acknowledgments
Thanks go to Derek Casey and Alan Whitaker for grain size analysis and macrofaunal counts, Claire Honeywill and NIOO for minimum fluorescence data, and Irvine Davidson and Scot Hagerthey for chlorophyll analysis. BIOPTIS and CLIMEROD were European Union projects (EU MAS3-CT97-0158; EU MAS3-CT98-0166). Funding for E.Defew was supported by NERC (GT/04/99/MS/269). T. Tolhurst received additional support during writing from the Commonwealth Special Research Centre for the Ecological Impacts of Coastal Cities.
References
Andersen, T.J., 2001. Seasonal variability in erodibility of two temperate, microtidal mudflats. Estuar. Coast. Shelf Sci., 53, 1–12. Austin, I., Andersen, T.J. and Edelvang, K., 1999. The influence of benthic diatoms and invertebrates on the erodibility of an intertidal mudflat, the Danish Wadden Sea. Estuar. Coast. Shelf Sci., 49, 99–111.
Barranguet, C., Herman, P.J. and Sinke, J.J., 1997. Microphytobenthos biomass and community composition studied by pigment biomarkers: importance and fate in the carbon cycle of a tidal flat. J. Sea Res., 38, 59–70.
Barranguet, C. and Kromkamp, J., 2000. Estimating primary production rates from photosynthetic electron transport in estuarine microphytobenthos. Mar. Ecol. Prog. Ser., 204, 39– 54.
Black, K.S., Tolhurst, T.J., Hagerthey, S.E. and Paterson, D.M., 2002. Working with Natural Cohesive Sediments. J. Hydraul. Eng, 128, 1–7.
Blanchard, G.F., Sauriau, P-G., Variou-Le Gall, V., Gouleau, D., Garet, M-J. and Oliver F., 1997. Kinetics of tidal resuspension of microbiota: testing the effects of sediment cohesiveness and bioturbation using flume experiments. Mar. Ecol. Prog. Ser., 151, 17–25.
Bolam, S.G., Fernandes, T.F., Read, P. and Raffaelli, D., 2000. Effects of macroalgal mats on intertidal sandflats: an experimental study. J. Exp. Mar. Biol. Ecol., 249, 123–137. Bryant, E., 1997. Climate Process and Change. Cambridge
University Press, 209pp.
Buchanan, J.B. and Kain, J.M., 1971. Measurement of the Physical and Chemical Environment. In: Methods for the study of Marine Benthos, N.A. Holmes and A.D. MacIntyre (Eds.). Blackwell Scientific Publications, Oxford.
Daborn, G.R., Amos, C.L., Brylinsky, M. and Christian, H., 1993. An ecological cascade effect: Migratory birds affect stability of intertidal sediments. Limnol. Oceanogr., 34, 225–231. Dade, W.B., Nowell, A.R.M. and Jumars, P.A., 1992. Predicting
erosion resistance of muds. Mar. Geol., 105, 285–297. de Brouwer, J.F.C., Bjelic, S., de Deckere, E.M.G.T. and Stal,
L.J., 2000. Interplay between biology and Sedimentology in a mudflat (Biezelingsche Ham, Westerschelde, The Netherlands). Cont. Shelf Res., 20, 1159–1177.
de Deckere, E.M.G.T., Tolhurst, T.J. and de Brouwer, J.F.C., 2001. Destabilisation of cohesive intertidal sediments by infauna. Est. Coast. Shelf Sci., 53, 665–669.
Decho, A., 1990. Microbial exoploymer secretions in ocean environments: their role(s) in food webs and marine processes. Oceanography and Marine Biology Annual Review 28, 73–153. Defew, E.C., Tolhurst, T.J., Paterson, D.M. and Hagerthey, S.E., (In press). Can the stability of intertidal mudflats be predicted from proxy parameters? An in situ investigation. Estuarine Coastal Sciences Association.
Dubois, M., Giles, K.A., Hamilton, J.K., Reber, P.A. and Smith, F., 1956. Colorimetric method for determination of sugars and related substances. Anal. Chem., 28, 350–356.
Everett, R.A., 1994. Macroalgae in soft-sediment communities: Effects on benthic faunal assemblages. J. Exp. Mar. Biol. Ecol., 175, 253–274.
EstProc., 2002. Estuary Process Research Group Inception Report. DEFRA Project FD 1905.
Gerdol, V. and Hughes, R.G., 1994. Effect of Corophium volutator on the abundance of benthic diatoms, bacteria and sediment stability in two estuaries in southeastern England. Mar. Ecol. Prog. Ser., 114, 109–115.
Hakvoort, J.H.M., Heineke, M., Heymann, K., Kühl, H., Riethmüller, R. and Witte, G., 1998. A basis for mapping the erodibility of tidal flats by optical remote sensing. Mar. Freshwater Res., 49, 867–873.
Hay, S.I., Maitland, T.C. and Paterson, D.M., 1993. The speed of diatom migration through natural and artificial substrata. Diatom Res., 8, 371–384.
Herman, P.M.J., Middelburg, J.J. and Heip, C.H.R., 2001. Benthic community structure and sediment processes on an intertidal flat: results from the ECOFLAT project. Cont. Shelf Res., 21, 2055–2071.
Hoagland, K.D, Rosowski, J.R., Gretz, M.R. and Roemer, S.C., 1993. Diatom extracellular polymeric substances: Function, fine structure, chemistry and physiology. J. Phycol., 29, 537–556. Honeywill, C., Paterson, D.M. and Hagerthey, S.E., 2002. Instant
determination of microphytobenthic biomass using fluorescence. Eur. J. Phycol., 37, 1–8.
Hull, S.C., 1987. Macroalgal mats and species abundance: a field experiment. Estuar. Coast. Shelf Sci., 25, 519–532.
Lucas, C.H. and Holligan, P.M., 1999. Nature and ecological implications of algal pigment diversity on the Molenplaat tidal flat (Westerschelde Estuary, SW Netherlands). Mar. Ecol. Prog. Ser., 180, 51–64.
Meadows, P.S., Tait, J. and Hussain, S.A., 1990. Effects of estuarine infauna on sediment stability and particle sedimentation. Hydrobiologia 190, 263–266.
Meadows, P.S., Meadows, A., West, F.J.C., Shand, P.S. and Shaikh, M.A., 1998. Mussels and mussel beds (Mytilus edulis) as stabilisers of sedimentary environments in the intertidal zone. In: Sedimentary Processes in the Intertidal Zone, K.S. Black, D.M. Paterson and A. Cramp, A. (Eds.), Geological Society, London, Spec. Publ.139, 331–347.
Mitchener, H. and Torfs, H., 1996. Erosion of mud/sand mixtures. Coast. Eng., 29, 1–25.
Mouritsen, K.M., Mouritsen, L.T. and Jensen, K.T., 1998. Change of topography and sediment characteristics on an intertidal mudflat following mass mortality of the Amphipod Corophium volutator. J Mar. Biol. Ass. UK., 78, 1167–1180.
Paterson, D.M., 1989. Short-term changes in the erodibility of intertidal cohesive sediments related to the migratory behaviour of epipelic diatoms. Limnol. Oceanogr., 34, 223–234. Paterson, D.M. and Black, K.S., 1999. Water flow, sediment
dynamics, and benthic biology. In: Advances in Ecological Research, D. Raffaelii and D. Nedwell (Eds.). Oxford Univerity Press. 155–193.
Paterson, D.M., Tolhurst, T.J., Kelly, J.A., Honeywill, C., de Deckere, E.M.G.T., Huet, V., Shayler, S.A., Black., K.S., de Brouwer, J. and Davidson, I., 2000. Variations in sediment properties, Skeffling mudflat, Humber Estuary, UK. Cont. Shelf Res. 20, 1373–1396.
Pew Centre on Global Climate Change. www.pewclimate.org/ projects/marine.cfm
Raffaelli, D., 2000. Interactions between macro-algal mats and invertebrates in the Ythan Estuary, Aberdeenshire, Scotland. Helgo. Mar. Res., 54, 71–79.
Raffaelli, D., Limia, J., Hull, S.C. and Pont, L., 1991. Interactions between the amphipod Corophium volutator and macroalgal mats on estuarine mudflats. J. Mar. Biol. Ass. UK, 71, 899– 908.
Raffaelli, D., Raven, J.A. and Poole, L.J., 1998. Ecological impacts of green macroalgal blooms. Ann. Rev. Oceanogr. Mar. Biol., 36, 97–125.
Riethmüller, R., Hakvoort, J.H.M., Heineke, M., Heymann, K., Kühl, H. and Witte, G., 1998. Relating erosion threshold to tidal flat surface colour. In: Sedimentary Processes in the Intertidal Zone, K.S. Black, D.M. Paterson and A. Cramp (Eds.). Geol. Soc., London, Spec. Publ., 139, 283–293.
Riethmüller, R., Heineke, M., Kühl, H. and Keuker-Rüdiger, R., 2000. Chlorophyll a concentration as an index of sediment surface stabilisation by microphytobenthos? Cont. Shelf Res., 20, 1351–1372.
Sabbe, K., 1993. Short-term fluctuations in benthic diatom numbers on an intertidal sandflat in the Westerschelde Estuary (Zeeland, The Netherlands). Hydrobiologia 269/270, 275–284. Sabbe, K. and Vyverman, W., 1991. Distribution of benthic diatom assemblages in the Westerschelde (Zeeland, The Netherlands). Bel. J. Bot., 124, 91–101.
Sanford, L.P. and Maa, J.P-Y., 2001. A unified erosion formulation for fine sediments. Mar. Geol., 179, 9–23.
Serôdio, J., da Silva, J.M. and Catarino, F., 1997. Nondestructive tracing of migratory rhythms of intertidal benthic migroalgae using in vivo chlorophyll a fluorescence. J. Phycol., 33, 542– 553.
Serôdio, J., Catarino, F. and da Silva, J.M., 2001. Use of in vivo chlorophyll a fluorescence to quantify short-term variations in the productive biomass of intertidal microphytobenthos. Mar. Ecol. Prog. Ser., 218, 45–61.
Taylor, I.S., 1998. Fine scale distribution of carbohydrates on intertidal sediments in relation to diatom biomass and sediment properties. Unpub. Ph.D. Thesis, University of St Andrews.
Tolhurst, T.J., Black, K.S., Shayler, S.A., Mather, S., Black, I., Baker, K. and Paterson,D.M., 1999. Measuring the in situ erosion threshold of intertidal sediments with the Cohesive Strength Meter (CSM). Estuar. Coast. Shelf Sci., 49, 281–294. Tolhurst, T.J., Gust, G., and Paterson, D.M., 2002. The influence of an extracellularpolymeric substance (EPS) on cohesive sediment stabiltity. Proc. of INTERCOH 2000, In press. Underwood, G.J.C. and Paterson D.M., 1993. Seasonal changes
in diatom biomass, sediment stability and biogenic stabilisation in the Severn Estuary. J. Mar. Biol. Ass. UK., 73, 871–887. Underwood, G.J.C., Paterson, D.M. and Parkes, R.J., 1995. The
measurement of microbial carbohydrate exopolymers from intertidal sediments. Limnol Oceanogr., 40, 1243–1253. Widdows, J., Brinsley, M.D., Salkeld, P.N. and Elliott, M., 1998a.
Use of annular flumes to determine the influence of current velocity and bivalves on material flux at the sediment-water interface. Estuaries 21, 552–559.
Widdows, J., Brinsley, M.D. and Elliott, M., 1998b. Use of in situ flume to quantify particle flux (deposition rates and sediment erosion) for an intertidal mudflat in relation to changes in current velocity and benthic macrofauna. In: Sedimentary Processes in the Intertidal Zone, K.S. Black,D.M. Paterson and A. Cramp, (Eds.). Geol. Soc. London, Spec. Publ., 139, 85–97.
Widdows, J., Brinsley, M.D., Bowley, N. and Barrett, C., 1998c. A benthic annular flume for in situ measurement of suspension feeding/biodeposition rates and erosion potential of intertidal cohesive sediments. Estuar. Coast. Shelf Sci., 46, 2–38. Widdows, J., Brinsley, M.D., Salkeld, P.N. and Lucas, C.H., 2000.
Influence of biota on spatial and temporal variation in sediment erodibility and material flux on a tidal flat (Westerschelde, The Netherlands). Mar. Ecol. Prog. Ser., 194, 23–37.
Willows, R.I., Widdows, J. and Wood, R.G., 1998. Influence of an infaunal bivalve on the erosion of intertidal cohesive sediment: a flume and modelling study. Limnol. Oceanogr. 43, 1332–1343.
Wiltshire, K.H., Tolhurst, T., Paterson, D.M., Davidson, I. and Gust, G., 1998. Pigment fingerprints as markers of erosion. In: Sedimentary Processes in the Intertidal Zone, K.S. Black,D.M. Paterson and A. Cramp, (Eds.). Geol. Soc. London, Spec. Publ., 139, 99–114.
Zar, J.H., 1999. Biostatistical analysis. (4th Edition). Prentice Hall, New Jersey.