HAL Id: hal-02991490
https://hal.archives-ouvertes.fr/hal-02991490
Submitted on 6 Nov 2020
HAL is a multi-disciplinary open access archive for the deposit and dissemination of sci-entific research documents, whether they are pub-lished or not. The documents may come from teaching and research institutions in France or abroad, or from public or private research centers.
L’archive ouverte pluridisciplinaire HAL, est destinée au dépôt et à la diffusion de documents scientifiques de niveau recherche, publiés ou non, émanant des établissements d’enseignement et de recherche français ou étrangers, des laboratoires publics ou privés.
Transfer from Pyranine to Water Studied by
Femtosecond Transient Absorption
Pascale Changenet, Thomas Gustavsson, Isabelle Lampre
To cite this version:
Pascale Changenet, Thomas Gustavsson, Isabelle Lampre. Introduction to Femtochemistry: Excited-State Proton Transfer from Pyranine to Water Studied by Femtosecond Transient Absorption. Journal of Chemical Education, American Chemical Society, Division of Chemical Education, 2020, 97 (12), pp.4482-4489. �10.1021/acs.jchemed.0c01056�. �hal-02991490�
Introduction to Femtochemistry: Excited State Proton
Transfer from Pyranine to Water Studied by
Femtosecond Transient Absorption
Pascale Changenet§*, Thomas Gustavsson†, Isabelle Lampre‡§Laboratoire d’Optique et Biosciences, CNRS-INSERM-Ecole Polytechnique, Institut
5
Polytechnique de Paris, 91128 Palaiseau, cedex, France
†Université Paris-Saclay, CEA-CNRS, Laboratoire Interactions, Dynamiques et Lasers,
ERL 9000, 91191 Gif sur Yvette, cedex, France
‡Université Paris-Saclay, CNRS, Institut de Chimie Physique, UMR 8000, 91400 Orsay,
France 10
ABSTRACT
In order to introduce students to the fascinating field of femtochemistry, we propose here a practical laboratory training course conceived for second-year master students in chemistry. We describe the use of a broadband femtosecond transient absorption
(pump-probe) experiment for monitoring a fast light-triggered chemical reaction in 15
solution. The experiments are performed on the pyranine photoacid, which upon photoexcitation at 390 nm undergoes a proton transfer to the solvent in about 90 ps. While this practical course involves advanced equipment and techniques, the measured transient absorption data allow easy analysis and interpretation. The transient
absorption spectra at a few selected delay times can be analyzed qualitatively in terms 20
of bleach, induced absorption and stimulated emission. Likewise, the transient absorption signals at a few chosen wavelengths can be quantitatively analyzed and explained with simple kinetic models to determine the time constant of the proton transfer reaction. This training aims at giving the students the opportunity to face some of the current challenges in contemporary chemistry by learning the basics of ultrafast 25
GRAPHICAL ABSTRACT
KEYWORDS
30
Graduate Education/Research, Physical Chemistry, Photochemistry, UV-vis spectroscopy, Kinetics, lasers, pH, reaction, Proton transfer
INTRODUCTION
The formation or the breaking of chemical bonds, electron or proton transfers within 35
or between molecules are elementary chemical reactions that can be extremely fast. Their precise characterization is crucial to address fundamental questions in chemistry and biology. Using light to probe such mechanisms has proven an outstanding means to this end and photophysics, photochemistry and photobiology are today
well-established fields by their own.1, 2 In this regard, pump-probe methods are powerful
40
techniques for measuring the formation of short-lived reaction intermediates produced from an optical excitation. The basic principle of these methods is to use a strong optical “pump” pulse to trigger a photoinduced reaction in the studied medium and a weak “probe” light to monitor the pump-induced change.3-5 These techniques emerged
in the middle of the twentieth century with the development of flash photolysis 45
experiments by Eigen, Norrish and Porter (Nobel Prize 1967) for the study of electronic triplet states and free radicals.6 Flash photolysis originally used powerful flash lamps
for the sample excitation and continuous light source as the probe, providing a time resolution of about one microsecond. The time resolution of such experiments depends
Dt Pump Probe Pyranine OH SO3 O3S O3S Na+ Na+ Na+ Spectrograph Transient absorbance
mainly on the pump pulse duration and the electronics of the probe detection. 50
Therefore, by using pulsed laser excitation, nanosecond time resolution can easily be obtained.4 In order to reach (sub-)picosecond resolution and to overcome the limits
imposed by the detector response, purely optical pump-probe techniques using two short laser pulses generated from the same laser source were developed towards the end of the twentieth century. The successful application of these techniques to the 55
studies of molecular dynamics opened the field of Femtochemistry (A. H. Zewail, Nobel Prize 1998, see ref. 5 and references therein). With these techniques, the time
characteristics of the electronics used for the detection of the probe pulse intensity has no consequence. The time-resolution is only limited by the temporal overlap of the probe and pump pulses and the time-scale is defined by introducing an optical delay 60
between the pump and the probe pulses. This is described more in detail below. To introduce students to ultrafast spectroscopy, the third semester of the SERP+
master's program at the Paris-Saclay University
(http://www.master-serp.eu/programme/) offers an overview of the various optical techniques used for the study of photoinduced reactivity of molecules and molecular assemblies at short time 65
scales (from femtoseconds to nanoseconds). In order to initiate students to the state-of-the-art instrumentation now widely used in physical chemistry laboratories, we have developed a half-day laboratory training devoted to the use of femtosecond transient absorption for the study of an excited-state proton transfer (ESPT) reaction in aqueous solution. To this end, we use pyranine (also known as trisodium 8-hydroxy-pyrene 70
1,3,6-trisulfonate, HPTS), a well-known photoacid commonly used as pH indicator in biology.7, 8 Pyranine is also a coloring agent widely used for drugs, cosmetics and inks
due to its strong yellow-green fluorescence.9 It exhibits a strong absorption around
400 nm, in the spectral region of the second harmonic of femtosecond titanium sapphire lasers, making this compound particularly well suited for femtosecond 75
spectroscopy. Several time-resolved studies of pyranine in aqueous solution using different experimental approaches have provided evidence that ESPT from the photoacid to the solvent occurs with a time constant of ca. 90 ps.10-15 The present training
consists of the experimental observation of the formation of the deprotonated form of pyranine by broadband femtosecond transient absorption spectroscopy. This training 80
which has been carried out in a research laboratory on a routine basis for several years, aims to (i) consolidate the knowledge acquired during the physical chemistry
coursework, (ii) perform a quantitative and critical analysis of experimental data and (iii) learn how to write a scientific report in the form of a scientific article. This training introduces the students to some of the challenges of modern chemistry by both
85
teaching them the concepts and the applications of ultrafast spectroscopy. These important issues are rarely addressed together in the teaching of masters of
chemistry.16 In the following, we present the principle and the practical details of the
experiment on pyranine, the interpretation of the observations and a simple kinetic analysis of the results. These elements constitute a protocol that can be adapted in any 90
laboratory equipped for UV-visible time-resolved laser spectroscopy.
BACKGROUND
Basics of UV-visible femtosecond transient absorption spectroscopy
Transient absorption spectroscopy measures the change in the absorbance of a 95
sample following photo-excitation by a short light flash or laser pulse at time t = 0. The differential absorbance before and after photo-excitation, DA(l,t), at wavelength l and time t is usually defined as:
ΔA(λ, t) = A(λ, t) − A!(λ) (1)
with A(l,t) being the sample absorbance at time t after the photo-excitation and A0(l)
100
steady-state absorbance of the sample that can be measured with a classical spectrophotometer.
According to the timescale of the induced processes to study, two main techniques are available: flash photolysis spectrometers for nanoseconds to milliseconds time range 105
and ultrafast pump-probe laser set-ups for femtoseconds to nanoseconds time range. Flash photolysis systems are nowadays simple to handle and affordable. Indeed, several experiments have already been proposed for training purposes in a physical chemistry laboratory.17-20 For the femto- and picosecond time scales, “pump-probe” laser
techniques are required. For this purpose, amplified self-mode locked pulsed titanium 110
sapphire lasers are currently the most widely used technology, typically providing 50-100 fs pulses at kHz repetition rates, with a wavelength around 800 nm and a pulse energy of a few millijoules.21
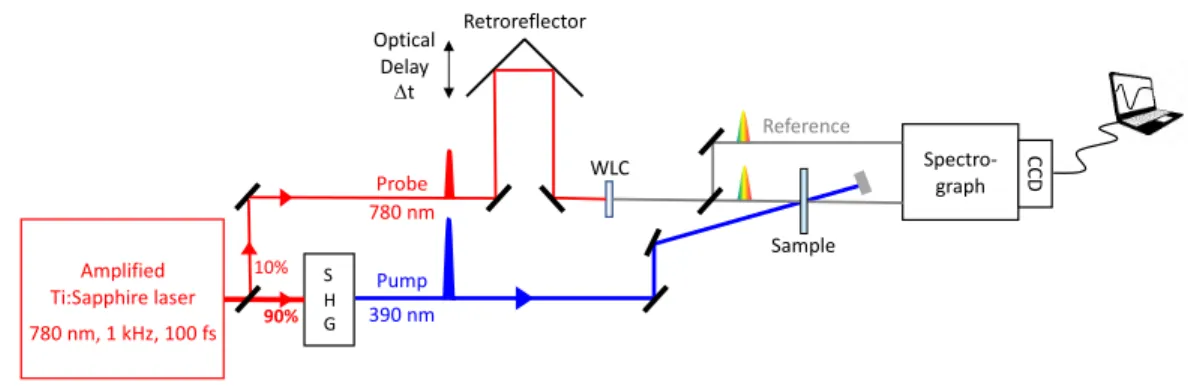
Figure 1. Principle of the “pump-probe” laser technique using a white light continuum as probe. SHG: second harmonic 115
generation. WLC: white light continuum.
As illustrated in Figure 1, the fundamental laser IR pulses are first split into two coherent replicas of different intensities and propagating along different optical paths. The stronger one, called the “pump”, is used to excite the sample after optional
120
wavelength conversion. This can be second harmonic generation (SHG) or third harmonic generation (THG) in non-linear crystals or optical parametric amplification (OPA) with subsequent second harmonic generation for a tuning range between 250 nm
S H G 90% 10% Optical Delay Dt Pump
Probe Spectro-graph
Sample Retroreflector CCD WLC Reference Amplified Ti:Sapphire laser 780 nm, 1 kHz, 100 fs 780 nm 390 nm
and 650 nm. The strong pump beam is focused into the sample cell. The weaker one, called the “probe”, is used to measure the pump-induced changes in the sample 125
absorbance. The probe pulse is optically delayed relative to the pump pulse by deviating its optical path via a retro-reflector mounted on a motorized translation stage. Since the speed of light is constant, the delay between the pump and the probe pulses, Dt, can be determined as Dt = 2*Dx/c, where Dx is the spatial displacement of the translation stage and c is the speed of light. For example, a displacement of 150 µm corresponds to a 130
temporal delay of 1 ps. The “time zero”, t = 0, corresponds to the position of the translation stage for which the pump and probe pulses arrive simultaneously at the sample. The pump and probe beams are spatially overlapped in the sample cell, in order to probe the excited volume.4
For broadband transient absorption measurements, a white light continuum (WLC) 135
probe is used which serves to measure the temporal change in the absorbance spectra associated to the electronic states created by the pump. The WLC is generated by self-phase modulation by tightly focusing the weak laser fundamental probe beam into a transparent Kerr medium, often a thin plate of CaF2, silica, YAG, or sapphire.22, 23 In
order to correct for any intensity fluctuations of the probe beam, the weak WLC beam is 140
split in two equal beams, the probe and the reference beams. The reference beam, which only serves to measure the WLC stability, is by-passing the sample while the probe beam is collimated into the sample cell, overlapping with the pump beam in order to probe only the excited volume in the sample. The probe and the reference beams are then focused on the entrance slit of a small spectrograph, dispersed spectrally and 145
detected simultaneously by a CCD camera. The probe and reference spectra are
recorded by the CCD, with and without the pump pulse on, for each delay line position,
ΔA(λ, t) = log / "!"#/%&'% )*($,&)
"%!)+"/%&'% )*($,&)0 − log /
"!"#/%&'% )##($,&)
"%!)+"/%&'% )##($,&)0 (2)
where Iprobe/pump on and Iref/pump on are the probe and the reference intensities measured
150
with the pump pulse on. Iprobe/pump off and Iref/pump off are the probe and the reference
intensities measured with the pump pulse off. The measurement of (Iprobe/pump on; Iref/pump on) and (Iprobe/pump off; Iref/pump off) for each pump-probe delay, both pairs stemming from
the same coherent replica, allows to correct for the fluctuations of the WLC during the acquisition procedure. This increases the accuracy of the DA signals, typically providing 155
a sensitivity of 10-3-10-4.
Interpretation of UV-visibletransient absorption spectra
Measurements of the DA spectra of the sample for different pump-probe delays allow to follow the formation of directly photo-excited states as well as intermediate states or 160
photoreaction products.
Figure 2. 3-population model showing the formation of an emissive product (S1 prod) from the excited state S1 produced by
the pump pulse P. Dotted grey arrows represent the non-radiative conversion: S1→S1 Prod and S0 Prod→S0. Note that the
higher excited states Sn and Sn prod are not populated by the pump pulse and S0 Prod→S0 conversion is much faster than
165
S1 Prod→S0 prod deactivation. Under these conditions, the concentrations cn(t), cn prod(t) and c0 prod(t) are zero.
Figure 2 illustrates a 3-population model involving the formation of an emissive product state from the singlet excited state. In such a case, the differential absorbance of the sample reads as:
170 ΔA(λ, t) = [ε()(λ) − ε)((λ) − ε*)(λ)] ∙ 𝑙 ∙ c+(t) + 8ε() -./0(λ) − ε)( -./0(λ) − ε*)(λ)9 ∙ 𝑙 ∙ c+ -./0(t) (3) eGS eSE S0 C0(t) S1 C1(t) Sn Cn(t)~0 eES P eES prod S1 prod C1 prod(t) Sn prod Cn prod(t) ~ 0 S0 prod C0 prod(t) ~ 0 eSE prod
with εES(λ), εGS(λ) and εESprod(λ), the molar absorption coefficients at wavelength l of the
initial excited state (S1), the ground state (S0) and the product excited state (S1 prod),
respectively. εSE(l) and εSE prod(l) are the stimulated emission coefficients of S1 and
S1 prod. c1(t) and c1 prod(t) are the concentrations of the S1 and S1prod states at time t and l
175
is the optical path. The ΔA spectra are composed of several overlapping bands
corresponding to the contributions of the different states created by the pump pulse. Negative contributions are expected from the ground-state bleach (GSB), due to the pump-induced depopulation of the ground state population, and the stimulated emission (SE) from the excited-state leading to an increase in the probe intensity. In 180
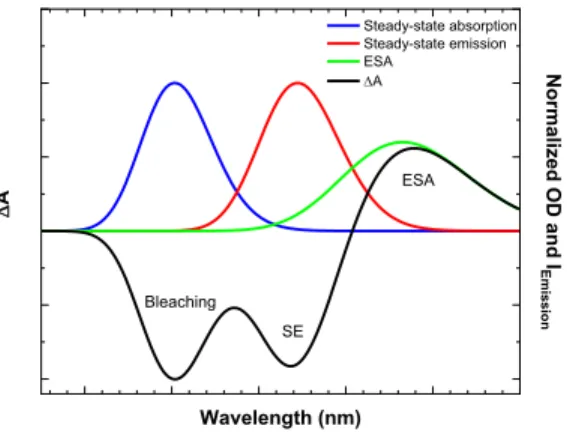
contrast, positive contributions are expected from the diminution of the probe intensity due to the excited-state absorption (ESA) and the product state absorption. Figure 3 illustrates one example of these different contributions to the DA signal.
Figure 3. Illustration of three different contributions to the differential absorbance (DA) after the sample excitation: ESA, 185
bleaching and SE. The DA spectrum is represented by the black line. The steady-state absorption and emission spectra of the sample are illustrated by the blue and red lines, respectively. The ESA is shown by the green line.
Excitation and Acido-Basic Properties of Pyranine
190
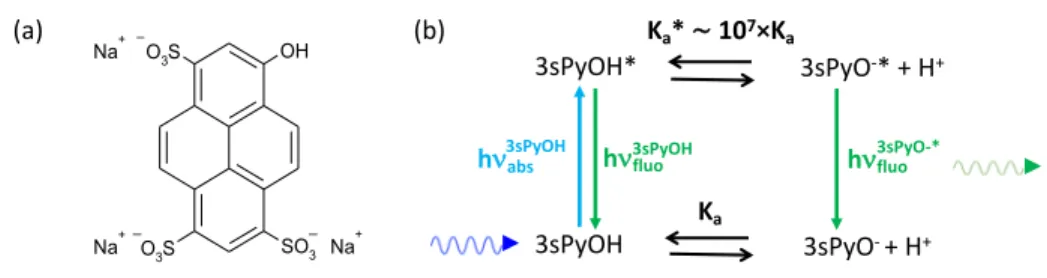
Pyranine (3sPyOH, Trisodium 8-hydroxy-pyrene 1,3,6-trisulfonate, HPTS, Figure 4 (a)) is an aromatic photoacid. It becomes 10 million times more acidic in its first excited state with respect to its ground state (pKa = 7.5 in the ground state and pKa* = 0.4 ± 1.4
SE Bleaching D A Wavelength (nm) Steady-state absorption Steady-state emission ESA DA ESA Norm ali zed OD a nd I E mis sion
in the excited state).24 Thus, upon photoexcitation, the neutral pyranine, 3sPyOH,
undergoes an intermolecular ESPT from the hydroxyl group to a neighboring solvent 195
molecule. The reaction can be described by the thermodynamic Förster cycle shown in Figure 4 (b).
Figure 4. (a) Molecular structure and (b) Förster cycle of pyranine, 3sPyOH. 200
The ESPT dynamics of 3sPyOH have been widely studied in different environments.25, 26
In moderately acidic aqueous solution at pH = 4, the protonated form, 3sPyOH,
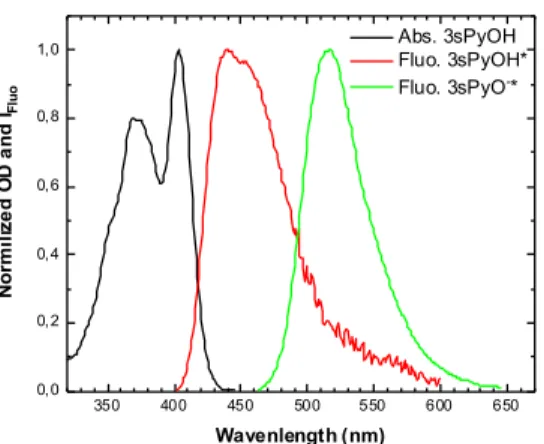
dominates in the ground state while, upon photoexcitation, ESPT occurs very efficiently and generates the deprotonated pyranine anion, 3sPyO-*. Figure 5 illustrates the
steady-state absorption and fluorescence spectra of pyranine in aqueous solutions at 205
different pH. The absorption spectrum of 3sPyOH exhibits two peaks centered around 370 nm and 400 nm recently associated with the 1Lb and 1La transitions of pyranine,
respectively.27 As previously reported,10 the fluorescence spectrum of 3sPyOH* displays
a maximum around 430 nm and a shoulder at ca. 460 nm while the spectrum of the deprotonated form, 3sPyO-* is considerably red shifted and shows a maximum at ca.
210 520 nm. 3sPyOH 3sPyOH* 3sPyO-+ H+ 3sPyO-* + H+ Ka Ka*∼107×Ka
hnfluo3sPyOH hnfluo3sPyO-* hn3sPyOHabs _ _ _ OH SO3 O3S O3S Na+ Na+ Na+ (a) (b)
Figure 5. Steady-state absorption spectrum 3sPyOH and fluorescence spectra of 3sPyOH* and 3sPyO-* in aqueous
solutions. 215
The ESPT mechanism of pyranine in water is known to be quite complex. It involves two ultrafast steps of <1 ps and ca. 3 ps, respectively, prior to the relatively slow
proton-transfer step in ca. 90 ps.10, 12, 28 The explanation of the two fast steps is still a
matter of debate in the literature. Solvation dynamics and the formation of an intramolecular charge-transfer state have been invoked11, 28-30 as well as the
220
formation/recombination of contact and separated intermolecular ion pairs before diffusion.12, 13, 15 In the present training, the physical meanings of these fast steps are
not discussed in detail since the emphasis is on the slower proton transfer process. Accordingly, experimental data are interpreted using a simplified model involving only the ground and excited states of the protonated and deprotonated forms of pyranine 225
shown in Figure 4 (b).
MATERIALS AND EXPERIMENT
Measurements of the transient absorption spectra of pyranine in an aqueous solution at pH 4 are performed with a femtosecond pump-probe set-up (see Figures 1 230
and 6) based on a commercial amplified titanium sapphire laser (Amplitude Laser) that delivers <100 fs duration pulses at 780 nm, with an energy of 2 mJ at a 1 kHz
350 400 450 500 550 600 650 0,0 0,2 0,4 0,6 0,8 1,0 N o rm il ize d O D a n d IFl uo Wavenlength (nm) Abs. 3sPyOH Fluo. 3sPyOH* Fluo. 3sPyO-*
repetition rate. 640 µJ of the output laser energy is used for the pump-probe set-up. The pump beam at 390 nm is generated from 90% of the incoming 780 nm beam by SHG in a 2 mm-thick BBO crystal. The pump energy is adjusted to 20 µJ and focused 235
to a 0.5 mm diameter beam in the sample cell. The remaining 10% of the incoming 780 nm beam travels through the optical delay line (Microcontrole) before being focused in a 2 mm rotating fused silica plate, for the WLC generation. A diaphragm and a combination of a half-wave plate and reflecting polarizers are used to adjust the energy of the 780 nm beam prior to the WLC generation. A broadband beam-splitter is then 240
used to divide the WLC into a probe and a reference beam. In order to avoid any contribution of rotational diffusion from the sample to the DA signals, the polarizations of the pump and probe beams are set at a magic “angle” (54.7º) with a half-wave plate placed in the pump beam just before the sample cuvette. The probe and the reference beams are transported and focused onto the entrance slit of an imaging planar 245
polychromator (Princeton Instruments equipped with a grating having a blaze angle optimized for 500 nm) equipped with a CCD camera (1340×400 pixels, 16 bits, Princeton Instruments) and interfaced to a PC computer. The intensities of the probe and the reference beams are monitored in real time using Winspec/32 software. A shutter, located on the pump path, allows monitoring the probe and the reference 250
beams for each pump-probe delay alternatively with and without the pump excitation. The transient absorption experiments are controlled by a homemade acquisition program written in Visual Basic (v. 6).
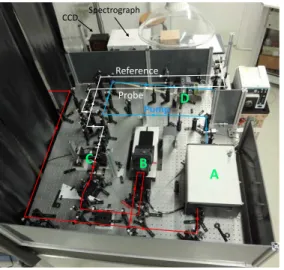
Figure 6. Picture of the experimental pump-probe set-up used for the laboratory training at Institut de Chimie Physique at
255
the University of Paris Saclay. A: SHG; B: optical delay line; C: WLC generation; D: sample cell. The red lines indicate the beam paths of the laser beam at 790 nm, the blue line indicates the beam path of the pump after SHG and the white lines indicate the beam paths of the probe and reference after WLC generation.
Preparation of the pyranine sample is described in details in Instructor’s notes. 260
HAZARDS
The femtosecond laser produces high intensity radiations. Even if the laser beams are below eye level and contained on the experimental table by non-reflective screens, people in the room have to wear safety goggles certified to block the potentially
265
dangerous IR and UV light.
The aqueous solution of pyranine at pH4 is prepared prior to experiments, so students do not manipulate chemicals (see Instructor’s notes). However, as the solution is acid, it may cause irritations if not washed off the skin reasonably quickly with a large amount of water until no evidence of the chemical remains.
270
RESULTS AND DISCUSSION
Laboratory sessions
This introduction to femtosecond laser spectroscopy is organized in two laboratory sessions on different days. The first laboratory session of 2h consists of a visit of the 275 A B C D Probe Reference Pump Spectrograph CCD
laser laboratory for the entire class of ca. 15 students, with the laser turned off for safety reasons. At this occasion, the set-up with all the instruments is explained (see Instructor’s notes). The second laboratory session of 4h is dedicated to the transient absorption measurement of the ESPT reaction of pyranine, by groups of 3 to 4 students. During this session, the laser is switched on. For this reason, the session starts with a 280
short overview of the security rules in a laser lab. Only then, with all students and teachers wearing protective eyewear, are the optical paths of the pump and the probe beams retraced on the optical table, outlining the various optics and apparatuses. Subsequently, the probe and the reference spectra are visualized in real time with the CCD in full image mode using the camera software. Figure 7 (Top) represents a 285
spectrally dispersed image of the probe and reference spots on the (vertical) input slit of the spectrograph.
Figure 7. (Top) Visualization of the dispersed probe (lower trace) and reference (upper trace) beams with the pump beam on measured with the CCD camera in image mode. The vertical axis represents the position on the input slit. The light 290
intensity is indicated by false colors, ranging from blue to red with increasing intensity. (Bottom) Corresponding spectra of the probe and the reference beams after integration over the two regions of interest defined by red and the green boxes, respectively, around the probe and the reference images in (Top), respectively.
350 400 450 500 550 600 650 0 10000 20000 30000 40000 50000 In te ns ity (c ou nt s) Wavelength(nm) Probe Reference
While in “live mode”, the limits of the two horizontal “regions of interest” to be 295
recorded during the experiments are defined in order to obtain the intensity variations of the probe and the reference beams separately, as shown in Figure 7. The acquisition parameters are chosen to maximize the signal-to-noise ratio and to avoid the saturation of the detector (see Instructor’s notes). Before starting the measurements, the spatial overlap between the pump and the probe beams in the sample is optimized by observing 300
the pump-induced changes on the probe intensity in the spectral region of 3sPyO-* SE
around 520 nm. This requires that the probe pulse arrives after the pump pulse in the sample which can be verified by a search for the “time zero” by manually moving the optical delay line. Also note that for a good spatial overlap, the diameter of the pump beam is adjusted to be twice as large as that of the probe.
305
Data acquisition and analysis
Measurements of the DA spectra of pyranine are performed for different pump-probe delays, typically between -5 and 450 ps (see Instructor’s notes). For each delay time t, the values of the wavelength l, Iprobe/pump on(l,t), Iprobe/pump off(l,t), Iref/pump on(l,t) and
310
Iref/pump off(l,t) are recorded in a separate file. The DA spectra at all the measured
pump-probe delays are calculated after the acquisition procedure according to eq. (2) using a home-made program. From these data, students are asked to choose and plot several DA spectra of pyranine at representative delay times during the ESPT reaction. An example is given in Figure 8. Using this figure, the first important task for the students 315
is to discuss the temporal variation of their chosen spectra and to attribute the different bands to the different species involved in the ESPT reaction by using the Förster
Figure 8. DA spectra of pyranine in an aqueous solution at pH 4 measured for different pump-probe delays, after 320
excitation by a femtosecond laser pulse at 390 nm. Black arrows indicate the three characteristic wavelengths at which kinetic analysis is performed in Figure 9.
Students should notice that directly after the excitation, the DA spectra are dominated by the contribution of the protonated form of pyranine. The broad positive 325
band in the spectral region around 520 nm and the negative one in the spectral region between 430 and 450 nm are attributed to ESA and SE of 3sPyOH*, respectively. In the spectral region below 430 nm, the negative contribution to the DA spectra can be attributed to GSB due to the depletion of the ground-state population induced by the pump pulse. Note that the ESA band of 3sPyrOH* exhibits a blue shift within 5 ps 330
stemming from solvation dynamics and the earliest steps of the ESPT reaction
mentioned above. Both the ESA and the SE bands associated with 3sPyOH* disappear in a few tens of picoseconds. From 5 ps and onwards, an isosbestic point (i.e. a
wavelength where DA remains constant), can be observed at about 485 nm. This can be taken as an indication of a precursor-successor relationship of two populations, namely 335
the excited state of the protonated and the deprotonated forms of pyranine respectively (3sPyOH* → 3sPyO-*). After 50 ps, the DA spectra become dominated by the
contribution of 3sPyO-*. The SE and the ESA bands associated with 3sPyOH* are
replaced by the positive band peaking at 455 nm and the negative one centered around 520 nm arising from the ESA and SE of 3sPyO-*, respectively.
340 -0,2 -0,1 0 0,1 0,2 0,3 0,4 400 450 500 550 600 DA Wavelength (nm) 1 ps 5 ps 10 ps 50 ps 100 ps 200 ps 450 ps
In a second step of the experimental data analysis, the students are asked to select three characteristic wavelengths for the features mentioned above and to plot the kinetic traces, as shown in Figure 9. The observed kinetic traces have then to be discussed. For instance, just after excitation, the kinetics at 430 nm is dominated by the negative contribution of the SE of 3sPyOH*. After a few picoseconds, it becomes 345
positive indicating that the ESA of 3sPyO-* becomes dominant. Inversely, at 520 nm the
DA is positive just after excitation due to the main contribution of the ESA of 3sPyOH*, then it becomes gradually negative due to the increasing contribution of the SE of 3sPyO-*. The last “flat” kinetic trace illustrates the temporal variation of DA in the
spectral region of the isosbestic point of the time-resolved spectra. 350
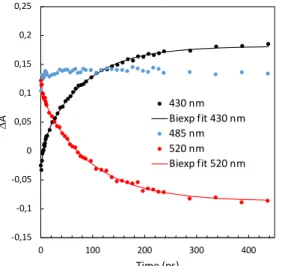
Figure 9. DA kinetic traces at three representative wavelengths extracted from the data of Figure 8. The solid lines correspond to data fitted by bi-exponential model functions with Excel (for parameters see Table 1 below).
For the last step of the experimental data analysis, students are asked to perform a 355
non-linear fit of the two selected kinetics in the spectral regions around 430 nm and 520 nm in order to determine the ESPT rate constant. After having imported the experimental data in an Excel table, the students have to define the appropriate fitting function. The measured kinetic traces in the spectral regions of 430 nm and 520 nm can be reasonably well fitted by using a sum of exponential functions, defined as follow: 360 -0,15 -0,1 -0,05 0 0,05 0,1 0,15 0,2 0,25 0 100 200 300 400 DA Time (ps) 430 nm Biexp fit 430 nm 485 nm 520 nm Biexp fit 520 nm
f(t) = ∑213+A1× exp(− t τ⁄ ) + C 1 (4) with ti being the time constants, Ai the preexponential factor and C a constant
representing the signal of the long-lived excited state of 3sPyO-*. Note that both Ai and
C can be positive or negative. In the present training, mono- and bi-exponential functions can be used. After having chosen the initial parameters and calculated the 365
model values for all the measured optical delay times, students have to apply the least-squares regression algorithm. To this purpose, they have to calculate the error function
S, defined as the sum of the squared residuals:
S = ∑ [y(t213+ 1) − f(t1, θ)]4 (5) with y(ti), the experimental data points and f(ti,q) the model function values for a
370
parameter set q = {Ai, ti, C}.
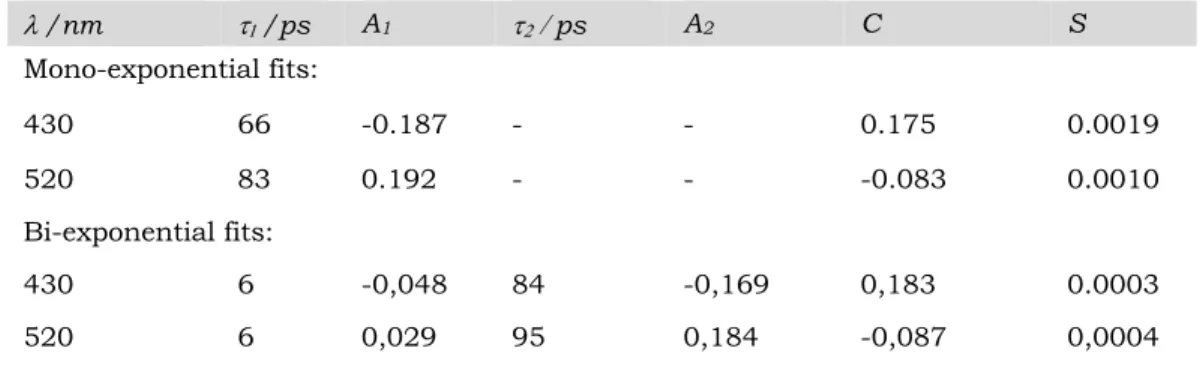
Table 1. Parameters (ti time constants, Ai pre-exponential factors and C constant)
of the mono-exponential and biexponential functions (eq.4) used to fit the kinetic
traces at the two selected wavelengths shown in Figure 9. S is the sum of the squared residues (eq. 5).
375 l /nm t1 /ps A1 t2 / ps A2 C S Mono-exponential fits: 430 66 -0.187 - - 0.175 0.0019 520 83 0.192 - - -0.083 0.0010 Bi-exponential fits: 430 6 -0,048 84 -0,169 0,183 0.0003 520 6 0,029 95 0,184 -0,087 0,0004
The “best” fitting parameter set can then be obtained by using the “solver” option in Excel. An explicit example is given in Instructor’s notes together with the procedure for calculating the errors on the fitting parameters (optional). These simple numerical calculations using an Excel-sheet provide an excellent means to illustrate a non-linear 380
career. Table 1 gathers the optimized parameters for mono- and bi-exponential fits of the kinetic traces at 430 nm and 520 nm shown in Figure9.
The time constants of the mono-exponential fits reflect mainly the ESPT reaction. These fits reveal, however, slightly distinct time constants at 430 nm and 520 nm 385
arising from the short time events preceding the ESPT reaction. Notably, the blue shift of the ESA band associated with 3sPYOH* within the first five picoseconds leads to a significant change in the DA signals at 430 nm and to a lesser extent at 520 nm as shown in Figure8. Such spectral changes lead to complex kinetic behavior that requires a sum of exponentials to be properly fitted. The students can optionally 390
discuss this point in their report and compare mono-and bi-exponential fits of their chosen kinetics. The accuracy of bi-exponential fits is in general found to be better. Bi-exponential fits of the two kinetic traces of Figure9 lead to two time constants (see Table1), a short one of 6 ps (t1) and a longer one of about 90 picoseconds (t2) that are
comparable to those reported in the literature.10, 12, 28 As previously mentioned, there 395
has been much debate regarding the attribution of the shortest time components. Therefore, the detailed discussion about the origin of the 6ps time constant found here is beyond the scope of this laboratory training. In this context, t2 which contributes
mainly to the kinetic traces at 430nm and 520nm can be attributed to the ESPT reaction. Note that a very good reproducibility of this reaction time during has been 400
observed during the different training sessions over the years (see Instructor’s notes). For the last task of the training session, the students are asked to compile their experimental data and their interpretations in the form of a research paper. The
principles and the functioning of the transient absorption set-up and experiments have to be explained in the experimental part. A small bibliographical work on pyranine is 405
asked to compare their results with time-resolved fluorescence measurements of an aqueous solution of 3sPyOH at pH = 4, performed in another training session. These measurements, made by time-correlated single photon counting (TCSPC), inform mainly on the excited state lifetime of the 3sPyO-* anion, which is several nanoseconds, but a
410
“fast” component can also be observed and directly compared with the ESPT time constant obtained from the transient absorption measurements. The manuscript is then used to evaluate students on both their practical session and their knowledge of ultrafast spectroscopy acquired during their classes.
CONCLUSION
415
This laboratory training is an introduction to femtosecond spectroscopy for master students in chemistry. The basic concepts of ultrafast spectroscopy are addressed through the study of the fast proton-transfer reaction from the photoexcited pyranine molecule to the solvent in aqueous solution using broadband femtosecond transient 420
absorption spectroscopy. This laboratory training is organized in two sessions, a first one of 2h which consists of a visit of the laser laboratory and a second one of 4h dedicated to the transient absorption measurements. This training aims to give students hands-on experience in ultrafast spectroscopy and data analysis, to fill the gap between theoretical and practical knowledge of femtosecond spectroscopy. The 425
students are expected to provide a written report describing the experimental setup, explanations of the instruments used and a brief recall of the chemical reaction investigated, i.e. the pyranine molecule and its photophysical properties. This report should be written in the style of a scientific article, respecting the quality and the rigor required. Moreover, students need to perform a quantitative analysis of the data that 430
This training introduces students to the experimental research activity in a physical chemistry laboratory in general and to modern time-resolved spectroscopic techniques in particular. Moreover, it provides an example of a fundamental photochemical reaction that is ubiquitous in chemistry and biology. Even if students do not perform 435
the experiment fully by themselves (all the experiments are executed in a group of 3 to 4 students supervised by a professional researcher), the experiment helps them to
understand the concepts and to realize the complexity and the difficulty to acquire experimental data. In this sense, this laboratory training is not limited to the particular problem of a proton transfer reaction but it also confronts the students with the more 440
general problem of making a critical analysis of experimental results. In a wider perspective, this practical laboratory training may serve as a first introduction to the “real” activity in a research laboratory. Going beyond a simple laboratory visit, the students get the opportunity to participate in the running of an advanced experiment, interact with the operators and treat their “own” data set.
445
ASSOCIATED CONTENT
Supporting Information
The Supporting Information is available on the ACS Publication website at DOI: XXX.
450
Instructor’s notes detailing preparation of the pyranine solution, real-time visualization of the white light continuum with a CCD camera, data acquisition, non-linear fitting procedure with Excel and experimental reproducibility (PDF)
Practical training instructions for students describing the basic principles of the experiments and the tasks to be achieved (PDF)
455
AUTHOR INFORMATION
Corresponding Author
Notes
The authors declare no competing financial interest 460
ACKNOWLEDGMENTS
The authors gratefully acknowledge Audrey Gayral and Fabrice Gobert for technical assistance to set up the experiment in the Institut de Chimie Physique. The authors wish to thank the SERP-Chem and SERP+ Erasmus programs for financial support.
REFERENCES
465
1. Turro, N. J.;Ramamurthy, V.Scaiano, J. Modern Molecular Photochemistry of
Organic Molecules. University Science Book: 2010.
2. Gilbert, A.Baggott, J. E. Essentials of Molecular Photochemistry. Blackwell Scientific Publications: 1990.
3. Maiuri, M.;Garavelli, M.Cerullo, G. Ultrafast Spectroscopy: State of the Art and 470
Open Challenges. J. Am. Chem. Soc. 2020, 142 (1), 3-15.
4. Tkachenko, N. V. Optical Spectroscopy. Methods and Instrumentation. 2006. 5. Zewail, A. H. Femtochemistry: Atomic-scale dynamics of the chemical bond. J.
Phys. Chem. A. 2000, 104 (24), 5660-5694.
6. Norrish, R. G. W.Porter, G. Chemical Reactions Produced by Very High Light 475
Intensities. Nature. 1949, 164 (4172), 658.
7. Thomas, J. V.;Brimijoin, M. R.;Neault, T. R.Brubaker, R. F. The Fluorescent
Indicator Pyranine is Suitable for Measuring Stromal and Cameral pH In Vivo. Exp.
Eye Res. 1990, 50 (3), 241-249.
8. Overly, C. C.;Lee, K.-D.;Berthiaume, E.Hollenbeck, P. J. Quantitative Measurement 480
of Intraorganelle pH in the Endosomal-Lysosomal Pathway in Neurons by using Ratiometric Imaging with Pyranine. Proc. Natl. Acad. Sci. USA. 1995, 92 (8), 3156-3160.
9. Sabnis, R. W. Handbook of Fluorescent Dyes and Probes. 2015.
10. Tran-Thi, T. H.;Gustavsson, T.;Prayer, C.;Pommeret, S.Hynes, J. T. Primary 485
Ultrafast Events Preceding the Photoinduced Proton Transfer from Pyranine to Water. Chem. Phys. Lett. 2000, 329 (5-6), 421-430.
11. Mohammed, O. F.;Dreyer, J.;Magnes, B.-Z.;Pines, E.Nibbering, E. T. J. Solvent-Dependent Photoacidity State of Pyranine Monitored by Transient Mid-Infrared Spectroscopy. ChemPhysChem. 2005, 6 (4), 625-636.
490
12. Leiderman, P.;Genosar, L.Huppert, D. Excited-State Proton Transfer: Indication of Three Steps in the Dissociation and Recombination Process. J. Phys. Chem. A.
2005, 109 (27), 5965-5977.
13. Spry, D. B.;Goun, A.Fayer, M. D. Deprotonation Dynamics and Stokes Shift of Pyranine (HPTS). J. Phys. Chem. A. 2007, 111 (2), 230-237.
495
14. Han, F.;Liu, W.Fang, C. Excited-State Proton Transfer of Photoexcited Pyranine in Water Observed by Femtosecond Stimulated Raman Spectroscopy. Chem. Phys.
2013, 422 (SI), 204-219.
15. Liu, W.;Wang, Y.;Tang, L.;Oscar, B. G.;Zhu, L.Fang, C. Panoramic Portrait of Primary Molecular Events Preceding Excited State Proton Transfer in Water. Chem. 500
Sci. 2016, 7 (8), 5484-5494.
16. Wang, Y.Einsenthal, K. B. Picosecond Laser Studies of Ultrafast Processes in Chemistry. J. Chem. Edu. 1982, 59 (6), 482-489.
17. Maestri, M.;Ballardi, R.;Pina, F.Melo, M. J. An Easy and Inexpensive Flash Spectroscopy Experiment. J. Chem. Edu. 1997, 74 (11), 1314-1316. 505
18. Kosenkov, D.;Shaw, J.;Zuczek, J.Kholod, Y. Transient-Absorption Spectroscopy of Cis−Trans Isomerization of N,N-Dimethyl-4,4′-azodianiline with 3D-Printed
Temperature-Controlled Sample Holder. J. Chem. Edu. 2016, 93 (7), 1299-1304. 19. Larsen, M. C.Perkins, R. J. Flash Photolysis Experiment of o-Methyl Red as a
Function of pH: A Low-Cost Experiment for the Undergraduate Physical Chemistry 510
Lab. J. Chem. Edu. 2016, 93 (12), 2096-2100.
20. Farr, E. P.;Quintana, J. C.;Reynoso, V.;Ruberry, J. D.;Shin, W. R.Swartz, K. R. Introduction to Time-Resolved Spectroscopy: Nanosecond Transient Absorption and Time-Resolved Fluorescence of Eosin B. J. Chem. Edu. 2018, 95 (5), 864-871. 21. Backus, S.;III, C. G. D.;Murnane, M. M.Kapteyn, H. C. High Power Ultrafast Lasers. 515
Rev. Sci. Instrum. 1998, 69 (3), 1207-1223.
22. Baldeck, P.;Ho, P. P.Alfano, R. R. Effect of Self, Induced and Cross Phase Modulations on the Generation of Picosecond and Femtosecond White Light Supercontinua. Rev. Phys. Appl. 1987, 22 (12), 1677-1694.
23. Fork, R. L.;Shank, C. V.;Hirlimann, C.;Yen, R.Tomlinson, W. J. Femtoseconds 520
White-Light Continuum Pulses. Opt. Lett. 1983, 8 (1), 1-3.
24. Förster, T. Elektrolytische Dissoziation Angeregter Moleküle. Z. Phys. Chem. 1959,
54 (1), 42-46.
25. Valeur, B. Molecular Fluorescence: Principles and Applications. Wiley-VCH Verlag GmbH: 2001.
525
26. Kumpulainen, T.;Lang, B.;Rosspeintner, A.Vauthey, E. Ultrafast Elementary Photochemical Processes of Organic Molecules in Liquid Solution. Chem. Rev.
2017, 117 (16), 10826-10939.
27. Spry, D. B.;Goun, A.;III, C. B. B.Fayer, M. D. Identification and properties of the 1La
and 1Lb states of pyranine. J. Chem. Phys. 2006, 125 (14), 144514.
530
28. Simkovitch, R.;Rozenman, G. G.Huppert, D. A fresh look into the time-resolved fluorescence of 8-hydroxy-1,3,6-pyrenetrisulfonate with the use of the fluorescence up-conversion technique. J. Photochem. Photobiol. A. 2017, 344, 15-27.
29. Tran-Thi, T. H.;Prayer, C.;Millie, P.;Uznanski, P.Hynes, J. T. Identification of an Intermediate in the Excited-State Proton-Transfer Reaction. J. Phys. Chem. A. 535
2002, 106 (10), 2244-2255.
30. Spry, D. B.Fayer, M. D. Charge Redistribution and Photoacidity: Neutral Versus Cationic Photoacids. J. Chem. Phys. 2008, 128 (8), 084508.