Science Arts & Métiers (SAM)
is an open access repository that collects the work of Arts et Métiers Institute of Technology researchers and makes it freely available over the web where possible.
This is an author-deposited version published in: https://sam.ensam.eu
Handle ID: .http://hdl.handle.net/10985/18756
To cite this version :
Citra Yanto Ciki PURBA, Joffrey VIGUIER, Louis DENAUD, Bertrand MARCON - Contactless moisture content measurement on green veneer based on laser light scattering patterns - Wood Science and Technology p.16 - 2020
Any correspondence concerning this service should be sent to the repository
Contactless moisture content measurement on green
veneer based on laser light scattering patterns
Citra Yanto Ciki Purba1 · Joffrey Viguier1 · Louis Denaud1 · Bertrand Marcon1
Abstract
The wood structure anisotropy and moisture content variation within the volume create different patterns of light scattering inside the wood. The objective of this study was to assess the suitability of a laser method for online measurement of green veneer moisture content based on the so-called tracheid effect. Beech and poplar veneers with thicknesses of 1, 2 and 3 mm were subsequently laser scanned and weighed to obtain various humidities. The results show that the measured laser scat-tering profile, such as the major axis, minor axis and ellipse area on the veneer sur-face, increases with moisture. The laser scattering profile provides a reliable and precise prediction of the moisture content. Out of the three ellipse parameters eval-uated, the ellipse area provides the best prediction of the moisture content of the green veneer for both beech and poplar.
Introduction
Moisture content (MC) is one of the most important aspects of wood that can affect both the production process and the quality of wood products. For veneer produc-tion in particular, it is important to know the MC as excessive drying leads to higher
energy consumption and lower veneer quality (Lutz 1978; Hartley 1984). Another
advantage of measuring veneer MC is that it helps to avoid hot pressing and
blister-ing problems in the panel caused by high-localized MC (Marra 1992). In addition,
stacking and drying of veneers by MC category can increase drying efficiency and reduce energy consumption.
The most accurate method to measure MC is the gravimetric method. However, it relies on the determination of the mass variation after oven drying, which is there-fore not relevant to use for online or at least nondestructive measurement of MC dur-ing the veneer production process. To date, various methods have been developed
* Citra Yanto Ciki Purba [email protected]
and introduced to measure MC including electrical properties (James 1963),
micro-wave (Nyfors 2000; Johansson et al. 2003) and near-infrared spectroscopy (Adedipe
and Dawson-Andoh 2008). James (1963) explained that the MC measurement using
the electrical properties exploits the relationship of moisture content with direct cur-rent resistance, dielectric loss factor and the dielectric constant of the wood. The resistance type is the most commonly used, but it is not reliable for MC greater than
30%. Regarding online measurement, Andersson et al. (2006) reported that
meth-ods using electrical resistance require good contact of the non-penetrating electrodes with the surface.
The microwave measurement of MC is based on the permittivity of wood, which
is highly dependent on moisture content, as demonstrated by Nyfors (2000). He
added that the density and temperature influence the measurement of the MC by
microwave method. Antikainen et al. (2015a) have shown that infrared technology
may be used for online measurement of birch veneer MC. However, it is also very sensitive to temperature. Nowadays, there are many portable devices that use
elec-trical and microwave methods. However, the resolution is often higher than 10 cm2
(Antikainen et al. 2015b).
Wood is a heterogeneous and anisotropic material, which is reflected in the prop-erties of the wood and in the mechanisms of light scattering inside the wood. As an example, the projection of a laser spot perpendicular to the wood surface causes a certain amount of light to be scattered by diffusion on the surface and forms a big-ger spot than the projected one. In contrast to the circular laser source, this spot becomes elliptical once touching the wood surface as a consequence of some light diffusion into the cellular structure and is transmitted mainly in the longitudinal
direction of the tracheids (Soest et al. 1993). The orientation of the major axis of the
ellipse corresponds to the projection of the longitudinal direction of the fiber. This
phenomenon is commonly referred to as the tracheid effect (Nyström 2003;
Simo-naho et al. 2004; Briggert et al. 2018). This diffusion varies according to the
spe-cies, and its physical explanation is not yet fully understood (Nyström 2003; Zhou
and Shen 2003; Simonaho et al. 2004). The tracheid effect has for many years been
used in commercial timber scanners as a mean to detect wood defects such as knots
(Nieminen et al. 2013; Briggert et al. 2018). It has recently been used for machine
grading purposes by measuring the fiber direction (Olsson et al. 2013; Viguier et al.
2015, 2018; Ehrhart et al. 2018).
Interestingly, light also propagates differently in wet and dry wood (Kienle et al.
2008; Simonaho et al. 2003). Kienle et al. (2008), who studied the propagation of
light in wet and dry silver fir, explained that scattered light in wet wood tends to travel further inside the wood, especially along the cell axis. They also pointed out that the difference between the refractive indices of wood and water is less than the difference between wood and air. As a result, the light scattering at the interface between water and wood is less pronounced than between air and wood,
allow-ing it to spread further into wet wood. Kienle et al. (2008) also showed that the
ellipse shape factor or ratio between major and minor axis is more pronounced in the dry wood because the minor axis of the ellipse changes linearly with the humid-ity while the major axis remains relatively constant. An investigation by Simonaho
showing that the major axis of the ellipse increased during the first 2 h but that the shape factor increased steadily with soaking time. Nonetheless, the two studies dis-cussed above only compared the laser profile on wood soaked in water for a period of time, called wet wood, and not the freshly cut wood as in the present work (green
wood). Furthermore, a study by Juttula and Mäkynen (2013) attempted to simulate
the propagation of light inside wood at different moisture levels.
Based on the outcomes previously mentioned, laser technology based on the trac-heid effect has a great potential to be exploited for the online measurement of MC in the veneer industry. Up to now, there are no reported studies on contactless measure-ment of veneer MC using laser method, allowing both online monitoring of veneer MC and surface mapping of the MC over the veneer surface. As a result, the aim of the present study is to investigate how the laser scattering profile can be used to measure green veneers MC. A new measurement method with higher resolution and shorter measurement time would enable a local moisture content field (at about
1 mm2 resolution) and even provide the local MC gradient mapping both to detect
the presence of water pockets or a peculiar wood type (reaction wood). The latter, being essential to avoid any subsequent problems in the EWP composition process: hot pressing and blistering problems in the panel caused by high-localized MC.
Method
Veneer preparation
The wood material consists of two poplar (Populus sp.) and two beech (Fagus
syl-vatica L.) green logs harvested in Bourgogne, France. The average diameter and
length of these logs were, respectively, 50 cm and 70 cm. Prior to peeling, beech logs were soaked at 55 °C for 48 h. For poplar, soaking was not required. Afterward,
the logs were rotary peeled at 1 m s−1 without pressure bar using a light packaging
scale lathe (SEM S500 - knife length 900 mm). The veneer thickness was set to 1, 2 and 3 mm and the width at green state to 500 mm. Right after the peeling, veneer
sheets were cut to smaller sheets of 20 × 300 mm2. In total, 72 veneers were used in
this study (36 veneers for each species). In this study, the measurement was taken only on clear wood samples in order to avoid the influence of any wood singularity
(knots, cracks) on the laser beam pattern (Briggert et al. 2018).
Measurement setup
Each veneer sheet was characterized with an optical scanner initially designed to measure the local grain angle of wooden boards; the whole setup is described in
Olsson et al. (2018) and was used by Viguier et al. (2018) to measure the local grain
angle on veneer. For these experiments, a circular beam laser with a wavelength of 1064 nm was employed. The output laser power was set to 372 mW. The laser beam was split into several points using a diffractive optical element (DOE) beam splitter
the different subsequent laser spots. For this study, only 6 laser points were used (out
of the 20 points available) as described in Fig. 1c. The laser power was measured
using a photodiode sensor (Thorlab PM16-151), which indicated that the individual laser power ranged between 5.92 and 7.36 mW. Both the laser and the camera were mounted with their optical axis perpendicular to the investigation surface. During
the measurement, a support was used (see Fig. 1a) to maintain veneer flatness.
Measuring the laser scattering profile
The laser scattering profile was determined by measuring the ellipse generated by the projection of laser beams onto the veneer surface. The evolution of the ellipse shape over the entire length of each veneer is determined by illuminating the sur-face with only one laser dot; a conveyor provides the whole support translation at a constant linear speed (around 13 m/min), carrying 6 veneers at once, under the laser and fixed mounted camera. The measurement was taken every 1 mm along the entire 250 mm length of the considered veneer. In order to visualize the laser points, a NIR (near-infrared) 8-bit grayscale (255 grey levels) camera with a
resolution of 2040 × 1088 pixels was used. Using a 50-mm lens, it is possible to
capture 340 images per second from an area of about 300 × 160 mm2 at a distance
of 1 m. The humidity is considered to be the same across the section since the thickness is only between 1 and 3 mm. The veneer weight before and after laser measurement was compared and found to be less than 1%. The moisture content was determined following the double weighting method using an analytical balance (Kern EMS 300-3) with 0.001 g accuracy. Given this accuracy and the weight of the veneer specimen, the maximum error on the MC results could be 0.04%. Conse-quently, the veneer MC was considered constant during the laser measurement. The ellipse measurement was taken only on one face of each veneer (the tight side).
The veneer was placed on the support and then subsequently air-dried and oven-dried (103 ± 2 °C) to obtain various MC. For each sample, the measurements were taken on 20 different MC, so that the total number of measurements was 1440. Dur-ing the first ten measurements, the samples were left to dry indoors. The dryDur-ing time for each species and veneer thickness was different because the green humid-ity and drying rate were different. For the thinnest veneer, five first measurements were taken every 5 min. The following five measurements were taken every 10 min. After drying indoors, the veneer was dried outdoors and the measurement was taken every 5 min. The veneer was then dried in the oven for 1 min, 2 min, 4 min, 6 min and 24 h. In between measurements, immediately after the veneer passes through the laser, the samples were weighed to follow the evolution of the average MC. The average MC of each veneer and for each measurement time was calculated by com-paring the oven-dried weights with those in between the measurements. The MC of the samples at the beginning of the measurements ranged from 40% to 130.
Data analysis
The collected spectral images were analyzed with Python 3.6. The first step to com-pute the ellipse feature from the laser beams consists of a binarization of the images at a 80 (over 255 since the images are coded in 8 bits) grayscale threshold, this step
is shown in Fig. 2. The choice of the threshold will be discussed in the result and
discussion section. Then, the contour of the different light diffusion patterns is fit-ted to an elliptical equation in the least square sense using the fitEllipse function
from OpenCV library (Bradski 2000). This process enables to extract from the laser
scattering profile different geometrical descriptors such as major axis, minor axis and ellipse area. As the measurement was taken every 1 mm, approximately 250 ellipses were characterized for each veneer sheet. The mean values of the 3 ellipses
geometrical parameters (major axis, minor axis and area) were computed from the 250 ellipses recorded along each 250 mm veneer length.
In order to assess the difference in wood density among various veneer thick-nesses, Tukey’s multiple HSD (honestly significant difference) comparison tests were performed at a significance level of 5%. To evaluate the relationship between the measured parameters, the coefficient of determination was used. Linear and exponential models were used to model the evolution of the laser scattering pro-file under different moisture contents. Since, as abovementioned, the 6 used laser points are different (due to the optical separation of the laser beam) and three dif-ferent veneer thicknesses were studied that may behave difdif-ferently, the models were evaluated for each combination of veneer thickness and laser beam.
Results and discussion
Veneer characteristic
To compare the characteristics of the veneer material used in the present study, the green veneer MC, the densities for each wood species and the veneer thicknesses
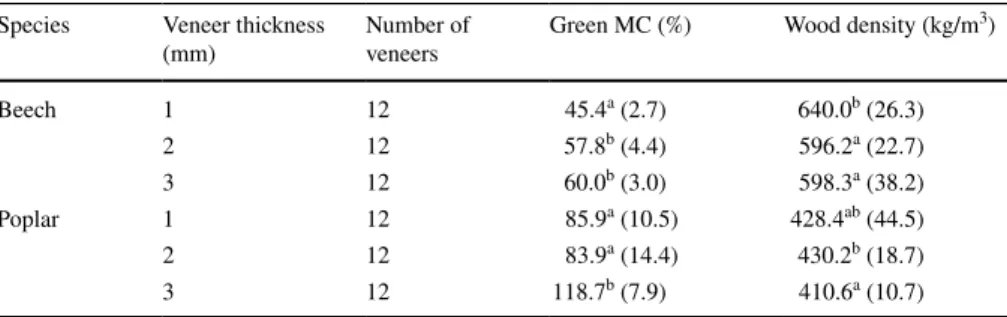
are presented in Table 1. As can be seen from Table 1, the green MC of poplar was
higher than that of beech. It is also clear that the MC of green veneer from both species was consistently higher on the 3-mm-thick veneer. Regarding veneer densi-ties of both species, the highest value was found for the 1-mm-thick beech veneers, while the lowest was found for poplar veneers of 2 mm thickness.
Previous reports have shown that beech green MC on sawn timber ranged from 53 to 71%, while poplar green moisture for the sapwood ranged from 88 to 100%
and the heartwood ranged between 213 and 254% (Németh et al. 2013; Barański
et al. 2017). The lower MC indicated in this study was due to the time spent to
pre-pare the sample, which allows the veneer to dry before the measurement was per-formed. In addition, because of the low veneer thickness, the veneer dried rapidly. For this reason, the highest MC has consistently been found on the thickest veneer.
Table 1 General information about the veneer pieces of 20 × 300 mm2
Different letters (a and b) above the numbers signify statistically different populations, based on Tukey’s post hoc HSD tests (p < 0.05). Values in parentheses are standard deviations. Density was measured at 3% MC
Species Veneer thickness
(mm) Number of veneers Green MC (%) Wood density (kg/m 3) Beech 1 12 45.4a (2.7) 640.0b (26.3) 2 12 57.8b (4.4) 596.2a (22.7) 3 12 60.0b (3.0) 598.3a (38.2) Poplar 1 12 85.9a (10.5) 428.4ab (44.5) 2 12 83.9a (14.4) 430.2b (18.7) 3 12 118.7b (7.9) 410.6a (10.7)
Relationship between laser scattering profile and moisture content Influence of laser characteristic on the analysis of laser scattering profile
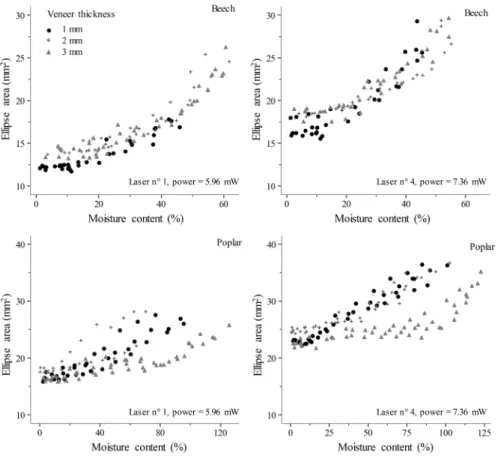
In this study, six different laser points were used to measure the laser scattering pro-file. In order to see the influence of the laser characteristic on the detected ellipse, the ellipse area at various MC was compared between the lowest and highest power
laser in Fig. 3. It can be seen that the ellipse area is bigger on the veneer surface
when measured using the higher laser power. Nevertheless, the laser power alone may not be sufficient to explain the laser characteristic and its effect on the laser scattering profile. For instance, the laser incidence angles were not identical for all six lasers. For this reason, it was chosen to analyze the influence of moisture on the laser scattering profile for each laser beam separately.
In Fig. 3, it is also shown that the ellipse area measured on beech veneer surface
increases exponentially with the increase in the veneer moisture content. In con-trast, the ellipse area on poplar veneer increases relatively linearly with the moisture
Fig. 3 Influence of the moisture content and laser power on the ellipse area detected on the veneer sur-face of beech (top) and poplar veneer (bottom) together with the effect of the veneer thickness
content. As a result, in order to investigate the influence of humidity on the ellipse area, exponential models were used for beech ellipse area, while linear models were used for poplar.
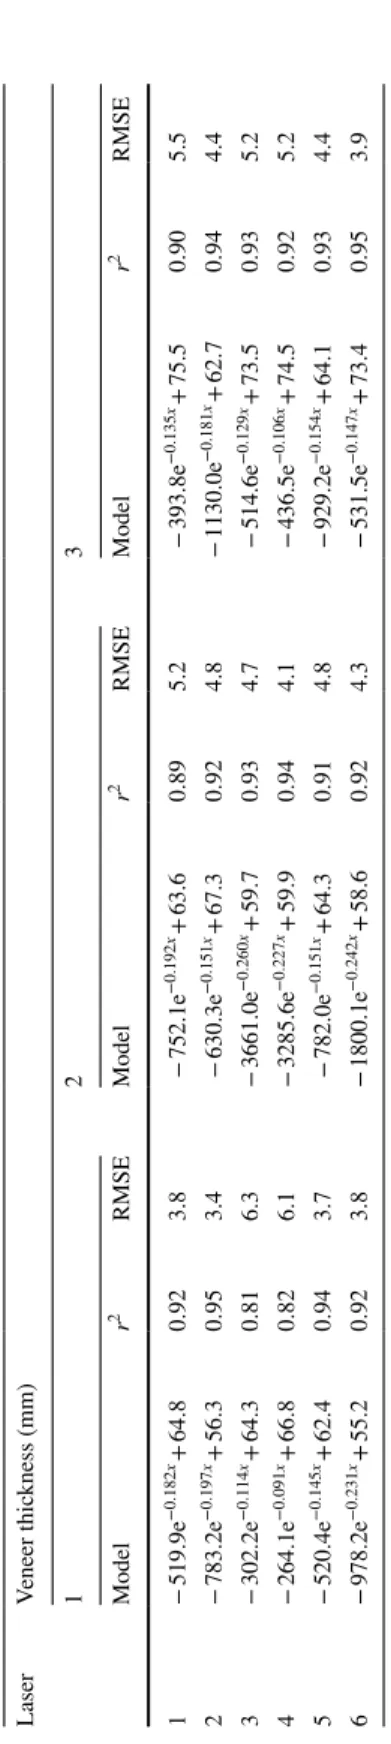
Table 2 presents a summary regarding the exponential modeling of beech veneer
moisture content using the ellipse area for the 6 laser zones and the 3 different
thicknesses. Table 2 shows that the models are different for all lasers and veneer
thicknesses. It means that the veneer thickness also influences the laser light scat-tering pattern. It is interesting to note that despite these facts, highly significant cor-relations are observed between moisture content and ellipse area for all lasers and veneer thicknesses considered in this study.
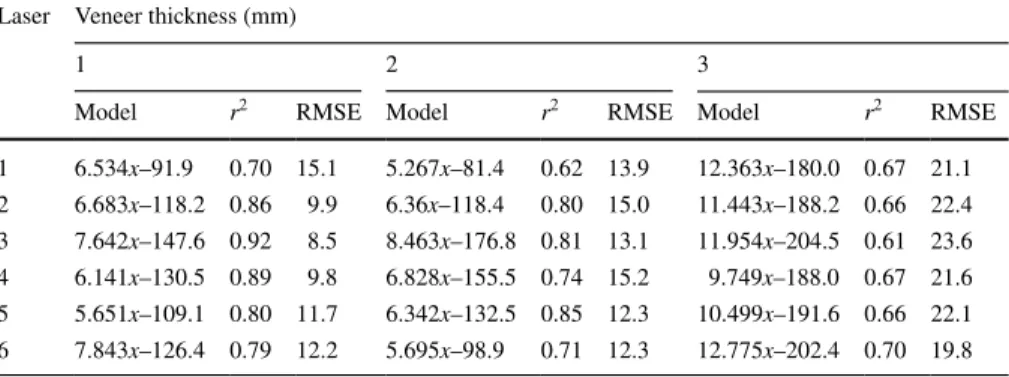
Linear models were used to analyze the correlation between veneer moisture con-tent and ellipse area measured on the veneer surface of poplar; the results are
pre-sented in Table 3. The correlations between the ellipse area and the moisture content
measured on all lasers and the veneer thickness were found to be significant even with such influences. The level of significance in poplar veneer, however, is lower than the one observed in beech whatever the veneer thickness.
Looking at the coefficients of determination from Tables 1 and 2, wood species
influence the measurement of MC using the laser scattering profile. The MC predic-tion accuracy observed on poplar veneers decreases with the veneer thickness. For beech, however, the significance level remains high for all thicknesses. Neverthe-less, the laser scattering method has given good results for the MC assessment on both species and the three veneer thicknesses considered in this study. However, it is much better on beech and less accurate for poplar.
Existing devices for online measurement of veneer moisture are based on either the microwave or the electrical methods. Metriguard DME and Mecano MVA are two commercially available devices for online measurement of veneer MC by
means of microwave methods. Antikainen et al. (2015b) have performed the MC
measurement on beech veneers using both devices and reported that both provide high accuracy of MC measurement with RMSE of less than 2% of MC on birch and spruce veneer. Indeed, microwave methods provide better accuracy of MC urement than laser methods. However, the size of the sensor used for MC meas-urement with the microwave method is 10 cm, which gives a lower resolution than the laser method, which could potentially measure humidity every 1 mm. Electrical method devices such as Mecano DMA also exist for measuring the veneer MC, but it is only convenient to use below the fiber saturation point. A recent study by
Anti-kainen et al. (2015a) showed that MC measurement using infrared (IR) technologies
offers high accuracy with RMSE of less than 3% and a high spatial resolution up to
3 × 3 mm2. Nonetheless, the IR method exploits the relationship between the heat on
the veneer surface detected by IR and the MC, which makes it unsuitable for the use during the peeling operation.
To evaluate the influence of species and veneer thickness on measured ellipse parameters, the average value of all measured ellipse parameters was assigned to
several MC categories in Table 4. This table shows that the ellipse area, minor axis
and major axis increase with the global veneer MC of beech veneers. Within the range of thicknesses from 1 to 3 mm, the maximum variation in ellipse area due to
Table 2 Exponential modeling of t he r elationship be tw een t he mois tur e content and t he ellipse ar ea of beec h v eneer The in put par ame ter x is in mm 2 and RMSE r epr esents MC in % Laser Veneer t hic kness (mm) 1 2 3 Model r 2 RMSE Model r 2 RMSE Model r 2 RMSE 1 − 519.9e −0.182 x + 64.8 0.92 3.8 − 752.1e −0.192 x + 63.6 0.89 5.2 − 393.8e −0.135 x + 75.5 0.90 5.5 2 − 783.2e −0.197 x + 56.3 0.95 3.4 − 630.3e −0.151 x + 67.3 0.92 4.8 − 1130.0e −0.181 x + 62.7 0.94 4.4 3 − 302.2e −0.114 x + 64.3 0.81 6.3 − 3661.0e −0.260 x + 59.7 0.93 4.7 − 514.6e −0.129 x + 73.5 0.93 5.2 4 − 264.1e −0.091 x + 66.8 0.82 6.1 − 3285.6e −0.227 x + 59.9 0.94 4.1 − 436.5e −0.106 x + 74.5 0.92 5.2 5 − 520.4e −0.145 x + 62.4 0.94 3.7 − 782.0e −0.151 x + 64.3 0.91 4.8 − 929.2e −0.154 x + 64.1 0.93 4.4 6 − 978.2e −0.231 x + 55.2 0.92 3.8 − 1800.1e −0.242 x + 58.6 0.92 4.3 − 531.5e −0.147 x + 73.4 0.95 3.9
the 6 lasers (obviously, wider variation in thickness would result in higher effect). Such error is considered as second order compared to the actual effect of the mois-ture content. The 3-mm-thick poplar veneers exhibit the smallest ellipse area, minor axis and major axis. These phenomena may be explained by the fact that the density of the 3-mm-thick veneer was the lowest compared to other thicknesses. It appears that the ellipse area, major axis and minor axis increase with the poplar density. This may also explain the lack of effect of the veneer thickness over the laser scat-tering profile in poplar. Lower correlation in 3-mm-thick poplar veneers may partly be explained by the presence of deeper lathe checks, which also interferes with the
measurement method. Purba et al. (2019), who studied the influence of veneer
thick-ness on veneer quality, showed that a higher peeling thickthick-ness generates deeper lathe checks on the veneer surface. These deeper lathe checks provoke larger checking problems during veneer drying.
It can also be seen that the ellipse area was bigger on poplar than on beech, which may be related to the difference in wood structure such as the wood density and anatomy between the two species. It was also observed that the standard deviation of poplar is higher, which indicates a larger variation in the laser scattering profile for this species.
The changes of the three ellipse parameters measured with the MC are in con-tradiction with previous studies stating that only the minor axis varies with the MC
(Simonaho et al. 2003; Juttula and Mäkynen 2013). Nevertheless, the study by
Jut-tula and Mäkynen (2013) was based on Monte Carlo simulations of a simple
homo-geneous matrix of cylindrical lenses surrounded by scattering and absorbing wall, which is similar to that of softwood structures. Indeed, beech and poplar wood
struc-tures are more complex than softwoods. The study by Simonaho et al. (2003) was
also carried out using a softwood species (Scots pine). In addition, their study was performed using re-humidified wood and not freshly cut wood such as that used in the present study.
The upper part of Fig. 4 explains how the major and minor axes were determined
in this study for a grayscale threshold of 80. Moreover, this upper part displays three
Table 3 Linear modeling of the relationship between the moisture content and the ellipse area of poplar veneer
The input parameter x is in mm2 and RMSE represents MC in % Laser Veneer thickness (mm)
1 2 3
Model r2 RMSE Model r2 RMSE Model r2 RMSE
1 6.534x–91.9 0.70 15.1 5.267x–81.4 0.62 13.9 12.363x–180.0 0.67 21.1 2 6.683x–118.2 0.86 9.9 6.36x–118.4 0.80 15.0 11.443x–188.2 0.66 22.4 3 7.642x–147.6 0.92 8.5 8.463x–176.8 0.81 13.1 11.954x–204.5 0.61 23.6 4 6.141x–130.5 0.89 9.8 6.828x–155.5 0.74 15.2 9.749x–188.0 0.67 21.6 5 5.651x–109.1 0.80 11.7 6.342x–132.5 0.85 12.3 10.499x–191.6 0.66 22.1 6 7.843x–126.4 0.79 12.2 5.695x–98.9 0.71 12.3 12.775x–202.4 0.70 19.8
different grayscale thresholds (80, 160 and 250) to illustrate how the choice of the threshold can be considered as critical since it strongly influences the ellipse feature. Indeed, a higher grayscale threshold makes the contrast of the ellipse shape at dif-ferent humidity levels less noticeable, while a lower grayscale threshold results in increased noise in the detection of the ellipse. In the lower part of the same figure, the statistical repartitions of the three ellipse geometrical parameters on one poplar
Table 4 Average value of ellipse profile in various classes of moisture content for each veneer thickness
Values in parentheses are standard deviations Species Moisture content
range (%) Measured parameter Veneer thickness (mm)1 2 3 Beech 0–20 Moisture content (%) 8.1 (4.3) 11.0 (6.5) 12.2 (5.4)
Ellipse area (mm2) 14.5 (1.7) 16.5 (1.7) 16.7 (2.0) Minor axis (mm) 3.2 (0.2) 3.3 (0.2) 3.3 (0.3) Major axis (mm) 5.8 (0.4) 6.2 (0.4) 6.3 (0.4) 20–40 Moisture content (%) 30.0 (5.5) 29.0 (6.0) 29.5 (5.7) Ellipse area (mm2) 17.8 (2.8) 18.6 (2.3) 19 (2.5) Minor axis (mm) 3.4 (0.3) 3.4 (0.2) 3.5 (0.3) Major axis (mm) 6.6 (0.6) 6.8 (0.5) 6.9 (0.5) > 40 Moisture content (%) 44.0 (2.6) 50.7 (6.5) 52.6 (6.2) Ellipse area (mm2) 21.8 (3.2) 24.6 (4.2) 25.3 (3.9) Minor axis (mm) 3.8 (0.3) 4.0 (0.4) 4.1 (0.4) Major axis (mm) 7.2 (0.5) 7.7 (0.6) 7.8 (.05) Poplar 0–20 Moisture content (%) 8.7 (5.9) 7.9 (5.8) 6.7 (5.6) Ellipse area (mm2) 19.8 (2.4) 21.8 (2.8) 19.2 (2.4) Minor axis (mm) 3.3 (0.2) 3.4 (0.2) 3.2 (0.2) Major axis (mm) 7.5 (0.5) 8.2 (0.7) 7.6 (0.6) 20–40 Moisture content (%) 29.5 (5.6) 29.1 (5.4) 30.3 (5.6) Ellipse area (mm2) 22.1 (3.2) 24.0 (3.2) 20.7 (2.6) Minor axis (mm) 3.4 (0.2) 3.5 (0.3) 3.3 (0.2) Major axis (mm) 8.1 (0.7) 8.7 (0.7) 7.9 (0.6) 40–60 Moisture content (%) 49.9 (5.6) 50.4 (5.6) 50.0 (5.9) Ellipse area (mm2) 25.6 (3.8) 26.8 (4.2) 21.0 (2.5) Minor axis (mm) 3.7 (0.3) 3.7 (0.3) 3.3 (0.2) Major axis (mm) 8.7 (0.7) 9.2 (0.8) 8.0 (0.6) 60–80 Moisture content (%) 69.9 (6.1) 69.3 (5.4) 69.6 (5.3) Ellipse area (mm2) 28.4 (4.6) 29.4 (4.5) 21.8 (2.4) Minor axis (mm) 4.0 (0.4) 3.8 (0.3) 3.4 (0.2) Major axis (mm) 9.0 (0.7) 9.6 (0.8) 8.0 (0.5) > 80 Moisture content (%) 89.4 (6.5) 92.2 (7.5) 101.7 (13.4) Ellipse area (mm2) 29.4 (4.0) 32.6 (4.2) 25.1 (3.8) Minor axis (mm) 4.1 (0.3) 4.0 (0.3) 3.7 (0.3) Major axis (mm) 9.0 (0.6) 10.1 (0.6) 8.4 (0.7)
veneer length (250 mm) and one laser are represented in two different ways (boxplot and sinaplot). It is apparent that the three parameters of the ellipse decrease, as does the moisture content of the poplar veneer.
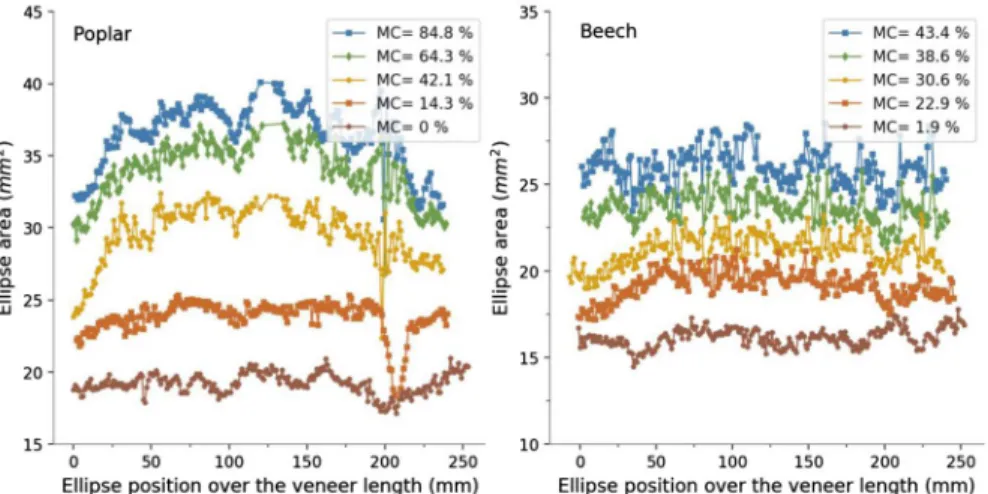
To better understand the interaction of the laser beam and the local moisture con-tent, the ellipse area variation over the veneer length and at various moisture contents
for both wood species is illustrated in Fig. 5. It shows that the area declines along with
the decrease in moisture content, or in other words, while the veneer is drying. As seen
Fig. 4 Example of an ellipse contour detection at various grey levels and definition of the ellipse geomet-rical descriptors: minor axis, major axis and the ellipse area (upper part) with their respective evolutions (lower part) over a single poplar veneer length and one laser beam (laser no 1) at 4 different moisture content levels while drying (130, 105, 70 and 15% MC)
from the same figure, there was a greater variation in ellipse area in poplar than in beech. Interestingly, such variation in poplar ellipse area appears to be less present at lower moisture content levels. This result may be explained by the fact that there were some water pockets in green veneer poplar, which dried up so that it was unobservable
at a lower moisture content level (Ward and Pong 1980). In general, those pockets have
higher MC than the adjacent normal wood, demonstrating, therefore, the accuracy of this innovative contactless MC measurement using the laser scattering profile.
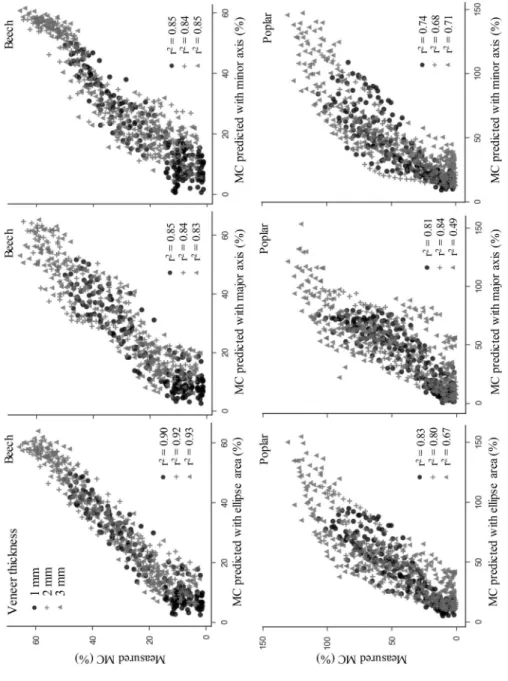
The results for modeling of veneer MC using ellipse area and other ellipse profiles
such as major and minor axes are summarized in Fig. 6. This figure plots the MC
pre-dicted with the models explained previously (Tables 2 and 3) and the actual MC
meas-ured. Figure 6 illustrates that not only the ellipse area but the major axis and minor axis
also show significant correlations with the veneer moisture content. Nevertheless, based on the coefficients of determination, the ellipse area remains the best ellipse parameter to predict the veneer MC. For both species and all measured parameters, the prediction was consistently better on 1-mm-thick veneer. Those results and the accuracy of the method have to be mitigated by the fact that for species exhibiting strong differences between earlywood and latewood, the elliptical shape variation induced by the moisture content could be hidden by the local density variation effect. For instance, it could be the case for Douglas-fir and spruce, but beech and poplar are generally considered as homogeneous wood regarding the differences between latewood and earlywood.
Conclusion
In this study, moisture content measurement using the laser scattering profile was investigated. Significant correlation was found between 3 ellipse geometrical param-eters and the actual global veneer moisture content. The major axis, minor axis and ellipse area all increase with the veneer moisture content. On the contrary, density
Fig. 5 Variation in ellipse area at various moisture contents along the length of a 1-mm-thick veneer of poplar (left) and beech (right)
Fig . 6 P otential of t he pr oposed me thod t o pr edict t he v eneer MC in beec h (t op r
ow) and poplar (bo
ttom r
might influence the ellipse parameters evaluated on poplar, but practically no effect was found for beech. Ellipse area is the best ellipse parameter to predict the mois-ture content for both beech and poplar veneers. This statement can be reasonably extended to any wood species. Further researches should be undertaken to establish the viability of the measurement using laser scattering profile in an online rotary lathe cutting process and to fully investigate the influence of density on the measure-ment of veneer MC using this method.
Acknowledgments This study was performed thanks to the partnership built by BOPLI: a shared pub-lic–private laboratory between Bourgogne Franche-Compté region, LaBoMaP and the company Fernand BRUGERE. The authors would also like to thank the Xylomat Technical Platform from the Xylomat Sci-entific Network funded by ANR-10-EQPX-16 XYLOFOREST. Finally, the authors would like to thank Fernand BRUGERE and the Carnot Institute ARTS for funding this research.
Compliance with ethical standards
Conflict of interest The authors declare that they have no conflict of interest.
References
Adedipe OE, Dawson-Andoh B (2008) Prediction of yellow poplar (Liriodendron tulipifera) veneer stiff-ness and bulk density using near-infrared spectroscopy and multivariate calibration. J Near Infrared Spec 16:487–496
Andersson M, Persson L, Sjöholm M, Svanberg S (2006) Spectroscopic studies of wood-drying pro-cesses. Opt Express 14:3641–3653
Antikainen T, Rohumaa A, Bulota M, Kotilahti T, Hughes M (2015a) Estimating birch veneer (Betula
pendula Roth) moisture content using infrared technology. Eur J Wood Prod 73:617–625
Antikainen T, Rohumaa A, Hughes M, Kairi M (2015b) Comparison of the accuracy of two on-line industrial veneer moisture content and density measurement systems. Eur J Wood Prod 73:61–68 Barański J, Klement I, Vilkovská T, Konopka A (2017) High temperature drying process of beech
wood (Fagus sylvatica L) with different zones of sapwood and red false heartwood. BioResources 12:1861–1870
Bradski G (2000) The opencv library. Dr Dobb’s J Software Tools 25:120–125
Briggert A, Hu M, Olsson A, Oscarsson J (2018) Tracheid effect scanning and evaluation of in-plane and out-of-plane fiber direction in norway spruce timber. Wood Fiber Sci 50:411–429
Ehrhart T, Steiger R, Frangi A (2018) A non-contact method for the determination of fiber direction of European beech wood (Fagus sylvatica L). Eur J Wood Prod 76:925–935
Hartley J (1984) The drying of hardwood veneers in New South Wales. NSW Timber Advisory Council, Sydney
James WL (1963) Electric moisture meters for wood. US Dept of Agriculture Forest Products Laboratory, Madison
Johansson J, Hagman O, Fjellner BA (2003) Predicting moisture content and density distribution of scots pine by microwave scanning of sawn timber. J Wood Sci 49:312–316
Juttula HJ, Mäkynen AJ (2013) Monte Carlo simulation of spatial reflectance pattern of translucent mate-rial with subsurface structure. In: Proceeding SPIE 8774, Prague, pp 87741R1–87741R8
Kienle A, D’Andrea C, Foschum F, Taroni P, Pifferi A (2008) Light propagation in dry and wet softwood. Opt Express 16:9895–9906
Lutz JF (1978) Wood Veneer: Log Selection Cutting and Drying. US Dept of Agriculture Forest Service, Madison
Marra AA (1992) Technology of wood bonding. Van Nostrand Reinhold, New York
Németh R, Ott Á, Takáts P, Bak M (2013) The effect of moisture content and drying temperature on the colour of two poplars and Robinia wood. BioResources 8:2074–2083
Nieminen S, Heikkinen J, Raty J (2013) Laser transillumination imaging for determining wood defects and grain angle. Meas Sci Technol 24:1–7
Nyfors E (2000) Industrial microwave sensors—a review. Subsurf Sens Technol Appl 1:23–43
Nyström J (2003) Automatic measurement of fiber orientation in softwoods by using the tracheid effect. Comput Electron Agric 41:91–99
Olsson A, Oscarsson J, Serrano E, Källsner B, Johansson M, Enquist B (2013) Prediction of timber bend-ing strength and in-member cross-sectional stiffness variation on the basis of local wood fiber orien-tation. Eur J Wood Prod 71:319–333
Olsson A, Pot G, Viguier J, Faydi Y, Oscarsson J (2018) Performance of strength grading methods based on fibre orientation and axial resonance frequency applied to Norway spruce (Picea abies L.), Douglas fir (Pseudotsuga menziesii (Mirb.) Franco) and European oak (Quercus petraea (Matt.) Liebl/Quercus robur L.). Ann For Sci 75:102
Purba CYC, Pot G, Viguier J, Ruelle J, Denaud L (2019) The influence of veneer thickness and knot proportion on the mechanical properties of laminated veneer lumber (LVL) made from secondary quality hardwood. Eur J Wood Prod 77:393–404
Simonaho S-P, Tolonen Y, Rouvinen J, Silvennoinen R (2003) Laser light scattering from wood samples soaked in water or in benzyl benzoate. Optik 114:445–448
Simonaho S-P, Palviainen J, Tolonen Y, Silvennoinen R (2004) Determination of wood grain direction from laser light scattering pattern. Opt Laser Eng 41:95–103
Soest J, Matthews P, Wilson B (1993) A simple optical scanner for grain defects. In: Fifth international conference on scanning technology and process control for the wood products industry, Atlanta, pp 25–27
Viguier J, Jehl A, Collet R, Bleron L, Meriaudeau F (2015) Improving strength grading of timber by grain angle measurement and mechanical modeling. Wood Mater Sci Eng 10:145–156
Viguier J, Bourgeay C, Rohumaa A, Pot G, Denaud L (2018) An innovative method based on grain angle measurement to sort veneer and predict mechanical properties of beech laminated veneer lumber. Constr Build Mater 181:146–155
Ward JC, Pong WY (1980) Wetwood in trees: a timber resource problem. US Dept of Agriculture Forest service, Portland
Zhou J, Shen J (2003) Ellipse detection and phase demodulation for wood grain orientation measurement based on the tracheid effect Opt Laser Eng 39:73–89
Publisher’s Note Springer Nature remains neutral with regard to jurisdictional claims in published