1
Analytical Procedure Validation and the Quality by
Design Paradigm
Eric Rozet1,*, Pierre Lebrun1, Jean-François Michiels1, Perceval Sondag1, Tara Scherder2, Bruno Boulanger1
Arlenda s.a., Liège, Belgium & Arlenda Inc, New-Jersey, USA
1
Arlenda S.A., 1 avenue de l’hôpital, 4000 Liège, Belgium
2
Arlenda Inc., 13 Ewing Drive, Flemington, New Jersey, USA
*
Corresponding author: Eric Rozet , Arlenda S.A., 1 avenue de l’hôpital, 4000 Liège, Belgium (+3243664397, Fax: +3243669683)
2 Abstract
Since the adoption of the ICH Q8 document concerning the development of pharmaceutical processes following a Quality by Design (QbD) approach, there have been many discussions on the opportunity for analytical procedure developments to follow a similar approach. While development and optimization of analytical procedure following QbD principles have been largely discussed and described, the place of analytical procedure validation in this framework has not been clarified. This article aims at showing that analytical procedure validation is fully integrated into the QbD paradigm and is an essential step in developing analytical procedure that are effectively fit for purpose. Adequate statistical methodologies have also their role to play: such as design of experiments, statistical modelling and probabilistic statements. The outcome of analytical procedure validation is also an analytical procedure Design Space and from it, control strategy can be set.
3
1
Introduction
The concept of quality by design (QbD) has been adopted in the pharmaceutical industry through several initiatives such as the FDA’s cGMP for the 21st Century [1] and Process Analytical Technology (PAT) [2] as well as with the regulatory documents ICH Q8 [3], Q9 [4] and Q10 [5] and the FDA guidance on Process Validation [6]. The general aim is to switch from the quality by testing (QbT) paradigm previously implemented in the pharmaceutical industry to a development aiming at improving the understanding of the processes and products and hence improving products quality, processes efficiency and regulatory flexibility.
QbD is not new and involves many quality and statistical tools and methods, such as statistical designs of experiments, multivariate statistics, statistical quality control, and so on. In order to raise the quality of pharmaceutical products, it has been recognized that increasing the testing of final products (i.e. QbT) is not adequate [7]. Instead, to increase the quality of pharmaceutical products, quality must be built into the products (i.e. QbD) as already done in many other industries. It requires understanding how variables involved in formulation and manufacturing processes influence the quality of the final product.
Analytical procedures are also processes and QbD should also be implemented for the development of analytical procedures. Several authors recently stated that Quality-by-Design (QbD) enables to develop analytical procedures in a systematic and scientific approach [8-12]. The understanding and identification of variables affecting method performance is achieved at an earlier stage [8-12]. According to ICH Q8(R2) [6], QbD can be seen as an optimization strategy combining Design of Experiments (DoE) and Design Space (DS).
However, developed analytical procedures are not directly usable in laboratories as they have to demonstrate that they are indeed fit for their purpose. This demonstration of fitness of purpose is generally achieved during the analytical procedure validation phase.
4 The aim of this article is to show that analytical procedure validation is fully integrated into the QbD paradigm and is an essential step in developing analytical procedure that are useful for their routine applications. Similar statistical methodologies are also implemented in analytical procedure validation among which are design of experiments and statistical modeling. The outcome of analytical procedure validation is also an analytical procedure Design Space and from it control strategy can be further defined.
2
Analytical Target Profile and analytical procedure validation
The development of a Quality by Design compliant analytical procedure starts by the definition of its Analytical Target Profile (ATP) which aims at defining the intended purpose of the procedure. The ATP compiles a set of characteristics defining what analyte or analytes will be measured, in which matrix, over what concentration range(s) as well as the required performance criteria of the method together with specifications for these last ones. These specifications and characteristics should be linked to the intended purpose of the analytical procedure. Examples of ATP for the interested readers can be found in the following references [8-11,13]. The requirements of quantitative performances included in the ATP are then the validation acceptance limits that must be reached by the analytical procedure during the validation phase. In addition, several authors have gone further in the definition of the ATP by including maximum acceptable risk of making wrong decisions using the results generated by analytical procedures [13].
3
Critical Quality Attribute in analytical procedure validation
The Critical Quality Attributes (CQAs) of the analytical procedure are the responses that are measured to judge the quality of the developed analytical procedures. CQAs are defined as “a
physical, chemical, biological or microbiological property or characteristic that should be within an appropriate limit, range, or distribution to ensure the desired product quality” [3]. For
5 the resolution (RS) or separation (S) criteria [12]. Other CQAs can be the run time of the analysis, signal to noise ratio, the precision and the trueness of the analytical procedure, the lower limit of quantification or the dosing range of the analytical method. These CQAs may be directly modeled through a multivariate (non-)linear model. However in other situations, the modeled responses may be different than the CQAs. The CQAs are obtained after the modeling of these primary responses. For chromatographic methods, the usual key CQA is resolution of the critical pair when optimizing selectivity. However resolution depends on the retention factor of the two chromatographic peaks involved. Therefore, the retention factors are directly modeled instead of the resolution. The resolution can then be computed from these modeled responses.
Nonetheless, CQAs are not limited to separative techniques or only related to the qualitative performance of the analytical procedure. Highly important assays in the development and control of pharmaceutical products are quantitative ones. Other examples than chromatographic quantitative procedures are immunoassays such as ELISA, q-PCR, relative potency assays, and so on. The final aim of any quantitative analytical procedures is to provide analytical results of adequate quality in order to make reliable decisions with them. Hence critical quality attributes for quantitative procedures should be at least related to their quantitative performances. The validation characteristics that are trueness, precision, linearity, range, LOQ of the analytical procedure and the accuracy of the results obtained by the procedure are key CQAs. They should be included into the definition of the ATP together with their respective acceptance values.
The validation phase of any quantitative analytical procedure is therefore fully in line with the QbD framework. The CQA that should be monitored during analytical procedure validation are measures related to random error (e.g. intermediate precision CV), systematic error (e.g. bias or recovery) or the combination of both which is total error.
6
4
Critical Process Parameters in Analytical Procedure Validation
Analytical Procedures Validation also involves several factors that are critical process parameters. The first main factor is concentration/amount/potency range over which the procedure is intended to quantify the analyte. This factor is a fixed factor and is represented by samples called validation standards or quality control samples of known concentration/amount/potency. By opposition, sources of variability that will be encountered during the future routine use of the procedure must be included in the validation design as random factors, such as operator, equipment, reagent batch or days. The combination of these sources of variability is generally called runs or series.5
Design of Experiments in Analytical Procedure Validation
ICH Q8 and FDA guideline highly promote the use of adequate design of experiments when developing pharmaceutical processes. The main designs used in analytical procedure validation are nested designs or (fractional) factorial designs or a combination of both. These designs are used to estimate variance components. To have precise estimations, the use of more than two levels of each factor is recommended. Nonetheless, the various sources of variation included into the analytical procedure validation are generally combined into “series” or “runs” to mimic the way analytical procedures are effectively employed routinely.
Suppose that for each of the ith concentration level of the validation standards, the number of runs is
J and that in each run, K replicates are performed. The validation experiments can then be described,
for each of the ith concentration level studied, by a one way Analysis Of Variance (ANOVA) random model with runs (or series) as random factor:
(
)
(
2)
, , 2 , , , , ,jk i i j ijk, i j ~ 0, i , ijk ~ 0, i i N N X =µ
+α
+ε
α
σ
αε
σ
ε Eq. 17 where
µ
i is the overall mean of the ith concentration level studied of the validation standard,j i i
α
,µ
+ is the mean in run j (j: 1 to J),ε
i ,jk is the residual error,σ
α2,i is the run-to-run variance, and2 ,i
ε
σ
is the within-run or repeatability variance, both for the ith concentration level.The overall variability of the analytical method is measured by the intermediate precision variance
2 , 2 , 2 ., .Pi i i I
σ
ασ
εσ
= + . All these parameters of the variance components model can be estimated byREML methods [14].
6
Design Space and Analytical Procedure Validation
In the ICH pharmaceutical development guideline Q8 [3], the DS is defined as “the multidimensional
combination and interaction of input variables (e.g. material attributes) and process parameters that have been demonstrated to provide assurance of quality”. Therefore, the multidimensional
combination and interaction of input variable corresponds to a subspace, so-called the DS, where assurance of quality has been proven. The main concept lying behind the ICH Q8 definition of DS is assurance of quality (also known as quality risk management). It has been already shown that mean response surface obtained during analytical procedure development do not define properly a DS as there is no assurance that the CQAs reach their acceptance limits. Instead probability maps answer this DS requirement properly [12,15].
Analytical procedure validation also allows defining a DS: it is the range of concentration where it has been demonstrated that the procedure provides assurance of quality results i.e.,
)
(
λ
µ
λ
π
=
P
−
<
X
−
T<
Eq. 2.The objective of the validation phase can be summarised to evaluate whether the reliability probability
π
that each future result will fall within predefined acceptance limits (λ) is greater than or equal to a minimum claimed levelπ
min [16]. The statistical problem here is two-fold: the probabilityπ
needs to be estimated and the uncertainty in its estimation must be taken into8 account when comparing it to
π
min. This is not an easy problem to solve since it has no exact small sample solution in frequentist statistics.Nonetheless, several approaches have been proposed to answer this aim.
6.1 β-expectation tolerance intervals
A first one is to compute β-expectation tolerance intervals of a defined coverage probability (e.g. 95%) at each concentration level of the validation standards using the one way ANOVA random model described in Eq. 1 and comparing it to preset acceptance limits as shown in Figure 1. Using this approach, each future result has at least 95% probability to fall within these acceptance limits. Lebrun et al. [17] have shown that β-expectation tolerance intervals are equivalent to Highest Posterior Density (HPD) intervals. A non-negligible amount of analytical procedures have been validated in such a way [16, 18-19]. Figure 1 shows an accuracy profile obtained for the validation of an analytical procedure depicting at each concentration level of the validation standards the 95% β -expectation tolerance interval.
9
Figure 1.: Accuracy profile, depicting at each concentration level of the validation standards the
corresponding 95% β -expectation tolerance intervals (blue dashed lines). The acceptance limits have been set at +/-15% around the known concentration values of the validation standards (black dotted lines). The red continuous line shows the relative bias of the assay. The green dots are the analytical
results of the validation standards expressed in relative error values.
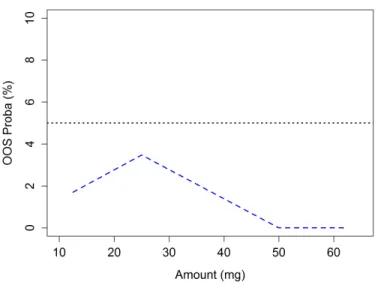
6.2 Out Of Specification probability
Another approach is to estimate the probability to obtain future results outside the preset acceptance limits (Out Of Specification, OOS). Dewé et al.[20] has proposed to compute this probability for results following the one way ANOVA random model described in Eq. 1. An example is shown in Figure 2 for the same previous analytical procedure. The DS is then the range of concentration over which this probability is smaller than a preset maximum value (e.g. 0.05). For each concentration level i this probability is computed as:
[
] [
]
( )
(
)
(
)
( )
(
)
(
)
+ + + − + < + + + + − − > = + < + − > = 1 ˆ 1 ˆ 1 ˆ 1 ˆ 1 ˆ 1 ˆ . ., , ., . , , , i i i P I i i T i i i P I i i T i T i i T i Beti i R N R K X f t P R N R K X f t P X P X Pσ
λ
µ
σ
λ
µ
λ
µ
λ
µ
π
Eq. 3.where J is the number of runs and K the number of replicates by series, N=JK. Xi is the mean concentration of the results obtained by the method for the ith concentration level and
i P I. .,
ˆ
σ
is the intermediate precision standard deviation for each ith concentration level. t(f) is a student distribution with f degrees of freedom computed based on the Satterthwaite approximation [21] andi
10 concentration level. The use of a Student distribution is justified as it is the predictive distribution in this model as demonstrated by Lebrun et al. [17].
Figure 2.: Risk profile, giving at each concentration rang of the validation standards the probability to
have future analytical results falling outside an acceptance value of +/- 15% around the known concentration values of the validation standards, i.e. OOS probability. The maximum OOS probability
has been set at 5%.
6.3 Continuous modeling across concentration range: the Bayesian way
If between-run variances and repeatability variances can be assumed homogenous across the concentrations levels of the validation standards, a single linear mixed model can be fitted to the validation data, including concentration as a fixed factor. The two previous approaches to define a DS can then be extended to this situation.
A less trivial situation would be to model the analytical procedure results over the concentration range in case of heteroscedasticity of between-run and/or repeatability variance. Determination of β
11 -expectation tolerance intervals or probability of OOS in these cases could be based on Bayesian approaches as no frequentist solutions are available [22].
In this context model Eq. 2 is rewritten as the following linear model with random slopes and intercepts and residual variance increasing with concentration:
ijk i T j j i T ijk u u X =
β
0 +β
1µ
, + 0, + 1,µ
, +ε
Eq. 4.where the subscripts i stands for the I concentration levels of the validation standards, j for the J number of series or runs and k for the K number of replicates per run.
µ
T ,i is the ith concentration level of the validation standard and is considered as a reference or conventional true value.θ
= 1 0
β
β
are the fixed effects. Additionally,
= j j j u u , 1 , 0
U are the random effects of the jth
runs and
are also assumed coming from a normal distribution:
j U ~ ( , ) 2 2 2 x u iN 0
σ
Σ Eq. 5.Finally,
ε
ijk is the residual error assumed to be independent and coming from a normal distributionof variance
σ
i2. This variance is also given as being dependent on the concentration level i. This phenomenon is frequently observed in real life situations. The general form of this variance function is a power of the concentration:(
µ
)
γ
σ
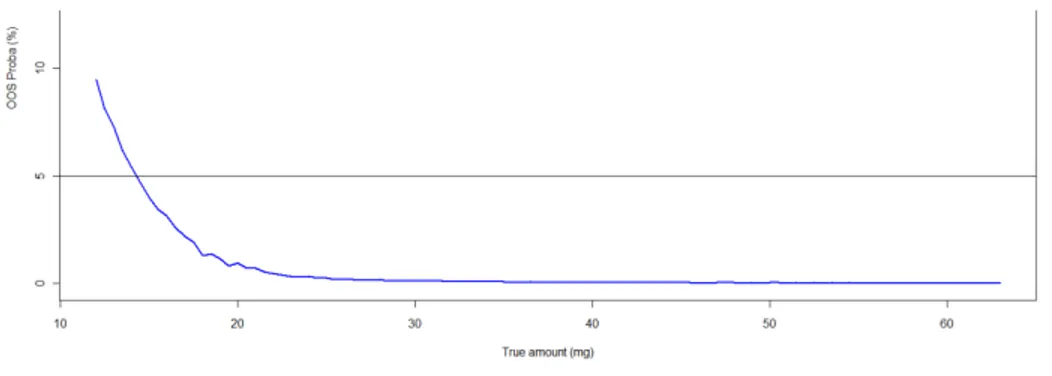
12 Figure 3 illustrates a probability profile for an analytical procedure using this model and estimated using MCMC simulations. It depicts the concentration range over which the analytical procedure is fit for its purpose. This range represents the analytical procedure validation Design Space.
Figure 3: Bayesian risk profile, modeling over the concentration range studied the probability to have
future analytical results falling outside an acceptance value of +/- 15% around the known concentration values of the validation standards, i.e. OOS probability. The maximum OOS probability has been set at 5%. The Lower limit of quantification corresponds to the concentration where the OOS probability crosses the maximum OOS probability value of 5%.
7
Control Strategy
Quality by Design development of analytical procedure is useless without defining control strategy to ensure that the procedure remains under control during its routine application and detect deviations. Validation Analytical procedure validation also allows defining a control strategy using quality control samples. Indeed, the experiments performed allow e.g. defining β-expectation tolerance intervals that can be used as initial control limits when building analytical procedure control charts [23]. Out of control methods can efficiently be detected and corrective actions realized by following the daily performances of analytical methods on such charts. Indeed, the use of β-expectation tolerance intervals ensures an adequate balance between consumer and producer risks [23].
13
8
Conclusion
Analytical procedure validation fits entirely within the QbD paradigm. In fact when comparing it with pharmaceutical development, analytical procedure validation can be seen at the stage 2 of process validation as defined by the recent FDA guideline [6]. Analytical procedure validation is then the performance qualification of the assay. In this context, seeing analytical procedure validation as an additional burden in analytical procedure development limited to the “ICHQ2 [24] check list” exercise should disappear: the validation phase is the confirmation of the usefulness of the developed procedure for its future daily application.
References
[1] U.S. Food and Drug Administration (FDA), Department of Health and Human Services, Pharmaceutical Quality for the 21st Century A Risk-Based Approach Progress Report, May 2007. http://www.fda.gov/AboutFDA/CentersOffices/CDER/ucm128080.html
[2] United States Food and Drug Administration (FDA), Guidance for industry PAT-A framework for innovative pharmaceutical manufacturing and quality assurance, FDA, 2004.
[3] International Conference on Harmonization (ICH) of Technical Requirements for Registration of Pharmaceuticals for Human Use, Topic Q8 (R2): Pharmaceutical Development, Geneva, 2009.
[4] International Conference on Harmonization (ICH) of Technical Requirements for Registration of Pharmaceuticals for Human Use, Topic Q9: Quality Risk Management, Geneva, 2005.
[5] International Conference on Harmonization (ICH) of Technical Requirements for Registration of Pharmaceuticals for Human Use, Topic Q10: Pharmaceutical Quality System, Geneva, 2008.
14 [6] U.S. Food and Drug Administration (FDA), Department of Health and Human Services,
Guidance for industry; Process validation: General Principles and Practices, January 2011.
[7] R.A. Lionberger, S.L. Lee, L. Lee, A. Raw, L.X. Yu, The AAPS Journal 10 (2008) 268.
[8] M. Schweitzer, M. Pohl, M. Hanna-Brown, P. Nethercote, P. Borman, G. Hansen, K. Smith, J. Larew, Pharm. Tech. 34 (2010) 52.
[9] J. Ermer, European Pharmaceutical Review, 16 (2011), 16.
[10] P. Nethercote, P. Borman, T. Bennett, G. Martin, P. McGregor, Pharm. Manufact. April (2010) 37.
[11] P. Borman, J. Roberts, C. Jones, M. Hanna-Brown, R. Szucs, S. Bale, Separation Science 2 (2010) 1.
[12] E. Rozet, P. Lebrun, B. Debrus, B. Boulanger, Ph. Hubert, Trac Trends In Analytical Chemistry 42 (2013) 157.
[13] E. Rozet, E. Ziemons, R.D. Marini, B. Boulanger, Ph. Hubert, Anal. Chem. 84 (2012) 106.
[14] Searle S.R., Casella. G. and McCulloch C.E., Variance components (1992), Wiley.
[15] J.J. Peterson, K. Lief. Stat. Biopharm. Res., 2 (2010) 249.
[16] Ph. Hubert, J.-J. Nguyen-huu, B. Boulanger, E. Chapuzet, P. Chiap, N. Cohen, P.-A. Compagnon, W. Dewe, M. Feinberg, M. Lallier, M. Laurentie, N. Mercier, G. Muzard, C. Nivet, L. Valat, J. Pharm. Biomed. Anal. 36 (2004) 579.
[17] P. Lebrun, B. Boulanger, B. Debrus, Ph. Lambert, Ph. Hubert, J. Biopharm. Stat. 23 (2013) 1330.
15 [18] Ph. Hubert, J.-J. Nguyen-Huu, B. Boulanger, E. Chapuzet, N. Cohen, P.-A. Compagnon, W. Dewé, M. Feinberg, M. Laurentie, N. Mercier, G. Muzard, L. Valat, E. Rozet, J. Pharm. Biomed. Anal., 45 (2007) 70.
[19] Ph. Hubert, J.-J. Nguyen-Huu, B. Boulanger, E. Chapuzet, N. Cohen, P.-A. Compagnon, W. Dewé, M. Feinberg, M. Laurentie, N. Mercier, G. Muzard, L. Valat, E. Rozet, J. Pharm. Biomed. Anal. 45 (2007) 82.
[20] W. Dewé, B. Govaerts, B. Boulanger, E. Rozet, P. Chiap, Ph. Hubert, Chemom. Intell. Lab. Syst. 85 (2007) 262.
[21] F.E. Satterthwaite, Psychometrika, 6 (1941) 309.
[22] E. Rozet, B. Govaerts, P. Lebrun, K. Michail, E. Ziemons, R. Wintersteiger, S. Rudaz, B. Boulanger, Ph. Hubert, Anal. Chim. Acta 705 (2011) 193.
[23] E. Rozet, C. Hubert, A. Ceccato, W. Dewé, E. Ziemons, F. Moonen, K. Michail, R. Wintersteiger, B. Streel, B. Boulanger, Ph. Hubert, J. Chromatogr. 1, 1158 (2007) 126.
[24] International Conference on Harmonization (ICH) of Technical Requirements for registration of Pharmaceuticals for Human Use, Topic Q2 (R1): Validation of Analytical Procedures: Text and Methodology, Geneva, 2005.