Probable Maximum Precipitation (PMP) in
Boreal Regions
Phase III
Analysis of rainfall data from automatic
stations in Canada
PROBABLE MAXIMUM PRECIPITATION (PMP) IN BOREAL REGIONS
PHASE III
ANALYSIS OF RAINFALL DATA FROM AUTOMATIC STATIONS IN CANADA
Final report
Research project INRS-EAU, SNC-SHAWINIGAN INC.
by Louis Mathier Jean-Pierre Fortin
Bernard Bobée Luc Perreault
Institut national de la recherche scientifique, INRS-Eau
2800 rue Einstein, Case postale 7500, SAINTE-FOY (Québec) G1V 4C7
Contract No. 9137 G 929 Rapport de recherche No R-410
ACKNOWLEDGEMENTS
The financial support provided by the Canadian Electrical Association is gratefully acknowledged. We would like to thank Mr M. Webb from the Atmospheric Environment Service of Environment Canada for the data. Finally, we owe thanks to Mr G. Jacques of the Ministère de l'Environnement, Direction des réseaux atmosphériques for his input to this study.
ABSTRACT
The present study was carried out to see if climatological data from automatic stations in Canada could be used to supplement information from conventional climatological stations for the estimation of probable maximum precipitation in the canadian boreal regions.
ln Northern Canada, a number of automatic stations have been installed since the 70's. Data from those stations, which may represent very valuable information, are still on the original recording support and are not available to potential users for various reasons mostly related to quality control.
Thus, in this report the emphasis will be put on the description of a methodology that can be used to verity the actual status regarding such data in Canada. No attempt is made to correct the data nor to interpret the errors in the records.
CONTENTS
1 INTRODUCTION . . . 1
2 QUALITY CONTROL PROCEDURE . . . 3
3 APPLICATION TO RAINFALL DATA. . . . . . . . . . . . . . . . . . . . . . . .. 7
3.1 Station and data description (refer to the notation in section 2) . . . 7
3.1.1 Definition of the study area (A. 1 ) . . . . . . . . . . . . . . . . . . . . .. 7
3.1.2 Variable selection (A.2) . . . 7
3.1.3 Assessment and location of the climatological automatic and manned stations (A.3 and A.4) . . . 7
3.1.4 Data description (A.5) . . . . . . . . . . . . . . . . . . . . . . .. 8
3.1.5 Selection of the automatic and manned stations for the data analysis (A.6 and A.7) . . . . . . . . . . . . . . . . . . . . . . . . . . . .. 9
3.1.6 Description of the selected stations (automatic and manned) (A.8) . ... 10
3.2 Data analysis based on the comparison between selected automatic and manned stations (B) . . . . . . . . . . . . . . . . . . . . . . . . . . . . . .. 10
3.2.1 Compatibility between data format (B.1) . . . . . . . . . . . . . . . . .. 11
3.2.2 Identification of the concomitant periods of records (B.2) . . . . . . . . . .. 11
3.2.3 Selection of rainfall events to be compared (B.3) . . . 11
3.2.4 Identification and examination of the type of errors based on graphical comparison of the selected events (B.4 and B.5) . . . 14
3.2.5 Conclusion on the data quality (B.6) . . . 25
4 CONCLUSIONS . . . . . . . . . . . . . . . . . . . . . . . . . . . . . . . . . .. 26
5 REFERENCES . . . . . . . . . . . . . . . . . . . . . . . . . . . . . . . . . . . . .. 27
LIST OF TABLES
Table 3.1 Environment Canada automatic and manned climatological stations in the study area . . . . . . . . . . . . . . . . . . . . . . . . . . . . . . .. 8 Table 3.2 List of the automatic and manned stations used for the data analysis .. 10 Table 3.3 Concomitant periods of records for the automatic and manned stations 11 Table 3.4 Selected rainfall events . . . 13
LIST OF FIGURES
Figure 3.1 Comparison of rainfall event # 14 (1991/06/10) for a) the Moosonee
and b) the Onakawana stations in Ontario. . . . 15 Figure 3.2 Comparison of cumulative rainfall for event # 5 (1989/06/23-26) for the
Flin Fion stations showing the underestimated cumulative rainfall at the automatic station. . . . . . . . . . . . . . . . . . . . . . . . . .. 16 Figure 3.3 Comparison of the last three days of rainfall event # 3 (1991/08/13-15)
for the Coronation stations with repeated values recorded at the
automatic station. . . . 18 Figure 3.4 Comparison of rainfall event # 13 (1991/09/14-16) for the Wiarton
stations showing the lack of correspondence between the number of periods with recorded rainfall. . . . 19 Figure 3.5 Comparison of cumulative rainfall for event # 2 (1991/07/3-7) for the
Coronation stations showing the overestimated cumulative rainfall at
. the automatic station. . . . 20 Figure 3.6 Comparison of rainfall event # 7 (1990/06/30) for the Flin Fion stations
showing the lack of correspondence between the hourly amount of
rainfall . . . 22 Figure 3.7 Comparison of the second day of rainfall event # 11 (1991/07/22) for
the Wiarton stations showing time lag between rainfall peaks. ... 23 Figure 3.8 Comparison of the first half of rainfall event # 10 (1991/07/2-4) for the
Wiarton stations showing nonsystematic time lags between rainfall
peaks . . . 24
1
INTRODUCTION
This final report presents a methodology used to analyze the climatological data from automatic stations in Canada. A contract was awarded to INRS-Eau to propose a methodology that can be used to analyze and verify the quality of hourly rainfall data from automatic climatological stations in Canada. The three weeks duration study has been performed from March to October 1993 at INRS-Eau in collaboration with SNC-SHAWINIGAN INC.
Probable maximum precipitation (PMP) studies require a high level of precision for the estimation of isohyetal patterns of a given rainfall event. The scarcity of weather stations in canadian boreal regions makes this task difficult to achieve. It follows that most PMP studies in Northern Canada are based on the transposition and maximisation of storms that occured in the southern part of the country. Since the 70's, a number of automatic climatological stations have been installed in Northern Canada. The data from the se stations may be used to supplement information from the conventional weather stations. Climatological data from automatic stations could represent very valuable information for the estimation of PMP. For various reasons, mostly related to quality control, these unpublished data are not available to potential users.
Thus, the main objectives of the project are: to propose a quality control methodology for such data in Canada, verify the actual status of rainfall data from Environment Canada automatic stations network in the boreal region, and to evaluate the possible use of historical hourly rainfall data from automatic stations to supplement information in the PMP estimation procedure. In this report, no attempt is made to correct the data nor to interpret the errors in the records.
ln the first section of the report, the general steps of the proposed quality control procedure for rainfall data from automatic stations are presented. The second section presents the results of the proposed methodology applied to hourly rainfall data for selected climatological automatic stations from Environment Canada in the canadian boreal region.
2 Analysis of rainfall data from automatic stations in Canada
Examples of detected errors are also given. Finally, conclusions and recommendations are presented according to the proposed methodology and to the value of historical hourly rainfall data from Environment Canada automatic stations to supplement information in the PMP estimation procedure (Gagnon et al. 1970, SNC 1992).
2
QUALITY CONTROL PROCEDURE
The general steps of the quality control procedure can be applied to any climatological data and are as follows:
A Station and data description
This part of the procedure includes the definition of the study area, the variable selection within the available climatological data, the assessment, location and selection of the climatological stations and the data description.
A.1 Defiinition of the study area
The study area should be clearly defined. In the case of PMP analysis the transposition zone boundary has to be delimited as weil (Gagnon et al. 1970, SNe 1992).
A.2 Variable selection
Selection of the relevant variables for the study within the available climatological data.
A.3 Assessment and location of the automatic stations
Assessment and location of the automatic stations in the study area defined in A.1. The assessment is performed according to federal and provincial agencies, and private companies.
A.4 Assessment and location of the manned stations
Assessment and location of the manned stations in the study area. Manned stations will be selected as control stations and will serve as a basis of comparison for the data analysis (see step A.7).
A.5 Data description
For each pair of automatic and manned stations selected in steps A.3 and A.4, the relevant variables selected in step A.2 have to be described according to the:
4 Analysis of rainfall data from automatic stations in Canada
data availibility, time step and unit of measurement; format of the data set;
period of record, number of years and missing data, or any other important characteristics.
A.6 Selection of the automatic stations for the data analysis
The automatic stations selected have to be representative of the study area. If the number of stations is small, ail stations can be used for the data analysis. This selection is subjective and must be performed according to the specifie goals of the study. Selection of stations with a long period of record will facilitate the data analysis.
A.7 Selection of the control stations for the data analysis
Each automatic station selected in A.6 is associated to a manned station to be used as a control station for the data analysis. 80th stations (automatic and manned) have to be located at the sa me place or as close as possible one from the other. If the two stations are located at the same place, the correspondence between the time series should be very good, which provided us with a valuable basis of comparison. If the two stations are located nearby, one has to take into account the time lag and possible variation of magnitude between series of observations. Since most of the automatic stations have experienced sorne timing problems with their buHt-in clock in the past, the evaluation of the time lag between series of historical data may be a very difficult task to achieve.
A.8 Description of the selected stations (automatic and manned)
Automatic and manned stations selected for the data analysis have to be described according to the:
type of gauge;
type of data transmission; type of data processing; maintenance program.
Section 2, Quality control procedure 5
8 Data analysis based on the comparison between selected automatic and manned stations
8.1 Compatibility between data format
The compatibility between data format has to be checked carefully, especially if the data come from different sources.
8.2 Identification of the concomitant periods of records
Since the analysis is mainly based on data comparison, the concomitant periods of observations will provide us with the data base to be used in the following procedure.
8.3 Selection of events or periods of observation to be compared
This selection is performed according to the specifie goals of the study and the selected variables.
8.4 Graphical comparison of the series of observations The first evaluation of the data is based on a:
plot of the chronological series for raw data;
plot of the chronological series for cumulative data.
At this stage of the study an evaluation of the data quality is possible. If the data appear to be of good quality, some statistical tools can be applied to the observations:
correlation analysis to study the spatial relationship between stations; autocorrelation analysis to study the temporal relationship of a given station; cross-correlation analysis of different orders to study the spatial and temporal relationship between stations.
8.5 Identification and examination of the type of errors
8ased on the results of 8.4, errors in the data have to be identified, examined and classified. Error types can be classified as systematic or nonsystematic errors. If systematic errors are recoverable, they can be corrected using the same procedure for ail stations. The methodology to be used for data correction is specifie to each error type and has to be developed accordingly. On the other hand, nonsystematic errors have to be analyzed on
6 Analysis of rainfall data from automatic stations in Canada
the basis of a case by case study.
B.6 Conclusion on the data quality
According to the data analysis, conclusions on the data quality and possible recommendations on their utilization are presented.
3
APPLICATION TO RAINFALL DATA
The qua lit y control procedure is applied to evaluate if hourly rainfall data from Environment Canada automatic climatological stations can be used to supplement information from manned climatological stations for the estimation of PMP in canadian boreal region. Each step of the methodology proposed in section 2 is used to iIIustrate the procedure and to verify the data for selected automatic climatological stations in the canadian boreal region.
3.1 Station and data description (refer to the
notation in section 2)
3.1.1 Definition of the study area (A.1)
The boreal zone in Canada, as defined in this study, includes: the Northwest Territories (NWT) at the exclusion of the Northem Canadian Islands; Alberta (ALB) at the exclusion of the Rocky Mountains; Saskatchewan (SAS), Manitoba (MAN), Ontario (ONT), Québec (QUE) and Labrador (LAB).
3.1.2 Variable selection (A.2)
The selected variable is the hourly rainfall data to be used in PMP analysis.
3.1.3 Assessment and location of the climatological automatic
and manned stations (A.3 and A.4)
ln this study, we will only consider climatological stations (automatic and manned) operated by Environment Canada. It is important to notice that several other automatic climatological stations in Canada are operated by provincial govemment agencies and private companies.
Within the study area, data from Environment Canada are available for 198 automatic climatological stations. According to expert meteorologists from Environment Canada, only the rainfall data recorded since 1988 are reliable. Thus, the number of stations with rainfall
8 Analysis of rainfall data from automatic stations in Canada
data records available since 1988 is reduced to 83.
On the other hand, there are 141 manned c1imatological stations still in operation in the study area. Table 3.1 shows the distribution by province of the automatic and manned climatological stations with rainfall data records.
Table 3.1 Province NWT ALB SAS MAN ONT QUE LAB Total
Environment Canada automatic and manned climatological stations in the studyarea
Number of automatic stations with rainfall data records Number of manned stations still in
since 1988 operation 6 30 12 23 14 17 12 12 25 36 12 23 2 0 83 141
3.1.4 Data description (A.5)
Sources of the data:
Automatic and manned stations data come from the Atmospheric Environment Service of Environment Canada.
Section 3, Application to rainfall data 9
Data availibility, time step and unit of measurement:
Hourly rainfall data in mm from the Canadian Climatological Data, file HLY03 or HLY21, element #123 for automatic and manned stations (data available on request).
Format of the data set:
A complete description of the data format is provided by the Atmospheric Environment Service (1987), Canadian Climate Center, Data Management Division, in "Documentation for the digital archive of canadian climatological data (surface) identified by element".
Period of record, number of years and missing data:
Informations on the period of records are provided by Environment Canada in a file entitled "Summary of HL Y RECORDS".
3.1.5 Selection of the automatic and manned stations for the
data analysis (A.6 and A.7)
Six automatic stations have been selected for the data analysis according to their representativeness of the study area and to their lenght of records. Each automatic station has been associated with a control station (manned station). Three control stations (Coronation A, Flin Fion A, Wiarton A, see Table 3.2) are located at the same place as the automatic stations. The three other automatic stations are associated to the nearest control station. Table 3.2 gives the list of the selected stations.
10 Analysis of rainfall data from automatic stations in Canada
Table 3.2 List of the automatic and manned stations used for the data analysis
Automatic station Manned station
Provo Name Number Lat Long. Name Number Lat
ALB Coronation (aut) 3011885 52° 04' 111°27' Coronation A 3011880 52° 04'
MAN Flin Fion 5050919 54° 41' 101° 41' Flin Fion A 5050960 54° 41'
ONT Wiarton 6119494 44° 45' 81° 06' Wiarton A 6119500 44° 45'
ONT Onakawana (aut) 607EP80 50° 36' 81° 25' Moosonee 6075425 51° 16'
QUE Chevery (aut) 7041382 50° 28' 59° 38' Natashquan A 7045400 50° 11'
LAB Alexis River (aut) 8500036 52° 39' 56° 52' Mary's Harbour 8502591 55° 18'
3.1.6 Description of the selected stations (automatic and
manned) (A.8)
Long. 111° 27' 101° 41' 81° 06' 80° 39' 61° 49' 61° 23'Informations on the type of gauge, data transmission, data processing and maintenance program were not available when this study was performed. Since, in this report, no attempt is made to correct the data nor to interpret the errors in the records, these informations are not essential.
3.2 Data analysis based on the corn parison
between selected automatic and manned
stations (8)
The data analysis is based on the comparison of concomitant records between selected automatic and manned stations. A special attention will be paid to the three pairs of stations located at the same place.
Section 3, Application to rainfall data 11
3.2.1 Compatibility between data format (B.1)
Data format from the digital archive of canadian climatological data for manned and automatic stations are fully compatible (Atmospheric Environment Service, 1987).
3.2.2 Identification of the concomitant periods of records (B.2)
Table 3.3 gives the concomitant periods of records for the selected stations.
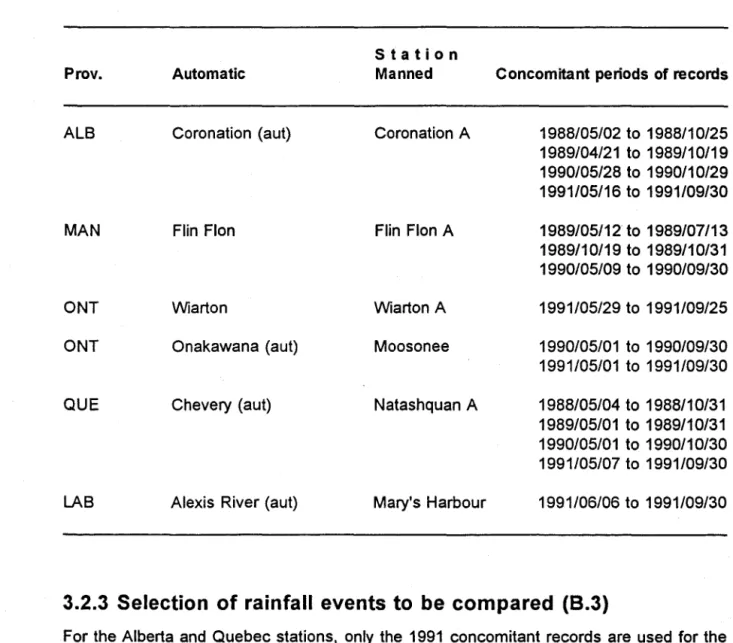
Table 3.3 Concomitant periods of records for the automatic and manned stations
Station
Provo Automatic Manned Concomitant periods of records
ALB Coronation (aut) Coronation A 1988/05/02 to 1988/10/25 1989/04/21 to 1989/10/19 1990/05/28 to 1990/10/29 1991/05/16 to 1991/09/30 MAN Flin Fion Flin Fion A 1989/05/12 to 1989/07/13 1989/10/19 to 1989/10/31 1990/05/09 to 1990/09/30 ONT Wiarton Wiarton A 1991/05/29 to 1991/09/25 ONT Onakawana (aut) Moosonee 1990/05/01 to 1990/09/30 1991/05/01 to 1991/09/30 QUE Chevery (a ut) Natashquan A 1988/05/04 to 1988/10/31 1989/05/01 to 1989/10/31 1990/05/01 to 1990/10/30 1991/05/07 to 1991/09/30 LAB Alexis River (aut) Mary's Harbour 1991/06/06 to 1991/09/30
3.2.3 Selection of rainfall events to be compared (B.3)
For the Alberta and Quebec stations, only the 1991 concomitant records are used for the analysis in order to reduce the data set. For the Onakawana and Moosonee stations, the rainfall events for 1990 have not been extracted, due to the poor quality of the data set at
12 Analysis of rainfall data from automatic stations in Canada
the automatic station (Onakawana). A systematic selection of rainfall events have been carried out on the remaining concomitant periods of records. The selection is performed in two steps:
a) ln the tirst step, every day of record, at the automatic and manned stations, having at least one hour of rainfall greater than or equal to 1,0 mm is selected. A distinct rainfall event has to be separated from another one by at least 24 hours without any period of hourly rainfall greater than 1,0 mm.
b) Ali rainfall events at the manned stations having a cumulative amount of precipitation greater than or equal to 20,0 mm over their respective duration have been considered for the analysis.
A total of 20 rainfall events have been selected for the comparison. The selected rainfall events are shown in Table 3.4.
Section 3, Application to rainfall data 13
Table 3.4 Selected rainfall events
Provo Automatic
Station Manned
ALB Coronation (aut) Coronation A
MAN Flin Fion Flin Fion A
ONT Wiarton Wiarton A
ONT Onakawana (aut) Moosonee QUE Chevery (aut) Natashquan A
LAB Alexis River (aut) Mary's Harbour
Rainfall event Number Date # 1 1991/06/23 to 26 #2 1991/07/03 to 07 #3 1991/08/11 to 15 #4 1989/05/19 and 20 #5 1989/06/23 to 26 #6 1989/06/28 and 29 #7 1990/06/30 #8 1990/08/30 and 09/01 #9 1991/05/30 # 10 1991/07/02 to 08 # 11 1991/07/21 to 23 # 12 1991/09/03 and 04 # 13 1991/09/14 to 16 # 14 1991/06/10 # 15 1991/06/13 to 15 # 16 1991/07/07 to 09 # 17 1991/07/27 and 28 # 18 1991/08/20 to 23 # 19 1991/09/25 to 27 # 20 1991/09/09 to 30
14 Analysis of rainfall data from automatic stations in Canada
3.2.4 Identification and examination of the type of errors based
on graphical comparison of the selected events
(8.4 and 8.5)
The graphical comparison of the selected events is based on plots of the time series at the manned and automatic stations for raw data and cumulative data. Error types are shown for selected examples. In ail graphs, missing data are indicated by a value of -1,0.
i) Erroneous values
The first type of errors is the presence of erroneous values in the automatic stations data set. Figure 3.1 shows a rainfall event (# 14) at the Moosonee manned station and the Onakawana automatic station. The maximum one ho ur rainfall is 0,7 mm at Moosonee and 199,0 mm at Onakawana for five consecutive hours, which is impossible. On the Onakawana automatic station file, ha If of the days with observed rainfall have at least one hour by record with an amount of rain greater than 100,0 mm. The same problem occurs in the data set for the Alexis river automatic station in Labrador (event # 20) and for two events (# 15 and # 19) at the Chevery automatic station in Quebec, giving a maximum one hour rainfall of 226,7 and 253,7 mm, respectively (figures not shown).
ii) Missing data
The second problem is caused by missing data in the file at the automatic station. In sorne cases, for a given event ail data at the automatic station are missing. As an example, for the 1991/05/30 event (# 9) at the Wiarton A station, 24,3 mm of rain has been recorded in four hours while ail data were missing in the file for that day at the Wiarton automatic station (figure not shown). Missing data have been detected for ail selected events.
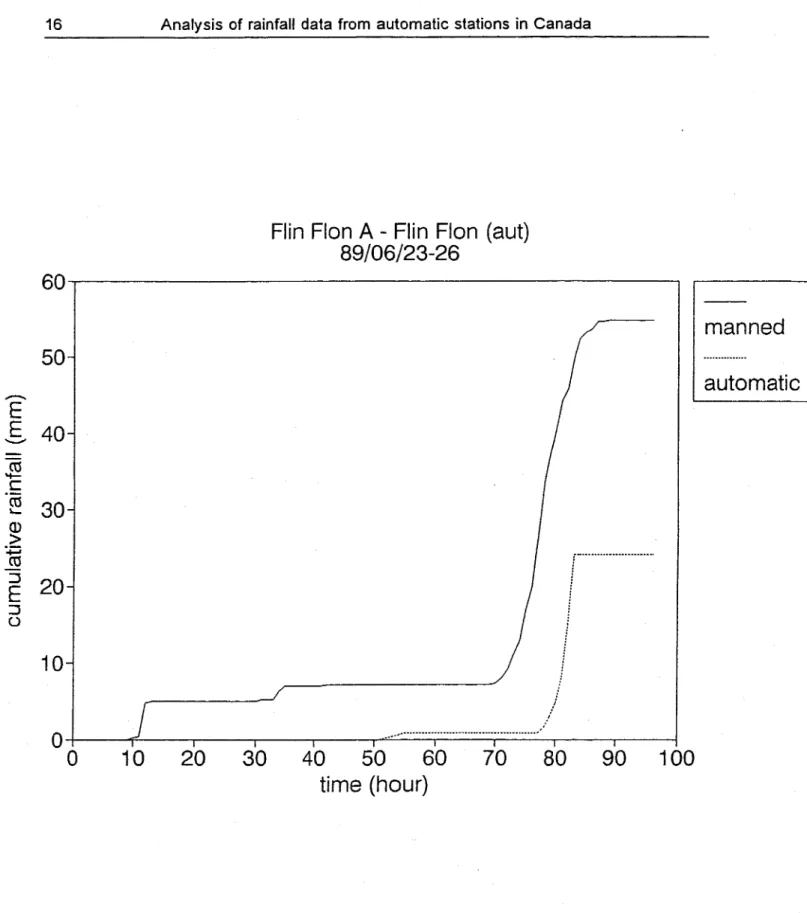
iii) Underestimation of the total rainfall
For 4 of the 20 selected rainfall events (# 4, S, 7, 17), there is an underestimation of the total amount of rainfall at the automatic station. Figure 3.2 shows an example of an underestimated rainfall event (# 5) for the Flin Fion stations.
Section 3, Application to rainfall data 15 Moosonee 91/06/10 01 y- ._._---06 o.,
.--E
o.S
c .~ 03 0.2 r r -0' , 2 3 • 5 6 1 8 9 '0 " '2 t3 14 IS 16 17,.
19 20 21 22 23 24 time (hour) IOmanned Onakawana (a ut) 91/06/10 , ,go. 7()- 50-J<>-E
'0-S
C 90 .~,.
50 30 '0 '0 , 2 3 • 5•
7 8 9 10 11'.
I l..
'5'.
",.
19 20 21 22 23 2' time (hour)1_
automaticFigure 3.1 Comparison of rainfall event # 14 (1991/06/10) for a) the Moosonee and b) the Onakawana stations in Ontario.
16 Analysis of rainfall data from automatic stations in Canada
Flin Fion A - Flin Fion (aut)
89/06/23-26
60~---~50
--
E
5
40
$
c
.~
30
CD>
~
E
20
::::Jo
10
~_ ... .,,/
O+---~~--~----~--~----~--"~-"'-""-""~"'-""-""-"'"_....
~... _
.... _
.... _
....
~----~--~o
10
20
30
40
50
60
70
80
90
1 00
time (hour)
manned
automatic
Figure 3.2 Comparison of cumulative rainfall for event # 5 (1989/06/23-26) for the Flin Flan stations showing the underestimated cumulative rainfall at the automatic station.
Section 3, Application to rainfall data 17
iv) No rainfall recorded at a station
On September 3 and 4, 1991 (event # 12), a total amount of 25,9 mm of rain has been recorded at the Wiarton automatic station. On the other hand, for the same event no rainfall was recorded (ail records at 0,0) at the Wiarton A manned station located at the same place (figure not shown).
v) Repetition of the sa me recorded values
At the automatic stations, recorded values have a tendency to be repeated for several hours (2 to 6 hours at the sa me rainfall value). Figure 3.3 gives an example of these repetitions (shown by an arrow) for the last three days of event # 3 at the Coronation stations. Figure 3.4 shows another example of the repeted number of periods with recorded rainfall at the Wiarton manned and automatic stations (event # 13). The number of periods with recorded rainfall at the automatic station can be two times greater than the one at the manned station. These repetitions are present in ail automatic stations data files selected for the study.
vi) Overestimation of the total rainfall
For 9 of the 20 selected rainfall events (# 1, 2, 3, 6, 10,11, 13,16, 18) there is a marked overestimation of the total amount of rainfall at the automatic station. Figure 3.5 gives an example of an overestimated rainfall event (# 2) for the Coronation stations.
18 18 16
-14 - '-12 ---.E
10E
l---
,-6 -4 -2-o
Analysis of rainfall data from automatic stations in Canada
~
L
•
48 59
Coronation A - Coronation (aut)
91/08/13-15
n.~
70 81 92time (hour)
1D
manned _
automatic
1
J
.111
I I I 103Figure 3.3 Comparison of the last three days of rainfall event # 3 (1991/08/13.,.15) for the Coronation stations with repeated values recorded at the automatic station.
...
E
E
---8 7 ;-6 ;-5 4 3 2-o
-1n
n
Ir
Section 3, Application to rainfall data
Wiarton A - Wiarton (aut)
91/09/14-16
••
.ru
r 1 1 1 1 1 1 1 1 1 1 1 1 1 1 1 1 1 1 1 1 1 1 1 1 20 26 32 38 44 50time (hour)
1D
manned _
automatic
19-
-1 1 1 1 1 56 62Figure 3.4 Comparison of rainfall event # 13 (1991/09/14-16) for the Wiarton stations showing the lack of correspondence between the number of periods with recorded rainfall.
.--..
E
E
"-'" CU-
c
"CU ~ Q)>
+=' CU ::JE
::J Ü20 Analysis of rainfall data from automatic stations in Canada
Coronation A - Coronation (aut)
91/07/3-7
140~---, _ _ _ _ _ _ _ _ _ _ _ _ _ _ • _ _ • ____ • _ _ _ _ u120-
100-, 80-fi
i60-
r
,40-20
r--/
j .. ____ .. __ .. ___ .. __ .. __ .. ____ .. __ .. ______________________________
.,1 0+---2~~==~=======r======~---.---~o
20
40
60
80
1 00
120
time (hour)
manned
automatic
Figure 3.5 Comparison of cumulative rainfall for event # 2 (1991/07/3-7) for the Coronation stations showing the overestimated cumulative rainfall at the automatic station.
Section 3, Application to rainfall data 21
vii) Lack of correspondence between the hourly amount of rainfall
Figure 3.6 shows an example of the lack of correspondence observed between the hourly amount of rainfall at the Flin Fion manned and automatic stations (event # 7). The hourly am ou nt of rainfall at the automatic station is much smaller than the one observed at the manned station.
viii) Time lag between rainfall peaks
Figure 3.7 gives an example of a 6 hours time lag between the two major rainfall peaks of the second day of event # 11 at the Wiarton manned and automatic stations. Ali rainfall events analysed in this study show a time lag between rainfall peaks.
ix) Nonsystematic time lag between rainfall peaks for a single event
Figure 3.8 shows two different time lags between rainfall peaks for the first half of event #
10 at the Wiarton stations. The two rainfall peaks at the right hand side of Figure 3.8 show an eight (or seven) hours time lag between manned and auto matie stations. On the left hand side of Figure 3.8, there is a six hours time lag between rainfall peaks. Thus, within a single rainfall event, the time lag between rainfall peaks may not be constant.
Since errors of type (v) and (viii) are present at ail automatic stations, they are classified as systematic errors. On the other hand, the number of data repetition (error v) and the time lag are not constant at each station. Thus, these errors cannot be corrected by using a single automatic procedure for each station. Ali other types of error identified in this section are nonsystematic and have to be treated as special cases.
7
2
1
22 Analysis of rainfall data from automatic stations in Canada
Flin Flan A - Flin Flan (aut)
90/06/30
-1-!---~--r--1 2 3 4 5 6 7 8 9 10time (hour)
1D
manned _
automatic
11 12Figure 3.6 Comparison of rainfall event # 7 (1990/06/30) for the Flin Fion stations showing the Jack of correspondence between the hourly amount of rainfall.
18 16 14 12 ...--...
E
10E
... C 8·co
~ 6 4 2 0Section 3, Application to rainfall data 23
Wiarton A - Wiarton (aut)
91/07/22
35 41 47
time (hour)
ID
manned _
automatic
Figure 3.7 Comparison of the second day of rainfall event # 11 (1991/07/22) for the Wiarton stations showing time lag between rainfall peaks.
16 14 12 10
--
E
E
8----
C 6'co
~ 4- 2-0 -224 Analysis of rainfall data from automatic stations in Canada
r···1
1a96
l
'
Wiarton A - Wiarton (a ut)
91/07/2-4
.... _ ... -.-... _ ... ~ : : la9 6 ~l
~ 11, ..•
1.1 .., I I I 1 1 1 1 1 1 I I I I I I 1 1 I I I 1 1 I I I I I I 1 1 1 1 1 1 5 16 27 38time (hour)
1D
manned _
automatic
1
~ la9 8 49Figure 3.8 Comparison of the first half of rainfall event # 10 (1991/07/2-4) for the Wiarton stations showing nonsystematic time lags between rainfall peaks.
Section 3, Application to rainfall data
25
3.2.5 Conclusion on the data quality (B.6)
ln general, the quality of hourly rainfall data from automatic stations is poor. Since the majority of types of error are nonsystematic, it is not possible to propose a general procedure to correct the data. If automatic station data appear to be valuable on the basic of a single event analysis which is often the case in PMP analysis, it is possible to identify and correct some of the errors. These corrected data can be used afterward to verify the occurence, the relative magnitude or the spatial extension of a given rainfall event observed at the manned station. Based on the errors detected at the selected stations used in this analysis, It is not recommended to use the automatic station data in the PMP calculation. Since the analysis has not been applied to the entire automatic station network, one has to be awarded that other sources of error may be present for other stations. Inversely, some of the Environment Canada automatic station rainfall data may be error free.
4 CONCLUSIONS
The proposed quality control methodology has been used successfully to detect and analyse hourly rainfall data from Environment Canada automatic stations. The general steps of the methodology, presented in section 2, can also be used to analyse other types of climatological data from automatic station.
Based on the analysis of the sampled events presented in section 3, general conclusions on the quality of rainfall data are as follows:
according to expert meteorologists from Environment Canada, rainfall data recorded before 1988 are not reliable;
quality of rainfall data from Environment Canada automatic station network is poor;
most of the errors detected by the quality control procedure are nonsytematic errors. Thus, it is not possible to propose a general procedure to validate historical rainfall data;
sorne of the historical data may be valuable on a case by case basis (single station, single event). These data have to be carefully checked and corrected;
single station and single event corrected data can be used in PMP analysis to verify the occurence, the relative magnitude or the spatial extension of a given rainfall event observed at the manned station. It is not recommended to use the auto matie station data in the PMP calculation.
At this time, historical rainfall data from Environment Canada automatic station network can not be used to supplement information from conventional climatologie stations. To be valuable in the future, automatic station rainfall data should be validated on a real time basis.
5 REFERENCES
Atmospheric Environment Service. 1987. Documentation for the digital archive of canadian
climatologica/ data (surface) identified by e/ement, Canadian Climate Center, Data
Management Division, 18 p.
GAGNON, R.-M., D.M., POLLOCK, et D.M. SPARROW (1970). Conditions météorologiques
critiques et crues exceptionnelles des rivières Chaudière et Saint-François.
Gouvernement du Québec, Ministère des richesses naturelles, Direction générale des eaux, Service de la météorologie, 121 p.
SNC. 1992. Complexe Nottaway-Broadback-Ruppert, Détermination des conditions
météorologiques critiques conduisant aux crues maximales probables. Avant-Projet,