2006-05 CONVERTING AND GENERALIZING MAPS INTO COMPACT SCALABLE VECTOR GRAPHICS FORMAT Valera PETKEVITCH Philippe APPARICIO
INRS
Urbanisation, Culture et Société
MARS 2006Converting and generalizing
maps into compact
Scalable Vector Graphics format
Valera PETKEVITCH and
Philippe APPARICIO
Spatial Analysis and Regional Economics Laboratory (LASER) Institut national de la recherche scientifique
Urbanisation, Culture et Société
Valera Petkevitch
Philippe Apparicio
Inédits, collection dirigée par Richard Shearmur : [email protected]
Institut national de la recherche scientifique Urbanisation, Culture et Société
3465, rue Durocher
Montréal (Québec) H2X 2C6 Téléphone : (514) 499-4000 Télécopieur : (514) 499-4065 www.inrs-ucs.uquebec.ca
TABLE OF CONTENTS
ABSTRACT/RÉSUMÉ... III
1. OVERVIEW... 3
2. DESCRIPTION OF THE SVG CONVERTER APPLICATION... 5
2.1 Quantization ... 5 2.2 Preliminary reduction... 5 2.3 Generalization ... 7 2.4 Compression ... 10 3. RESULTS ... 11 CONCLUSION ... 14 REFERENCES... 15
iv
List of figures
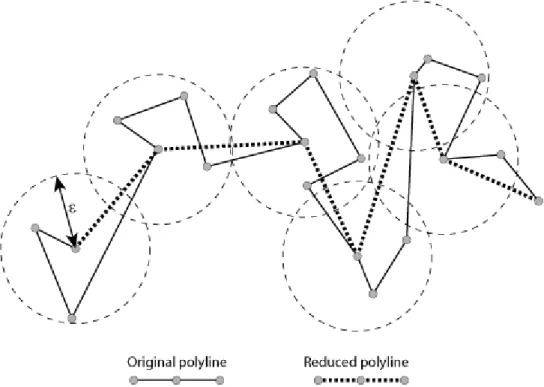
Figure 1 - Preliminary vertex reduction ... 6
Figure 2 - The problem of contiguous polygons during the generalization process ... 7
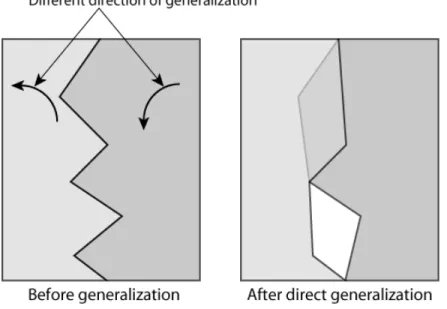
Figure 3 - The problem of different direction of polygon during the generalization process ... 7
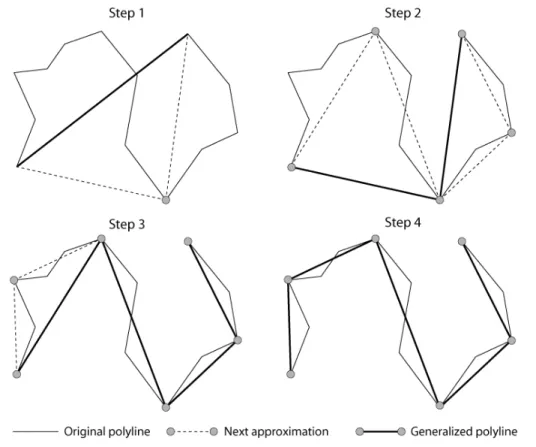
Figure 4 - Douglas-Peuker algorithm ... 9
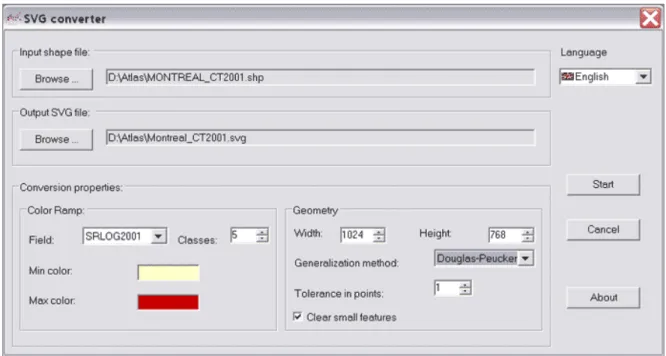
Figure 5 - Interface of SVG converter application ... 11
Figure 6 - Results using combination of modified Douglas-Peuker and gzip algorithms... 12
Table and Map Table 1 - Results using combination of modified Douglas-Peuker and gzip algorithms ... 12
Abstract/Résumé
Vector formats for Internet, such as Flash and Scalable Vector Graphics (SVG), represent good solutions to deploy rapidly interactive and dynamic maps on Internet. However, without a good level of generalization, the size of vector web-maps can be too large. To remedy this situation, we present, in this paper, a software utility called SVG converter which converts and generalizes vector maps (ESRI shapefiles) into SVG format. The conversion process is based on the combination of modified Douglas-Peuker and dictionary based compression algorithms, and keeps the topology of reduced geographical features. The high rates of compression obtained with the SVG converter tool demonstrate that this software utility produces compact and high quality web-maps in SVG format. Consequently, the SVG converter application could easily be integrated into cartographic web-applications to generate “on-the-fly” medium and small sizes maps.
Key words: cartography, interactive cartography, map generalization, Douglas-Peucker
algorithm, web-maps, web cartography.
* * *
Les formats vectoriels pour Internet tels que le Flash et le Scalable Vector Graphics (SVG) permettent de produire rapidement des cartes interactives et dynamiques sur Internet. Cependant, en l’absence d’un niveau de généralisation de la carte suffisant, la taille des cartes vectorielles demeure trop grande pour une diffusion sur Internet. Pour remédier à cette situation, nous présentons ici une application dénommée SVG converter qui convertit et généralise les fichiers géographiques Shapefile (ESRI) au format SVG tout en conservant la topologie des entités spatiales. Le processus de conversion et de généralisation est basé sur une combinaison des algorithmes de Douglas-Peucker et du dictionary based compression. Les taux de compression élevés obtenus avec l’utilitaire SVG converter démontrent que cette application produit des cartes pour le web compactes et de haute qualité au format SVG. Par conséquent, cette application pourrait être facilement intégrée au sein d’applications cartographiques sur Internet pour générer à la volée des cartes de taille réduite ou moyenne.
Mots-clés: cartographie, cartographie interactive, cartes sur Internet, généralisation
cartographique, algorithme de Douglas-Peucker. .
For the last ten years, two elements have largely contributed to increase the number of cartographic applications on Internet: the recent developments in interactive and dynamic cartography and the development of Internet technologies such as DHTML, Internet mapping technologies and vector formats for Internet.
The use of GIS and cartographic applications on the web and on smart mobile devices requires map transmission over relatively low-bandwidth and latency media. In this context the problem of transforming maps to a compact form emerges. Raster image compression algorithms are well known (Li & Gray, 2000; Nelson & Gailly, 1995; Redd, 2004; Vasudev & Konstantinos, 1997): however the development of interactive and animated mapping functions is very limited within raster mode.
Scalable Vector Graphics (SVG) is a XML-based standard format elaborated by the World Wide Web Consortium1, which allows the creation of interactive vector maps for
use on the web or on a variety of smart wireless devices. SVG interactivity includes transformation of coordinate systems, panning and zooming, object selection and clipping, animation and event handling, etc. Recently, Danzart et al. (2003) compared three solutions for creating dynamic and interactive web-maps i.e. Scalable Vector Graphics (SVG), Flash and MPEG-4. They conclude that SVG is the best solution for the deployment of cartographic applications on the Internet. However, generally, the conversion of geographic files into SVG without compression generates too large files. This has led us to develop a software utility which converts and generalizes vector maps (ESRI shapefiles) into a compact and high quality SVG format.
The aim of this paper is to present this application called SVG converter. First, we describe the combination of compression and modified generalization algorithms that produce high quality maps in SVG format. Next, we analyze the compression results obtained with our SVG converter tool.
1
1. OVERVIEW
The primary goal of the SVG converter is to produce high quality scalable maps in a compact form. This application can be downloaded free of charge from the Spatial Analysis and Regional Economics Laboratory website of INRS Urbanisation, Culture et Société (SAREL, or LASER2).
All source vector maps are represented by a set of polylines or a set of polygons which could have a large number of points. Mathematically, the problem of reducing the size of polygonal lines is equivalent to the problem of piecewise linear curve approximation. This is a classic problem in computational geometry and compression.
In cartography, vector maps are usually simplified according to some geometric tolerance, based on cartographic map scale (Weibel & Jones, 1998). This compression technique is known as map generalization (Monmonier, 1991). Two generalization algorithms are well known in the domain of cartography: vertex reduction (Hershberger & Snoeyink, 1992), having O(n) complexity, and Douglas-Peucker (DP) (Douglas & Peucker, 1973), having O(n2) complexity, where n is the number of points in the polyline or polygon. The principal aim of these algorithms is to produce the same visual representation of a map with a reduced number of polygonal points. According to this perceptual criterion, the DP method produces better quality maps vertex reduction, which gives fast, but coarser, results. However, due to web latency and to the O(n2) complexity of the DP algorithm, its direct implementation cannot be used for “on-the-fly” map generalization.
Another approach is to map compression is to reduce the size of maps by lossless compression algorithms. Usually this is possible because of global redundancies such as repeated chains of coordinates. However, this technique typically compresses source maps by 60 to70 % which is not enough for fast visualization of detailed web-maps. Thus, for high speed and high quality interactive web cartography it is necessary to use a combination of generalization and lossless compression.
2
http://www.ucs.inrs.ca/default.asp?p=grlaser. Note that LASER is the French acronym for the laboratory (Laboratoire d’analyse spatiale et d’économie urbaine).
2. DESCRIPTION OF THE SVG CONVERTER APPLICATION
The SVG Converter application was developed in C#, a language that works with the Microsoft.Net platform. The development of this application followed four steps which will be discussed in detail below:
− Quantization: polygonal lines or polygon coordinates are transformed to the integer Cartesian coordinate system;
− Preliminary reduction: elimination of small segments by fast vertex reduction algorithm.
− Generalization: vertex elimination by Convex Hull Speed-Up of DP algorithm (Hershberger & Snoeyink, 1992), having O(n log n) complexity in the worst case; − Compression: use of lossless general-purpose LZ77 dictionary-based compression
algorithm (Nelson & Gailly, 1995).
2.1 Quantization
Depending on hardware and web specific factors, there are several possibilities for map size reduction. Usually, each vertex of a polygon is represented by two floating point numbers as coordinates, but monitor screens, printers and plotters are all based on integer resolution. This is why, in a web environment, one must use an integer coordinate system to reduce map size up to sizeof(float)/sizeof(int). For most operational systems this ratio is 2. This simplification is easy to implement during SVG conversion as shown in the following pseudo-code:
Scale = (int)Min(Display.Width / (Polygon.BoundBox.maxX - Polygon.BoundBox.minX), Display.Height / (Polygon.BoundBox.maxY - Polygon.BoundBox.minY)); for (i = 0; i < Polygon.numberOfPoints; i++)
{
OutPoints[i].X = (int)((Polygon.Point[i].X - Polygon.BoundBox.minX) * Scale); OutPoints[i].Y = (int)(( Polygon.BoundBox.maxY - Point[i].Y) * Scale)); }
2.2 Preliminary reduction
Often, segments of a polyline are too close together and successive vertices may be displayed by the same screen pixel. Thus, vertices that are clustered on one pixel in web resolution may be reduced to a single vertex. We eliminate such vertices by fast O(n)
6
vertex reduction algorithm and then we use slower, but high-quality, Douglas-Peucker generalization.
Vertex reduction is a brute force algorithm for polyline simplification. For this algorithm, we choose an initial vertex. All vertices which are located close to the initial vertex at less than the minimum tolerance ε are eliminated. The next, not eliminated, vertex becomes the new initial vertex for further simplification of the polyline. We repeat elimination until we reach the end vertex of the polyline (see figure 1):
i = 0;
OutPoints[i++] = Polygon.Points[0]; // Copy the first point currentPoint = Polygon.Points[0];
for (j = 1; j < Polygon.numberOfPoints-1; j++) {
// implemented comparing squares of distances with the squared tolerance // to avoid expensive square root calculations
if (currentPoint.DistanceTo(Polygon.Points[j]) > Eps) { OutPoints[i++] = Polygon.Points[j]; currentPoint = Polygon.Points[j]; } }
OutPoints[i] = Polygon.Points[Polygon.numberOfPoints-1]; // Copy the end point
7
2.3 Generalization
The principal goal of generalization is to produce the same visual representation of a map with a reduced number of polygonal points. Douglas-Peuker and vertex reduction algorithms work well for polyline reduction; however they can’t be used directly for polygon reduction. The problems of polygons generalization consists in:
− The requirement to keep start and end points within a shared border (see figure 2) notwithstanding generalization tolerance.
− The requirement to have the same direction of generalization for polygons sharing a border (see figure 3).
Figure 2 - The problem of contiguous polygons during the generalization process
8
To avoid the first problem we have to split polygons into chains of polygonal lines. Every polygon issplit at start and end common points with every adjacent polygon (see pseudo-code below) (Weibel and Jones, 1998).
The second problem may be solved by using the same orientation for each polygon. In this case, generalization will give us the same results for adjacent polygons.
for (int i = 0, k = 0; i < ShapeFile.numRecords; i++) {
for (int j = i+1; j < ShapeFile.numRecords; j++) { if (ShapeFile.ConnectivityMatrix[i,j] == true) { FromToTable[k++] = GetStartAndEndCommonPoints(ShapeFile.Records[i], ShapeFile.Records[j]); } } }
We can now generalize polygons in the same manner as polylines. According to the perceptual criteria, the DP method produces better quality maps than the vertex reduction algorithm. The DP method uses the proximity of a vertex to an edge. The DP algorithm starts with a crude initial guess at a simplified polyline - a single edge joining the first and last vertices of the polyline (see figure 4). Then the remaining vertices are tested for closeness to that edge. If there are vertices further than a specified tolerance, then the vertex furthest from it is added in the simplification. This creates a new guess for the simplified polyline. Using recursion, this process continues for each edge of the current guess until all vertices of the original polyline are within tolerance of the simplification (see figure 4 and pseudo-code below).
In the worst case the time taken by the DP algorithm is O(nm), with an expected time of O(n log m), where m is the size of the simplified polyline. This is acceptable for a stand-alone converter, but for “on-the-fly” conversion on the web it is too slow. Fortunately, there is the Convex Hull Speed-Up version of DP (Douglas & Peucker, 1973) which has an O(n log n) complexity in the worst case. The improvement is achieved by speeding up selection of the farthest intermediate vertex from the current segment. Because the farthest vertex must be on the convex hull of the polyline chain between current segment nodes, we can compute this hull in O(n) time using Melkman's algorithm (Laszlo, 1996) and find the farthest vertex using an O(log n) binary search on the hull vertices. The Convex Hull Speed-Up version of DP only works for simple 2D planar polylines, but for maps it is sufficient. C++ implementation of this accelerated DP algorithm is described in detail in Sunday (2005).
9
Figure 4 - Douglas-Peuker algorithm
void DouglassPeucker(int Start, int End, double Eps, ref BitArray keptPoints) {
keptPoints.Set(Start, true); // keep the first point keptPoints.Set(End, true); // keep the last point maxDistance = double.MinValue;
int MaxPosition = Start; // initial index for furthest vertex from [StartPoint, EndPoint] segment StartPoint = Polygon.Points[Start];
EndPoint = Polygon.Points[End];
for (int i = Start + 1; i < End; i++) // find the furthest vertex from [StartPoint, EndPoint] segment
{
Distance = Polygon.Points[i].DistanceToSegment(StartPoint, EndPoint); if (Distance > maxDistance) { MaxPosition = i; maxDistance = Distance; } } if (maxDistance > Eps) {
DouglassPeucker(Start, MaxPosition, Eps, ref restedPoints); DouglassPeucker(iMaxPos, End, Eps, ref restedPoints); }
10
At the end of the generalization process we have to assemble the generalized polygonal lines back into polygons:
for (i = 0; i < ShapeFile.numRecords; i++) {
StartEndPositions = GetStartEndPositions(FromToTable, i); ShapeFile.Records[i].Generalize(StartEndPositions, Eps); SVGWriter.Write(ShapeFile.Records[i]);
}
2.4 Compression
After these simplifications have taken place, there may still be a lot of room for map size reduction. Simplification could be achieved by using relative instead of absolute coordinates (see pseudo-code below).
for (i = 1; i < Polygon.numberOfPoints; i++) {
Polygon.Point[i].X -= Polygon.Point[i-1].X; Polygon.Point[i].Y -= Polygon.Point[i-1].Y; }
Usually, this produces many redundancies such as repeated chains of relative coordinates, which allows high efficiency use of lossless dictionary-based compression algorithms, such as LZ77 (Ziv & Limpel, 1977) or LZW (Nelson & Gailly, 1995). Fortunately, SVG documents automatically support all SVG interactivity features for zipped SVG files. To compress SVG files we use the open source Gzip compression utility3 which is designed to be a free, general-purpose, legally unencumbered (not covered by any patents), lossless data-compression utility for use on virtually any computer hardware and operating system.
Gzip uses the LZ77 which is the "sliding window" compression algorithm also used in ZIP and PKZIP. The LZ77 algorithm works by keeping a history window of the most recently seen data and comparing the current data being encoded with the data in the history window. What is actually placed into the compressed stream are references to the position in the history window, and the length of the match. If a match cannot be found in the character itself, it is simply encoded into the stream after being flagged as a literal3.
The compression ratio of LZ77 depends on the distribution of repeated chains of relative coordinates. In our experience, generalized maps may be reduced an additional 5 to10 times. The compression ratio of LZ77 is generally much better than that achieved by LZW, Huffman coding, or adaptive Huffman coding (Nelson & Gailly, 1995).
3
3. RESULTS
To give an idea of the results which can be obtained with the SVG converter tool, we use it to convert and generalize a map of Canadian census divisions from ESRI shapefile format (ESRI, 1998) into SVG. Input map size is 4989 K and contains 507 polygonal regions. The application interface which is available in English and French is shown on figure 5. It is worth noting that the Color Ramp can be used to color the output map according to values in selected data fields and that the clear small features option is used to eliminate small regions that haven’t a common border with other regions (islands, lakes, etc).
Figure 5 - Interface of SVG converter application
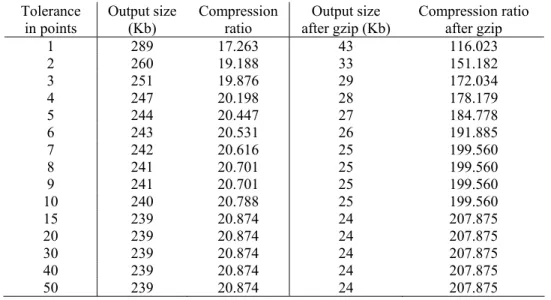
The quantization step (use of integer coordinate system) produces 2557 K of output SVG map (1.951 compression ratio). Preliminary generalization by vertex reduction gives 490 K of SVG file (10.182 compression ratio). The stage of DP generalization depends on selected geometric tolerance expressed in number of screen points. The results of DP generalization followed by LZ77 compression are shown in table 1 and on figure 6.
12
Table 1 - Results using combination of modified Douglas-Peuker and gzip algorithms
Tolerance
in points Output size (Kb) Compression ratio after gzip (Kb) Output size Compression ratio after gzip
1 289 17.263 43 116.023 2 260 19.188 33 151.182 3 251 19.876 29 172.034 4 247 20.198 28 178.179 5 244 20.447 27 184.778 6 243 20.531 26 191.885 7 242 20.616 25 199.560 8 241 20.701 25 199.560 9 241 20.701 25 199.560 10 240 20.788 25 199.560 15 239 20.874 24 207.875 20 239 20.874 24 207.875 30 239 20.874 24 207.875 40 239 20.874 24 207.875 50 239 20.874 24 207.875
Figure 6 - Results using combination of modified Douglas-Peuker and gzip algorithms
Figure 6, shows that after a certain level of tolerance it is impossible to increase compression ratio, because map generalization can’t remove points without breaking the map’s topology. Also, high levels of tolerance lead to map disproportion in archipelagos. This happens because there are no limits for point reduction in archipelagos; however points of continental areas can’t be removed because they are maintaining map topology. With fixed tolerance, the quality of the compressed map depends on the initial map’s topology, but for most maps a tolerance of 4-8 points is recommended.
13
Initial map of canadian division regions (ESRI’s shapefile, 4,989 K size)
Generalized map of Canadian division regions using combinaison of modified Douglas-Peucker and gzip algorithms (SVG file, 28 K size)
14
For example, the initial map of Canada (size of 4989 K) is depicted on the upper map of map 1 and the SVG generalized output with the modified Douglas-Peucker algorithm (4 points in tolerance) and compressed using gzip is shown below it. This output map has a size of 28 K: the compression ratio is 178, yet it looks very similar to the initial map.
CONCLUSION
Vector formats, such as Flash and Scalable Vector Graphics, are good solutions for deploying rapidly interactive and dynamic maps on the Internet. However, without a good level of generalization, the size of vector web-maps can be too large. The SVG converter application, described in this paper, enables the conversion and generalisation of ESRI shapefile maps into SVG format. The conversion process is based on the combination of modified Douglas-Peuker and gzip algorithms and maintains the topology of the reduced geographical features. Concretely, it contains four steps: quantization, preliminary reduction, generalization and compression.
The high rates of compression obtained with the SVG converter tool demonstrate that this software utility produces compact and high quality web-maps in SVG format. In fact, this utility is useful as a stand alone application and can be used for “on-the-fly” generation of medium and small sizes maps. Consequently, we hope that this open software will be useful for the cartographic research community in the deployment and development of web-cartographic applications.
References
DOUGLAS D., PEUCKER T., 1973, "Algorithms for the reduction of the number of points required to represent a digitized line or its caricature", The Canadian Cartographer, Vol. 10, No. 2, 112-122.
ESRI, 1998, ESRI Shapefile Technical Description. An ESRI White Paper, Redlands (California): Environmental Systems Research Institute Inc.
GATTASS M., FERREIRA C., VILAR A., GLASBERG M., 1999, "Efficient map visualization on the Web", Workshop Brasileiro de GeoInformática, Campinas, SP, Brasil.
HERSHBERGER J., SNOEYINK J., 1992, "Speeding Up the Douglas-Peucker Line-Simplification Algorithm", Proc 5th Symp on Data Handling, 134-143.
KRAAK M. J., 2001, "Web maps and atlases". In KRAAK M. J., BROON A. (Eds.), Web Cartography. Developments and Prospects. New York: Taylor & Francis, p. 135-140. LASZLO M., 1996, Computational geometry and computer graphics in C++, Prentice Hall.
LI J., GRAY R., 2000, Image Segmentation and Compression Using Hidden Markov Models, Kluwer Academic Publishers.
MONMONNIER M., 1991, How to Lie with Maps, Chicago: The University of Chicago Press.
NELSON M., GAILLY J.-L., 1995, The Data Compression Book, M&T Books, Second Edition. REED T., 2004, Digital Image Sequence Processing, Compression, and Analysis, CRC Press. SUNDAY D., 2005, "Polyline simplification", In Geometry Algorithm website,
http://geometryalgorithms.com/Archive/algorithm_0205/algorithm_0205.htm
VASUDEV B., KONSTANTINOS K., 1997, Image and Video Compression Standards, Kluwer Academic Publishers.
WEIBEL R., JONES C. B., 1998, "Computational perspectives on map generalization", GeoInformatica, Vol. 2, No. 4, 307–314.
ZIV J., LEMPEL A., 1977, “A universal algorithm for sequential data compression”, IEEE Transactions on Information Theory, Vol. 3, 337–343.