HAL Id: halshs-03010949
https://halshs.archives-ouvertes.fr/halshs-03010949v3
Preprint submitted on 2 Jun 2021
HAL is a multi-disciplinary open access
archive for the deposit and dissemination of sci-entific research documents, whether they are pub-lished or not. The documents may come from teaching and research institutions in France or abroad, or from public or private research centers.
L’archive ouverte pluridisciplinaire HAL, est destinée au dépôt et à la diffusion de documents scientifiques de niveau recherche, publiés ou non, émanant des établissements d’enseignement et de recherche français ou étrangers, des laboratoires publics ou privés.
Rehabilitation Care Centres’ Performance: Ownership
and patient’s social vulnerability
Carine Milcent
To cite this version:
Carine Milcent. Rehabilitation Care Centres’ Performance: Ownership and patient’s social vulnera-bility. 2021. �halshs-03010949v3�
WORKING PAPER N° 2020 – 73
Rehabilitation Care Centres’ Performance:
Ownership and patient’s social vulnerability
Carine Milcent
JEL Codes: I18.
Keywords: rehabilitation centres; performance; ownership; social vulnerability; inequity; dependence scores; in-death; discharge home
Rehabilitation Care Centres’ Performance:
Ownership and patient’s social vulnerability
Carine Milcent
1PSE - CNRS
[email protected]
Is there any difference in performance based on ownership of rehabilitation structures? In France, they can be private for-profit, non-profit or public. The type of ownership impacts the activity of the rehabilitation unit (as a public service mission), the management of healthcare institution staff and the institution healthcare’s organization. As a consequence, it may affect the performance. However, what do we mean by performance? This indicator is, in fact, multidimensional. In this paper, as performance indicators, I used improvement in dependence scores, in-death and discharge home. An administrative 2018-exhaustive rehabilitation stays is mobilized and four disorders are studied: stroke, chronic obstructive pulmonary disease (COPD), heart failure, and total hip replacement. For-profit rehabilitation unit outperform public sector hospitals. This result is obtained with a shorter daily patient care’s activity. I investigate mechanisms that cause differential benefits. Patient’s case-mix characteristics and hospital equipment as well as number of medical staff and non-medical staff, explain part of differences in performance based on ownership. Controlling for the social vulnerability (individual as well as French Ecological Deprivation Index) that impacts the profit of rehabilitation units, if less clear-cut results are found, nevertheless I show for-profit rehabilitation unit outperform public sector hospitals. Using counterfactual, even if the simulations show that performance’s difference is explained by patient’s social vulnerability composition, a significant part remains unexplained. Living in richest areas implies higher impact in terms of ownership performance differences that shrink. Results demonstrate existing inequalities in health care access in spite of a nearly free of charge healthcare access.
Key words: rehabilitation centres; performance; ownership; social vulnerability; inequity;
dependence scores; in-death; discharge home
Introduction
According to a study by Bachmann, rehabilitation among older patients has the potential to improve function, prevent permanent admissions to nursing homes, and to decrease mortality (Bachmann et al., 2010). Though, is the performance of rehabilitation units dependent on the hospital’s ownership? I approach this question using an exhaustive administrative database on rehabilitation centres stays in France. To set up how to measure the performance, a choice set of performance indices is used based on the literature. Besides, performance measurements being connected with patient’s medical case-mix and patient’s social vulnerability, these two dimensions are controlled for.
Selecting healthcare quality indicators is a complex issue (Mainz et al., 2003). There is a vast array of papers using and reporting the Delphi method (Boulkedid et al., 2011; Peter et al., 2016), some other papers do systematic review (Hayden et al., 2006), sometimes according to Preferred Reporting Items for Systematic Reviews and Meta Analyses (PRISMA) guidelines (Cooper, 2018). Some of the quality indicators can be adapted to a specific diagnosis, others are more generic as the paper by Farin et al. (2004). Moreover, the temporal dimension of the quality is also a dimension taken into account in some papers. Klokkerud et al. (2012) showed that about the health status, the rehabilitation benefits tend to fade out after twelve months.
Frequently used in the literature, “returning home after rehabilitation hospitalization discharge” is considered an indicator of successful rehabilitation and an indicator of quality of care (Kus et al., 2011;Graham et al., 2008). However, we have to mitigate the interpretation of the return home discharge as an indicator of quality of care. Studies showed that after a rehabilitation hospitalization, some patients, whatever the quality of care of the healthcare structure, do not have the ability to return to their initial living arrangement, and have to be readmitted to rehabilitation care facilities (Buijck et al., 2012; Chang et al., 2008; Chin et al., 2008). Therefore, I also add other performance indicators. The in-patient mortality’s rate is also used as a performance indicator. Quality of services, as outcome, is commonly approximated with mortality which is not a measure of quality per se, but rather an outcome partially determined by quality. The main reason is that mortality varies with the severity of illness and there is some heterogeneity in this severity across patients.1 As discussed by Urimubenshi et al. (2017), some
papers reported little or no association with a lower risk for mortality. This indicator has to be
1 A recent exception is Colla et al. (2016) who study the effect of hospital competition not only
considered in a set of performance indicators. The database contains information on improvement in dependence scores. Schnitzler et al. (2014) used these scores to evaluate the functional benefit of neurological specialized rehabilitation. I also use these scores as indicators of performance in addition of the discharge home and in-death indicators. Without any doubt, these metrics reveal different aspects in performance according to the hospital’s ownership. Difference in ownership’s quality may explain the difference in ownership’s performance. As defined by Mainz (2003a), quality indicators can be defined as “measurable elements of practice performance for which there is evidence or consensus that it can be used to assess the quality, and hence to change the quality, of care provided”. Quality is multidimensional and patient’s perception is one of them. Grande et al. (2008) focus on the subjective concepts of patients, physicians and social workers about quality in rehabilitation. The recent paper of Johansen et al. (2019) uses the Mainz (2003a) definition of three quality domains namely structure, process and outcomes. About the structure as quality domains, from the literature search, they identify publications related to “facilities”, “equipment”, “staffing”, “multidisciplinary competence”. In this paper, we focus on outcome measurement. However, I do not ignore this structure dimension of the quality. I then assess the effect on the performance measured through outcome indicators.
In France, after initial care in a acute unit, the patient may be discharged directly home or to be sent for rehabilitation center with specialized, coordinated rehabilitation or in a general or geriatric rehabilitation center. de Peretti et al. (2010) showed that most of patients admitted for rehabilitation went to geriatric rehabilitation center (GRC). Older patients with a severe initial impairment and those with cognitive impairments tend to be more frequently admitted to GRC. Decisions regarding admission to both types of rehabilitation are made by the specialist, following advice from a physiatrist when the patient is in an acute unit. Thedecision to be sent in a rehabilitation centers mostly depends on the networks between acute care and rehabilitation (de Peretti et al., 2010). In this paper, as sensitive analysis, I control for the acute care healthcare center of admission.
Can that be due to differences of patient case-mix admitted in the rehabilitation unit? More accurately, is that due to the patient severity of illness? In this paper, I control for demographic variables and charlson’s index at the patient’s level. Data’s selection is patients who were admitted in a rehabilitation center between January 1 and December 31, 2018 and discharged over the same period. The rehabilitation stays studied are stays for stroke, chronic obstructive
pulmonary disease (COPD), heart failure, and total hip replacement. The main diagnosis or procedure’s acts were first identified in the acute care database and then searched for in the 2018 Rehabilitation database using the anonymous identification number. Both databases contain information regarding the patient’s demographic characteristics (age, gender) as well as the main diagnosis and comorbid factors based on the International Classification of Disease, 10th revision. I also control for the patient’s social vulnerability that here is captured by the housing’s deteriotation or absence of housing, the loneliness (to live alone or to be declared to be isolated by the medical staff), the social coverage inadequacy as declared by the medical staff), the presence of a chronic disease.
For quantitative dependant variables as outcomes (dependence scores), I used an OLS model. Two multivariate analyses were carried out using logistic regression: One analyzed factors associated with in-hospital death and the other analyzed the factors associated with discharge home. I run incremental five models on these sub-databases. As a result, private for-profit rehabilitation hospitals perform better in terms of quality of care but part of this efficiency is explained by patient case-mix and by the composition of the medical staff. As a sensitivity analysis, we also set up sub-databases on the frequency of Major Diagnostic Category (MDC) stays. Main results are unchanged: if patient characteristics and hospital equipment as well as number of medical staff and non-medical staff explain part of this difference, it remains that for-profit rehabilitation unit perform better in terms of probability of death, probability to return-to-home and improvement in both, physical score and cognitive score. This result is obtained with a shorter daily care’s activity per patient. Then, I control for the social vulnerability, individual as well as French EPI _ Ecological Deprivation Index. The method for constructing a French European deprivation index has been developed by Pornet et al. (2012). The social vulnerability impacts the profit of rehabilitation units. If less clear-cut results are found, nevertheless I show for-profit rehabilitation unit outperform public sector hospitals. I also propose a counterfactual exercise to analyse sector’s differences in performance comparing patient’s social vulnerability composition. Using counterfactual, even if the simulations show that performance’s difference is explained by patient’s social vulnerability composition, a significant part remains unexplained. I also use simulations to explore differences in benefits between different levels of residence area of deprivation. Overall, living in richest areas implies higher impact in terms of ownership performance differences: the ownership performance differences shrink with the increase in deprivation level except for the poorest one. Results demonstrate existing inequalities in health care access in spite of a nearly free of charge healthcare access.
Data and Method
A population-based retrospective study of patients concerned by a rehabilitation unit stay after an acute care unit stay from all French hospitals in 2018 is conducted. Data were obtained from the French national hospital discharge diagnosis databases: PMSI MCO for Acute Care and PMSI- SSR for Rehabilitation care. These databases are separate, but patients are followed throughout their hospital stays using an anonymous identification number which is unique to each patient. The databases were obtained from the national hospital information agency (Agence technique de l’information sur l’hospitalisation _ ATIH). The extraction and analysis of the data for scientific research have been conducted with permission from the Hospital Statistics Agency (ATIH), which is the responsible authority for this data. Informed consent is not required, since the study was based on routinely collected de-identified administrative data, as regulated by French law. Data used for this study are reported to the National Data Protection Authority (CNIL number 2019-100001-166-140).
Patients with a main diagnosis or act for stroke, chronic obstructive pulmonary disease (COPD), heart failure, and total hip replacement were first identified in the acute care database. They then searched for in the 2018 rehabilitation database using the anonymous identification number. Day hospital patients were excluded. For each diagnosis or act (stroke, chronic obstructive pulmonary disease (COPD), heart failure, and total hip replacement), only the first major admission of the year was retained for each patient. The patients included were then searched for in the Rehabilitation database. Only those whose admission for rehabilitation began during the same month or the month following discharge from acute care were considered as compatible with post–acute care, namely the rehabilitation care and were included. Both databases contain information regarding the patient’s demographic characteristics (age, gender) as well as the main diagnosis and comorbid factors based on the International Classification of Disease, 10th revision. I suppressed the unfinished stays over the year 2019 and we kept the stays starting in year 2018 and ending in 2019. I restrain the sample to patients going to a rehabilitation center after an acute care stay2.
Databases contain information regarding the patient’s demographic characteristics (age, gender) as well as the main diagnosis and comorbid factors based on the International Classification of Disease (ICD), 10th revision. Databases contain information regarding patient’s social vulnerability as ICD-10 coded. Databases also included the postcode of individual’s residence.
Several variables were computed. Charlson’s index was calculated from the comorbid factors stated in the acute care database and adapted to the study: Pathologies relating to this index were taken into account according to published algorithms (Sundararajan et al. (2004), Quan et al., 2005), with the corresponding weightings3. I also control for French patient severity’s indicators
during her rehabilitation stays, as administratively included in the 2018 rehabilitation database. French EDI (European deprivation index) as developed by Pornet et al. (2012) is computed at the postcode level.
The rehabilitation center’s information used is the number of medical staff and non-medical staff as well as the number of categories in medical staff and in non-medical staff. In addition, the presence of a social worker in the rehabilitation unit is also used
I consider different outcomes: in-patient death, discharge home, and dependence scores. For dependence scores, I consider the two aggregated scores:
• The physical dependence score is from an aggregation of a list of items into 4 categories about the activities of daily living (ADL): 1- dressing and personal hygiene, 2- transfers/bed mobility, locomotion, 3- eating, 4- bowel and bladder control. The value is administratively recalibrated from 0 to 3.
• The cognitive dependence score is from an aggregation of the 2 factors: 1- communication, 2 - behaviour. The value is administratively recalibrated from 0 to 3. This information is available at the patient’s admittance and at the patient’s discharge. For each score, the difference between the value at the discharge and the value at the admission is computed. This difference is interpreted as the dependence score of improvement. The higher the value, the better the improvement.
The data also contains a score of rehabilitation and re-education (rr-score). This score is computed routinely according to the type of interventions of physiotherapists and other medical and non-medical staff. Each intervention is weighted as defined by two specific classification guides (named CSARR and CCAM). The score of rehabilitation and re-education is not limited in value. It is assessed in time. The rr-score describes patient care and not her/his health status. The higher the score is, the more intense the patient’s healthcare provided.
3 It is calculated using the comorbidities recorded at the point of the hip replacement admission. The Charlson
Index predicts ten-year mortality using 22 comorbidity conditions. Each condition is scored a 1, 2, 3, or 6, depending on the severity of the condition, and is calculated on the basis of all diagnoses recorded in hip replacement admission. I group patients into five categories: a score of zero for no comorbidities; a score of 1 for “very moderate comorbidities”; a score of 2 for “moderate comorbidities; a score of 3 for “severe comorbidities”; and a score of 4 for “very severe comorbidities.”
Five models are run, with Yd, one of the outcome as dependant variables as defined:
1. Yd=f(ownership/ u 1)
2. Yd=f(ownership, age group: less than 4, 5-24, 25-59, 60-69, 70-74, 75-79, 80-84, 85-90, over 90, Charlson’s index, severity, age group crossed Charlson’s index, age group crossed severity/ u2)
3. Yd=f(ownership, age group, Charlson’s index, severity, age group crossed Charlson’s index, age group crossed severity, provenance: nursing home, residence as well as entrance from emergency unit, the type of specialisation of the rehab. center: musculoskeletal disease, nervous system disease, cardiovascular disease, respiratory disease, endocrine and digestive system, oncology/haematology, severely burned patients, addictive behaviours, geriatrics, multi-purpose / u3)
4. Yd=f(ownership, age group, Charlson’s index, severity, age group crossed Charlson’s index, age group crossed severity, provenance: nursing home, residence as well as entrance from emergency unit, the type of specialisation of the rehabilitation center, and rehabilitation center information: type of health staff in percentage and in number of activities per stay (family doctor, cardiologist, endocrinologist, neurologist, paediatrician, pulmonologist, specialist of physical and functional rehabilitation, geriatrician, haematologist, psychiatrist, other medical staff, (masseur)-physiotherapist, speech therapist, nutritionist, ergo-therapist, psycho-motor therapist, assistant nurse, caregivers, nurse, specialised nurse, psychologist, educational staff, other non-medical staff, social workers) as well as equipment (isokinetism system, gait and movement analysis laboratory, equilibrium and posture exploration equipment, robotic walking assistance, robotic-assisted for rehabilitation plan, driving simulator, vehicle for person with reduced mobility, technical platform for urodynamic assessment, specific flat for dependants, room with living area, swimming-pool, balneotherapy, spine typology exploratory system, medical/surgical intervention ward for surgical dressings / u4)
5. Yd=f((ownership, age group, Charlson’s index, severity, age group crossed Charlson’s index, age group crossed severity, provenance: nursing home, residence as well as entrance from emergency unit, the type of specialisation of the rehabilitation center, and rehabilitation center information, patient’s vulnerability: housing’s deterioration: unsanitary, not adapted to patient’s needs, no personal housing ; homeless ; leaving alone in her/his housing ; to be isolated (no known family, no known relative) ; the social coverage: inadequacy as judged by the medical staff during the acute care stay or the rehabilitation care stay ; very low income, including patient covered by the National Heath Insurance for the most economically disadvantaged ones (CMU) ; Presence of a chronic disease ; French EDI/ u4)
Descriptive statistical analysis
Table 1 displays some preliminary statistics of the different outcomes for the sub-database considered: stroke, chronic obstructive pulmonary disease (COPD), heart failure, and total hip replacement. It also provides a summary of these different outcomes by provider type.
For these selected admissions, the number of stays is about 30’000 stays. The data includes public hospitals, not-for-profit hospitals (NFP) and for-profit ones (FP). About two thirds of patients with stroke or heart failure or COPD are admitted in a public sector rehabilitation hospitals, and about half of total hip replacement patients are admitted in FP rehabilitation hospitals. The average patient is aged over 70 years. (70 years for stroke, 70 years for COPD, 83 years for heart failure and 75 years for total hip replacement).
Charlson’s index measurement show that FP institutions’ patients are on average less severe than NHS hospital patients. It is however important to note that the market is not completely segmented by severity: a substantial fraction of public institutions’ patients do have comorbidities.
For French deprivation index, higher values imply higher deprivation The share of patients living in a Ecological Deprivation areas is much lower among FP rehabilitation centers’ patients than among public sector rehabiliotation centers’ patients. For total hip replacement, almost 20% of ALD patients were treated by public sector hospitals, compared to just 9.8% of FP facilities’patients. As documented by Chard et al. (2011) and elsewhere, by FP facilities’ patients are on average less deprived than patients that are treated by public sector hospitals.
About information on dependence score, the improvement during the stay is much more higher than for the cognitive dependence score whatever patients treated for stroke, COPD, heart failure or total hip replacement. Of these FP hospitals, they get on average even better improvement in dependence score.
The average patient treated by a FP hospitals has a probability of in-hospital mortality lower compared to those treated by an public hospital, whatever the pathology or procedure considered (for heart failure, the mortality rate is of 4.7% among patients admitted in a FP institute compared to almost on average, compared to 8.9% for those admitted in a public hospitals).
About home discharge, Table 1 shows that patients who choose FP rehabilitation centers have on average a higher probability to return to home following her rehabilitation stays. For stroke and heart failure, it reaches 4 out of 5 in the private hospitals versus less than 70% in the public providers.
I now turn on the patient’s score of rehabilitation and re-education (rr-score). In terms of ownership, private hospital mobilised longer time to patient care than public hospital whatever the disorder selected.
Results
I run 5-incremental regression analysis. First, each index measuring part of the performance is explained by the hospital’s ownership (Model 1). Then, to control for patient case-mix, we add the patient demographic variables as well as the level of severity as measured during the acute care stay. Using information from the acute care unit prevent from any coding difference from ownership that will affect the results (Model 2). Thereafter, we add controlled variables to control for the specialisation of the rehabilitation unit or institution that may impact the patient (Model 3). Besides, in Model 4, we also control for the hospital organization in terms of staff composition that may affect the patient care. In Model 5, I add the patient’s vulnerability. All regressions details are presented in Appendix. In the main text, we present Model 1, Model 4 and Model 5 (Table 2 &Table 3).
Stroke
Compared to public hospitals, private hospitals (for-profit and non-profit) have better outcome indices of dependence improvement, higher probability of return to home, lower probability of death (Model 1, Table 2). This difference is partly explained by patient clinical characteristics observed during the MCO stays and the rehabilitation stays as well as the medical staff and equipment in the rehabilitation’s center. I add these informations (Model 4, Table 2). For profit hospital outperforms public sector hospitals measured by these outcome indices.
Adding medical unit specialisation of rehabilitation centers after controlling for patient case-mix (Model 3) reduces differences in hospital ownership performance. However, performance remains significantly explained by the ownership: for-profit hospitals performing better than public ones.
What about not-for-profit hospitals? Without any control, NFP hospitals perform better than public ones. After adding patient characteristics and hospital characteristics (Model 4, Table 2), results are more ambiguous. The difference in performance between non-profit hospitals and public hospitals depends on the performance indicator that is considered. With the indicators of scores improvement, both physical and cognitive, there is no significant difference in performance between non-profit rehabilitation centres and public ones.
However, non-profit rehabilitation providers mobilised less care activity (rr-score) and they provide comparable (insignificant difference) improvement score as the public rehabilitation centres.
COPD
As Model 1 (Table 2) shows, for-profit hospitals perform better than public ones, as the performance is measured with the outcome indicators considered here (probability of mortality, probability of return-to-home, improvement in physical score, improvement in cognitive score). After taking into account patient case-mix and hospital characteristics (Model 4, Table 2), I show that performance between public rehabilitation unit and for-profit centres are much more similar. However, according to the results, for-profit hospitals get significantly better performance in improvement of dependence score. These results are obtained for less care mobilized on patients. From Model 1, results on difference in performance between non-profit hospitals and public ones are less straightforward. In terms of improvement in dependence score, non-profit hospitals get similar performance as public ones. NFP rehabilitation centers perform in terms of probability of return-to-home, probability of death. From Model 4, for NFP rehabilitation, I find not significant difference for improvement in physical dependence score hospitals and even worse improvement in cognitive score compared to public hospitals.
Comparing each model (from model 1 to Model 4), we observe that hospital’s characteristics in terms of equipment and medical staff as well as paramedical explained part of difference in ownership’s performance.
Heart failure
About ownership performance, comparable results as for stroke patients are found. Without any control, For-profit rehabilitation hospitals provide better performance that public rehabilitation ones (Model1, Table 2). After controlling for patient’s case-mix variables and hospital’
characteristics (Model 4, Table 2), I find that FP hospitals outperform public sector hospitals measured by improvement in dependence score, in-death and discharge home. However contrary to results on stroke patients, this result is obtained with no difference in care activity on average’s patient.
From Model 1 - Table 2, NFP hospital gets better performance that public rehabilitation unit whatever the disorder considered. When controlling for the whole set of independent variables but patient’s vulnerability variables (Model 4 presented Table 3), it appears that they perform better in terms of probability of death and probability to return-to-home. However, results do not reveal difference in improvement of score dependence.
The care activity is lower in NFP rehabilitation centers than in public rehabilitation ones.
Total hip replacement
Without any control, I show private for-profit rehabilitation hospitals provide a better performance than public rehabilitation units as measured by the selected outcomes (Model 1, Table 2). Note that before any control, there is no ownership difference in terms of in-hospital mortality measured at the patient’s level. After controlling for patient’s case-mix and hospital’s characteristics, results obtained confirm that FP hospitals outperform public hospitals in terms of improvement of dependence score and patient discharged from rehabilitation centers to home (Table 2, Model 4). Besides, whatever the model, the probability of mortality is not affected by the rehabilitation center’s ownership.
For non-profit hospitals, results are ambiguous as was the case with the other disorders selected and presented in this paper. In terms of dependence improvement, NFP rehabilitation centers perform better than public hospitals. However, no significant difference is shown for the probability of death or the probability of return-to-home.
Patient’s vulnerability as factor of performance difference
It turns out that performance differ from FP hospital to public sector hospitals. The difference in performance between NFP hospitals and public hospitals are more ambiguous. FP rehabilitation centers differ from public sector hospitals in selection of patient. I now present results from Model 5 where indicators of patient’s vulnerability are added in models. Results are displayed Table 3.
About the performance of the FP rehabilitation centers compared to the public one, the main result in on the change on the in-hospital mortality. Whatever the disorders selected, FP rehabilitation centers get similar results as the public ones in terms of in-death. Turning on return-to-home probability, the result is quite similar. Results are more robust for improvement of dependence score.
About the NFP rehabilitation centers, results remain quite ambiguous suggesting no clear difference in performance with the public rehabilitations ones.
Counterfactual simulations
FP rehabilitation centers outperform public ones. This raises the question whether gains from getting access to FP providers benefit patients equally, and whether existing inequalities are attenuated or exacerbated. Indeed, difference in performance may be due to difference in composition of patients admitted in terms of case-mix or vulnerability. Private hospitals may admit patients in better underlying health status than public hospitals. More accurately, private hospitals may admit patients with a higher potential of improvement during a rehabilitation stay than public rehabilitation centers. The selection process allows such discrimination. For-profit hospital can select patients, which cannot be done by public hospital. Counterfactual simulation analysis permits some indicative assessment of these questions.
Before computing counterfactual simulations, we may assume that the coding’s practice of patient’s diagnosis and co-morbidity in private institution (acute care unit as rehabilitation unit) differs public ones. To avoid such coding practice heterogeneity that will affect results, I focus on patients firstly admitted in public hospital during their acute care stay. I also exclude the severity information at the patient level during the rehabilitation stays.
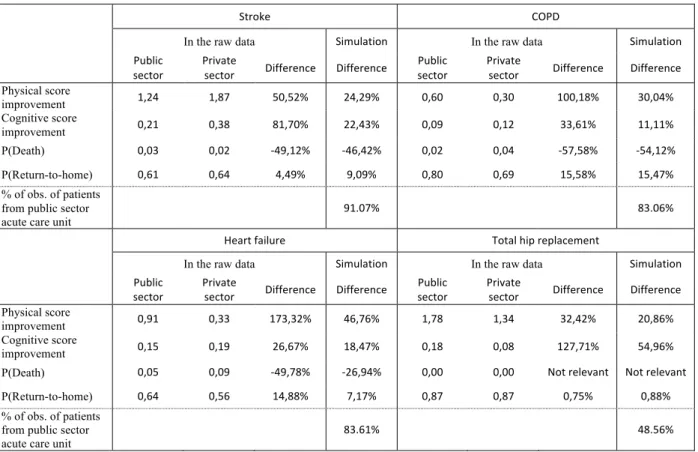
In step 1, I present simulation results for each performance selected here, and for each disorder considered (stroke, COPD, heart failure and total hip replacement). To explain the methodology, the performance indicator presented is physical dependence improvement for stroke (Table 4). The data show that patients treated by public rehabilitation hospitals have a mean stay of 1.24 of physical dependence improvement, compared to 1.87 of physical dependence improvement for patient treated by private sector rehabilitation centers. This better physical dependence
improvement for FP center patients may be explained by two factors. First, FP rehabilitation centers may deliver care more efficiently and discharge patients in better health status. Second, patients treated by FP centers may be healthier and less costly to treat.
To investigate the importance of the latter factor, I run the linear Model 5 of physical score dependence improvement for patients treated by public hospitals. I then use this model to predict the physical dependence improvement for all patients, given provider type. The mean is 1.24 of physical score dependence improvement for public hospital’ patients, and 1.42 physical score dependence improvement for patients treated by FP centers. This shows that the differences in the raw data are primarily driven by FP centers discharging patients with a better physical dependence improvement (explaining 71%4), but that patients treated by FP centers are
also slightly less complex (29% explained by patient’s sorting). Table 4 display results for each sub-database. Whatever the disorder and the performance’s indicators selected, we observe comparable results.
In step 2, I now present results of a series of counterfactual simulations for patient’s vulnerability composition. Specifically, with regard to access, I ask what would the relative benefits between better-off people and deprived ones, patients be but for differences in patient health. The simulations aim at exploring the relative contributions of this potentially important driver that are unrelated to hospital attributes and instead derive from patient socio-economic characteristics. By performance’s indicators, the value considered is the ones obtained from patients admitted in public sector hospitals. This value is contrasted with the one corresponding to the counterfactual situation where patients are admitted in public sector rehabilitation hospitals but treated, as they would have been admitted in FP rehabilitation hospitals. The predict value of dependent variable (one of the selected performance’s indicators) is computed using Model 5 where patients are treated by FP rehabilitation hospitals. The population used is the one actually admitted in a public sector hospital.
The vulnerability quintile used is the French EPI _ Ecological Deprivation Index quintile as defined by Pornet (2012) on 20180-INSEE databases. I equalize health across the socioeconomic distribution by giving all individuals the mean health across all health measures available
4 Difference in the raw data is : 1.87-1.24=.63 that is explained by patient sorting (1.42-1.24=.18, so .18/.63=29%) and performance measured by physical score dependence improvement (100% - 29%=71%)
(Gobillon and Milcent, 2019; Beckert and Kelly, 2021). I do not present result on the probability of death because of the weakness of result’s robustness due to few number of deaths.
Table 5 presents results. First of all, whatever the disorders selected and the performance used, patient admitted in a public sector hospital will benefit to be admitted in a private hospital. Second, I show differences in ownership’s performance in function of the level of deprivation. Living in richest areas implies higher impact in terms of ownership performance differences: the ownership performance differences shrink with the increase in deprivation level except for the poorest one. For the more deprived areas, being admitted in a private hospital rather than a public sector ones improve the physical dependence score as well as the probability to return-to-home as it has been observed for patients living in better-off areas. On contrary, for cognitive dependence score, I show a continuous declining of impact in performance’s difference between sector’s hospitals.
Sensitivity test
As a sensitivity analysis, I set up six samples set up on the frequency of Major Diagnostic Category (MDC) stays within 26 Major Diagnostic Category. These MDC selected are nervous system disorders, respiratory disorders, disorders of the circulatory system, disorders or impairment of musculoskeletal system and connective tissue condition, endocrine, metabolic and nutritional disorders (MC 10), disorders and mental illnesses. Without any doubt, these metrics reveal differences in performance according to the hospital’s ownership. Whatever the affection considered, these main results are unchanged.
Splitting into two groups the public rehabilitation centres (research public hospitals and other public hospitals), we find heterogeneity in performance between research public hospitals and other public hospitals.
Conclusion and discussion
In this paper, I studied hospital performance differences by ownership. I use exhaustive database for rehabilitation stays over the year 2018, for the entire French population. Four indicators of
quality in outcomes are used. The multiplication of outcomes makes results stronger. This study is carried out on four disorders: stroke, COPD, heart failure and Total hip replacement. I run 5-incremental regression analysis (hospital’s ownership (Model 1), patient case-mix variables (Model 2), specialisation of the rehabilitation unit (Model 3), rehabilitation centers’ staff composition (Model 4), patient’s vulnerability (Model 5). Doing so, I am able to identify the ownership’s difference in performance before and after control for these components. As a sensitivity test, I add an analysis on six affections. The main results are unchanged.
I show that private for-profit rehabilitation units or institutions perform better than public ones. However, this ownership difference in performance gets lower after taking into account the patient case-mix as well as the specificity of the hospital and the medical and non-medical staff composition. Besides, care activity per patient (measured by rr-score) is higher for for-profit hospitals compared to public ones when we do not control for any variables but it turns out to be lower after controlling for patient case-mix and hospital characteristics.
Without any control, non-profit hospitals are found as getting better performance. Yet, this result does not hold after controlling for patient case-mix and hospital characteristics and results are ambiguous.
However, private units or institutions are composed of hospitals that can select their patients (for-profit institutions) and public sector hospitals that cannot select their patients. Results obtained are they due to selection of patients? From Model 2, I control using patient case-mix variables but it may be that clinical variables to control for patient’s case-mix are not sufficient to control for all aspect of patient’s case-mix composition due to selection process. Besides, differences observed in patient’s case-mix composition may be due to differences in a way to code the patient severity between ownership? Therefore, I control for patient case-mix as recorded during the acute care unit stay to avoid potential systematic difference in coding from for-profit rehabilitation centres compared with public sector rehabilitation centres. As a robustness test, I restricted the sample to patients previously admitted in public hospitals for acute care. Results are unchanged. Therefore, it cannot be attributed to heterogeneity in the way to code patient severity.
How to explain the better performance in for-profit hospitals compared to the public ones as measured by the indicators used in this paper? Turning to the management, for-profit and
non-profit, hire medical staff on long-term contract or short-term contract or on an independent basis. In public hospitals, medical staff as well as part of the non-medical staff have public employee status. However, comparing for-profit hospitals with non-profit ones, I do not find a constant pattern. Another driver to explain variability in performance is the decision-making chain differs between the public sector and the private sector, which may explain part of this result that might be a way to explore. The social vulnerability is an important factor. It raises the question of social frailty and its place in the hospital’s performance beyond the clinical components’ interaction.
As a second step of this paper, I control for the social vulnerability (individual as well as French Ecological Deprivation Index) that impacts the profit of rehabilitation units. If less clear-cut results are found, nevertheless I show for-profit rehabilitation unit outperform public sector hospitals. I then propose counterfactual simulations. Even if the counterfactual simulations show that performance’s difference is explained by patient’s social vulnerability composition, a significant part remains unexplained. I also use simulations to explore differences in benefits between different levels of residence area of deprivation. Living in richest areas implies higher impact in terms of ownership performance differences: the ownership performance differences shrink with the increase in deprivation level except for the poorest one. Results demonstrate existing inequalities in health care access in spite of a nearly free of charge healthcare access. This paper raises concerns about the way such performance benefits are distributed across different types of patients. In particular, there is a consideration that the FP providers will exacerbate existing inequalities by location, socioeconomic status or underlying health. With capitated reimbursement, different compositions of patient risks between for-profit rehabilitation centers and public sector rehabilitation hospitals put public hospitals at a competitive disadvantage. This paper raises also the political question on funding to support patient’s social vulnerability.
References
Bachmann S, Finger C, Huss A, Egger M, Stuck AE, Clough-Gorr KM. Inpatient rehabilitation specifically designed for geriatric patients: systematic review and meta-analysis of randomised controlled trials. BMJ. 2010;340:c1718.
Beckert W, Kelly E. Divided by choice? For-profit providers, patient choice and mechanisms of patient sorting in the English National Health Service. Health Econ. 2021 Apr;30(4):820-839. doi: 10.1002/hec.4223. Epub 2021 Feb 5. PMID: 33544392.
Boulkedid R, Abdoul H, Loustau M, Sibony O, Alberti C. Using and reporting the Delphi method for selecting healthcare quality indicators: a systematic review. PLoS One. 2011;6(6):e20476.
Buijck BI, Zuidema SU, Spruit-van Eijk M, Bor H, Gerritsen DL, Koopmans RT. Is patient-grouping on basis of condition on admission indicative for discharge destination in geriatric stroke patients after rehabilitation in skilled nursing facilities? The results of a cluster analysis. BMC Health Serv Res. 2012;12:443.
Chang PF, Ostir GV, Kuo YF, Granger CV, Ottenbacher KJ. Ethnic differences in discharge destination among older patients with traumatic brain injury.Arch Phys Med Rehabil. 2008;89(2):231–6.
Chard, J., Kuczawski, M., Black, N., & van der Meulen, J.. (2011). Outcomes of elective surgery undertaken in independent sector treatment centres and NHS providers in England: Audit of patient outcomes in surgery. British Medical Journal, 343, d6404.
Chin R, Ng B, Cheung LP. Factors predicting rehabilitation outcomes of elderly patients with hip fracture. Hong Kong Med J. 2008;14(3):209–15.
Colla C., Bynum J., Austin A. and J. Skinner (2016), “Hospital competition, quality, and expenditures in the U.S. Medicare population”, NBER Working Paper 22826.
Cooper M, Rouhi A, Barber CEH. A systematic review of quality measures for inflammatory arthritis. J Rheumatol. 2018;45(2):274–83.
Farin E, et al. Quality assessment in rehabilitation centres: the indicator system 'Quality profile. Disability Rehability. 2004;26(18):1096–104.
Gobillon L. and Milcent C. “Competition and hospital quality: Evidence from a French natural experiment”, L. Gobillon and C. Milcent, working paper PSE No. 201706, 2017, extended streamlined version of The Competition Effect of a French Reform on Hospital Quality published in Competition Between Hospitals, Does it Affect the Quality of Care? book Editions Rue d'Ulm
Graham JE, Chang PF, Berges IM, Granger CV, Ottenbacher KJ. Race/ethnicity and outcomes following inpatient rehabilitation for hip fracture. J Gerontol A BiolSci Med Sci. 2008;63(8):860– 6.
Grande G, Romppel M. Subjective concepts of patients, physicians and social workers about quality in cardiac and orthopaedic rehabilitation. PsychotherPsychosom Med Psychol. 2008;58(2):51–7.
Hayden JA, Cote P, Bombardier C. Evaluation of the quality of prognosis studies in systematic reviews. Ann Intern Med. 2006;144(6):427–37.
Johansen, I., Klokkerud, M., Anke, A. et al. A quality indicator set for use in rehabilitation team care of people with rheumatic and musculoskeletal diseases; development and pilot testing. BMC Health Serv Res 19, 265 (2019).
Klokkerud M, Hagen K, Lochting I, Uhlig T, Kjeken I, Grotle M. Does the content really matter? A study comparing structure, process, and outcome of team rehabilitation for patients with inflammatory arthritis in two different clinical settings.Scand J Rheumatol. 2012;4:20–8. Kus S, Muller M, Strobl R, Grill E. Patient goals in post-acute geriatric rehabilitation--goal attainment is an indicator for improved functioning. J Rehabil Med. 2011;43(2):156–61.
Mainz J. Defining and classifying clinical indicators for quality improvement.Int J Qual Health Care. 2003;15:523–30.
Mainz J. Developing evidence-based clinical indicators: a state of the art methods primer. Int J Qual Health Care. 2003;15(Suppl 1):i5–i11.
Peter WF, Hurkmans EJ, van der Wees PJ, Hendriks EJM, van Bodegom-Vos L, VlietVlieland TPM. Healthcare quality indicators for physiotherapy Management in hip and Knee Osteoarthritis and rheumatoid arthritis: a Delphi study. Musculoskelet Care. 2016;14:219–32. Pornet C, Delpierre C, Dejardin O, et al. Construction of an adaptable European transnational ecological deprivation index: the French version J Epidemiol Community Health 2012; 66:982-989.
Urimubenshi G., 2, Peter Langhorne P., Dominique A Cadilhac D., 4, Jeanne N Kagwiza J., Wu O Association between patient outcomes and key performance indicators of stroke care quality: A systematic review and meta-analysis European stroke Journal, 2017 Volume: 2 issue: 4, page(s): 287-307
de Peretti, C, Nicolau, J, Josiane, H, Rémy-Neris, O, Woimant, F. Inpatient facilities after acute hospitalisation for stroke in France in 2007. Bull Epidemiol Hebdomadaire. 2010; 49-50:501-506.
Quan, H, Sundararajan, V, Halfon, P. Coding algorithms for defining comorbidities in ICD-9-CM and ICD-10 administrative data. Med Care. 2005;43:1130-1139.
Schnitzler A, Woimant F, Nicolau J, Tuppin P, de Peretti C. Effect of rehabilitation setting on dependance following stroke: An analysis of the French inpatient database. Neurorehabil Neural Repair. 2014; 28(1):36-44.
Sundararajan, V., Henderson, T., Perry, C., Muggivan, A., Quan, H., & Ghali, W. A. (2004). New icd-10 version of the charlson comorbidity index predicted in-hospital mortality. Journal of Clinical Epidemiology, 57(12), 1288–1294. http://dx.doi.org/10.1016/j.jclinepi.2004.
Ta
b
les
Table 1: Preliminary statistics for different outcomes, used as indicators of performance
Pathology/ Act Stroke COPD Heart Failure Total Hip Replacement Number of observations Whole set 30,585 27,421 34,284 33,205 For-Profit 29.1% 38.7% 33.3% 51.8% Non-Profit 23.7% 33.3% 16.6% 23.3% Public 47.3% 28.0% 50.0% 24.5%
Charlson’s index (score from 0 to 2)
Whole set 2.91 2.61 3.07 1.85
For-Profit 2.87 2.45 2.95 1.80
Non-Profit 2.88 2.55 2.97 1.84
Public 2.95 2.86 3.05 1.94
Patient’s vulnerability (score from -6 to 6)
Whole set .006 -.063 -.065 -.083
For-Profit -.126 -.072 -.296 -.226
Non-Profit -.019 -0.16 -.181 -.148
Public .095 .071 .127 .278
Age (years)
Whole set 70.5 yrs 69.5 yrs 83.4 yrs 74.8 yrs
For-Profit 71.2 yrs 70.3 yrs 82.3 yrs 74.8 yrs
Non-Profit 66.2 yrs 65.1 yrs 82.3 yrs 74.2 yrs
Public 72.3 yrs 73.6 yrs 84.6 yrs 75.5 yrs
Physical dependence score improvement (from the admission to the discharge)
Whole set 1.498 .399 .543 1.509
For-Profit 1.834 .581 .881 1.619
Non-Profit 1.618 .272 .510 1.528
Public 1.241 .298 .331 1.262
Cognitive dependence score improvement (from the admission to the discharge)
Whole set .266 .032 -.0206 .154 For-Profit .371 .093 .125 .189 Non-Profit .267 .004 -.071 .162 Public .205 -.022 -.099 .074 In-death Whole set .023 .022 .069 .001 For-Profit .016 .017 .047 .001 Non-Profit .014 .014 .050 .001 Public .032 .038 .089 .001 Discharged home Whole set .628 .769 .600 .892 For-Profit .632 .799 .640 .899 Non-Profit .653 .797 .633 .891 Public .614 .697 .563 .880 rr-score Whole set 103.262 62.222 34.716 68.489 For-Profit 105.165 66.031 39.255 68.757 Non-Profit 112.850 64.064 32.209 65.127 Public 97.296 54.760 32.528 71.085
PMSI database, Rehabilitation care, Year 2018
MODEL OLS MODEL OLS MODEL LOGIT MODEL LOGIT MODEL OLS MODEL Coefficients Coefficients Coefficients Coefficients Coefficients Stroke Physical score improvement Cognitive score improvement P(Death) P(Return-to-home) Score rr
MO D E L 1 For-Profit 0.593*** (0.0391) 0.166*** (0.0205) -0.649*** (0.0953) 0.0797*** (0.0279) 7.869*** (1.013) Non-Profit 0.376*** 0.0618*** -0.845*** 0.168*** 15.55*** (0.0414) (0.0218) (0.111) (0.0300) (1.083)
Public Reference Reference Reference Reference Reference
MO D E L 4 For-Profit 0.166*** (0.0479) 0.0678** (0.0266) -0.391*** (0.123) 0.0871* (0.0452) -9.445*** (1.107) Non-Profit 0.0518 -0.0185 -0.217 -0.135*** -3.364*** (0.0491) (0.0273) (0.133) (0.0465) (1.136)
Public Reference Reference Reference Reference Reference
COPD Physical score improvement Cognitive score improvement P(Death) P(Return-to-home) Score rr
MO D E L 1 For-Profit 0.283*** (0.0285) 0.115*** (0.0166) -0.832*** (0.0957) 0.546*** (0.0347) 11.27*** (0.770) Non-Profit -0.0260 0.0258 -1.038*** 0.533*** 9.305*** (0.0294) (0.0171) (0.107) (0.0360) (0.796)
Public Reference Reference Reference Reference Reference
MO D E L 4 For-Profit 0.262*** (0.0360) 0.0453** (0.0213) 0.0475 (0.123) 0.0580 (0.0517) -1.139 (0.749) Non-Profit -0.0442 -0.0495** -0.0404 0.0399 -2.996*** (0.0384) (0.0227) (0.137) (0.0564) (0.797)
Public Reference Reference Reference Reference Reference
Heart failure Physical score improvement Cognitive score improvement P(Death) P(Return-to-home) Score rr
MO D E L 1 For-Profit 0.549*** (0.0283) 0.224*** (0.0161) -0.676*** (0.0516) 0.322*** (0.0248) 6.727*** (0.583) Non-Profit 0.178*** 0.0282 -0.607*** 0.293*** -0.318 (0.0356) (0.0202) (0.0662) (0.0315) (0.738)
Public Reference Reference Reference Reference Reference
MO D E L 4 For-Profit 0.292*** (0.0342) 0.135*** (0.0196) -0.197*** (0.0645) 0.199*** (0.0343) -0.0817 (0.554) Non-Profit 0.0306 -0.0233 -0.349*** 0.196*** -1.794*** (0.0381) (0.0217) (0.0750) (0.0389) (0.616)
Public Reference Reference Reference Reference Reference
Total hip replacement
Physical score improvement
Cognitive score
improvement P(Death) P(Return-to-home) Score rr
MO D E L 1 For-Profit 0.357*** (0.0302) 0.115*** (0.0122) -0.385 (0.377) 0.188*** (0.0423) 2.328*** (0.687) Non-Profit 0.266*** 0.0881*** -0.629 0.0997** -5.958*** (0.0357) (0.0144) (0.500) (0.0497) (0.812)
Public Reference Reference Reference Reference Reference
MO D E L 4 For-Profit 0.171*** (0.0321) 0.0964*** (0.0135) -0.123 (0.432) 0.301*** (0.0606) 0.125 (0.508) Non-Profit 0.0928** 0.0749*** -0.519 0.0463 -1.632*** (0.0369) (0.0156) (0.570) (0.0698) (0.584)
Public Reference Reference Reference Reference Reference
Table 3: Controlling for patient’s vulnerability (Model 5) _ Stroke, COPD, Heart failure, Total hip replacement
MODEL OLS MODEL OLS MODEL LOGIT MODEL LOGIT MODEL OLS MODEL
Coefficients Coefficients Coefficients Coefficients Coefficients Stroke Physical score improvement Cognitive score improvement P(Death) P(Return-to-home) Score rr
MO D E L 5 For-Profit 0.115**(0.0560) 0.0479(0.0312) -0.353**(0.143) 0.0368(0.0527) -9.408*** (1.296) Non-Profit 0.0470 -0.0189 0.159 -0.116** -3.452*** (0.0492) (0.0274) (0.132) (0.0463) (1.138)
Public Reference Reference Reference Reference Reference
COPD Physical score improvement Cognitive score improvement P(Death) P(Return-to-home) Score rr
MO D E L 5 For-Profit 0.254***(0.0430) 0.0685***(0.0255) -0.0783(0.154) 0.0537(0.0632) -1.173 (0.893) Non-Profit -0.0432 -0.0497** -0.175 0.0937* -3.075*** (0.0384) (0.0227) (0.140) (0.0564) (0.797)
Public Reference Reference Reference Reference Reference
Heart failure Physical score improvement Cognitive score improvement P(Death) P(Return-to-home) Score rr
MO D E L 5 For-Profit 0.258***(0.0428) 0.149***(0.0244) -0.0451(0.0802) 0.147***(0.0430) 0.996 (0.691) Non-Profit 0.0273 -0.0210 -0.366*** 0.216*** -1.672*** (0.0382) (0.0218) (0.0751) (0.0385) (0.617)
Public Reference Reference Reference Reference Reference
Total hip
replacement Physical score improvement Cognitive score improvement P(Death) P(Return-to-home) Score rr
MO D E L 5 For-Profit 0.171***(0.0333) 0.0955***(0.0141) -0.0895(0.477) 0.109*(0.0631) -0.231 (0.527) Non-Profit 0.0912** 0.0749*** -0.633 0.0252 -1.753*** (0.0371) (0.0157) (0.599) (0.0688) (0.588)
Public Reference Reference Reference Reference Reference
Table 4: Simulation results compared to the raw database
Stroke COPD
In the raw data Simulation In the raw data Simulation
Public
sector Private sector Difference Difference sector Public Private sector Difference Difference Physical score improvement 1,24 1,87 50,52% 24,29% 0,60 0,30 100,18% 30,04% Cognitive score improvement 0,21 0,38 81,70% 22,43% 0,09 0,12 33,61% 11,11% P(Death) 0,03 0,02 -49,12% -46,42% 0,02 0,04 -57,58% -54,12% P(Return-to-home) 0,61 0,64 4,49% 9,09% 0,80 0,69 15,58% 15,47% % of obs. of patients from public sector
acute care unit 91.07% 83.06%
Heart failure Total hip replacement
In the raw data Simulation In the raw data Simulation
Public
sector Private sector Difference Difference sector Public Private sector Difference Difference Physical score
improvement 0,91 0,33 173,32% 46,76% 1,78 1,34 32,42% 20,86%
Cognitive score
improvement 0,15 0,19 26,67% 18,47% 0,18 0,08 127,71% 54,96%
P(Death) 0,05 0,09 -49,78% -26,94% 0,00 0,00 Not relevant Not relevant
P(Return-to-home) 0,64 0,56 14,88% 7,17% 0,87 0,87 0,75% 0,88%
% of obs. of patients from public sector
acute care unit 83.61% 48.56%
Table 5: Simulation results _ Expected performance of private hospital in rate by vulnerability quintile (rate %)
Stroke COPD
French Deprivation
Index 1 (Least) 2 3 4 5 (Most) 1 (Least) 2 3 4 5 (Most)
Physical score improvement 108,20% 21,04% 5,54% 9,00% 67,51% 201,64% 109,09% 92,45% 47,83% 141,47% Cognitive score improvement 127,21% 76,81% 68,55% 64,97% 65,66% 811,67% 449,26% 310,53% 131,01% 38,75% P(Return-to-home) 24,26% 17,58% 6,93% 3,74% 18,59% 17,55% 1,62% 0,82% 0,92% 13,97% Heart failure Total hip replacement French Deprivation
Index 1 (Least) 2 3 4 5 (Most) 1 (Least) 2 3 4 5 (Most)
Physical score
improvement 71,04% 16,13% 24,27% 45,64% 66,00% 73,30% 19,15% 33,76% 30,16% 59,13% Cognitive score
improvement 30,82% 21,68% 17,98% 15,16% 14,24% 77,52% 36,48% 19,89% 10,01% 10,65% P(Return-to-home) 31,38% 17,67% 16,67% 16,71% 24,57% 4,11% 2,92% 1,91% 5,06% 5,05%
PMSI database, Rehabilitation care, Year 2018
Each rate is computed as the difference between the expected value to be admitted in a private hospital when actually admitted in a public sector hospital and the value observed in a public sector hospital. The difference is then divided by and the value observed in a public sector hospital