HAL Id: hal-01097110
https://hal-mines-paristech.archives-ouvertes.fr/hal-01097110
Submitted on 19 Dec 2014
HAL is a multi-disciplinary open access
archive for the deposit and dissemination of
sci-entific research documents, whether they are
pub-lished or not. The documents may come from
teaching and research institutions in France or
abroad, or from public or private research centers.
L’archive ouverte pluridisciplinaire HAL, est
destinée au dépôt et à la diffusion de documents
scientifiques de niveau recherche, publiés ou non,
émanant des établissements d’enseignement et de
recherche français ou étrangers, des laboratoires
publics ou privés.
A fast Fourier transform micromechanical upscaling
method for the study of the thermal expansion of a
TATB-based pressed explosive
Andrey Ambos, Hervé Trumel, François Willot, Dominique Jeulin, Maxime
Biessy
To cite this version:
Andrey Ambos, Hervé Trumel, François Willot, Dominique Jeulin, Maxime Biessy. A fast Fourier
transform micromechanical upscaling method for the study of the thermal expansion of a
TATB-based pressed explosive. 15th International Detonation Symposium, Jul 2014, San Francisco, United
States. �hal-01097110�
A fast Fourier transform micromechanical upscaling method
for the study of the thermal expansion of a TATB-based pressed explosive
Andrey Ambos†, Hervé Trumel‡, François Willot†, Dominique Jeulin†, and Maxime Biessy‡
†MINES ParisTech, PSL - Research university, CMM - Centre for mathematical morphology
35, rue St Honoré, F-77300 FONTAINEBLEAU, France
‡CEA, DAM, Le Ripault, F-37260 MONTS, France
Abstract.
This paper presents the first phase of development of a multiscale numerical method oper-ating at the microstructureal level for a TATB-based pressed plastic-bonded explosive. It uses a virtual model of microstructure mimicking the grain size distribution of the actual material, and a Fourier-based numerical scheme. At present, the method works with sim-plified microstructure and linear anisotropic thermoelastic behavior for the constituents. Neglecting the inter-granular binder leads to fairly overestimated values for isotropic elas-tic moduli and volumetric coefficient of thermal expansion. A first attempt to include the binder yielded much more realistic predictions for elastic moduli, but not for the volumet-ric thermal expansion coefficient. The origin of this discrepancy is thought to lie in the behavior of constituents.
Introduction
The quasi-static thermo-mechanical behavior of TATB-based pressed plastic-bonded explosives is complex, irreversible and highly nonlinear. Pro-gressive damage occurs under quasi-static mechan-ical loading, and slow thermal loads induce irre-versible dilation1,2, often referred to as "ratchet
growth".
These phenomena are still not well understood, but involve necessarily sub-macroscopic processes, such as grain plasticity, microcracking or debond-ing. The first sub-macroscopic level is the so-called "mesoscopic" one, at which the individual grains, micro-cracks and grain boundaries become distinct objects, but remain considered as homogeneous ob-jects. This level, which will be referred to as the
"microstructure level" in the sequel, is roughly that of optical microscopy.
The present work is the first step of the de-velopment of a thermo-mechanical computational method operating at the microstructural level, the objective of which is to link the macroscopic re-sponse to the constituents’ arrangements and be-haviors, in other words a numerical homogenization method.
Such a tool requires (i) a geometrical description of the microstructure, (ii) a computational method, and (iii) constitutive models for the constituents and interfaces.
As no 3D microstructure imaging is available to date for the material described below, the method will rely on virtual models of microstructure. The FFT-based upscaling method will be chosen, as it
requires no meshing, and is not computationally de-manding. Finally, this first phase of development will be performed in the framework of linear ther-moelasticity, homogeneous temperature fields (slow thermal loads) and simplified microstructure. The studied material
The material considered in the present work is a TATB-based pressed plastic-bonded explosive, con-taining less than 5% of an amorphous polymeric binder. The TATB powder is first coated by the binder in a slurry process, then dried and granulated, yielding about 1 mm diameter prills. The latter are then isostatically pressed at 200 MPa and moderate temperature.
The resulting solid material is relatively easy to polish using a standard metallographic-like pro-cedure, and allows optical microscopy (reflected polarized light) observations3,4 to be carried out
(Fig. 1). The microstructure is characterized by a coarse (millimetric) scale representing the vesti-gial prills (hollow white arrows in Fig. 1) and the finer scale of TATB grains. The latter contain sev-eral kinds of flaws, namely binder-filled voids (thin white arrows in Fig. 1), deformation bands (white arrows) and some rare micro-cracks (hollow black arrows). At this scale, the presence of inter-granular binder cannot be detected.
Fig. 1. Optical micrograph (polarized reflected light, enhanced contrast).
At room temperature and pressure, the Young’s modulus of this material is 7.1 GPa, and its
Pois-Fig. 2. Example of dilatational response under cyclic slow thermal loading.
son’s coefficient is 0.335. Fig. 2 displays a typ-ical result obtained with a linear dilatometer on a 5×5×50 mm sample submitted to ±10◦C per
hour thermal cycles. The response is highly non-linear, and seemingly correlated with the glass tran-sition, estimated at 104◦C for this heating-cooling
rate. In the glassy regime, around room tempera-ture, the volumetric thermal expansion coefficient is 1.62×10⁻⁴K−1, which is almost half that of the
TATB single crystal5. Strong local self-balanced
stresses must develop upon heating, to counterbal-ance thermal strains. Upon reaching the glass tran-sition, the rubbery binder is likely to deform eas-ily, hence releasing internal stresses, no more hin-dering thermal expansion. The volumetric thermal expansion coefficient above the glass transition is 3.1×10⁻⁴K−1, slightly higher than that of the
crys-tal.
Virtual microstructure generation
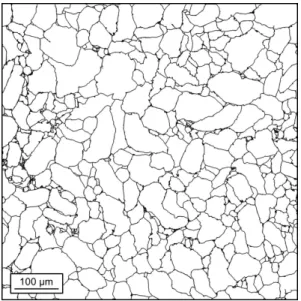
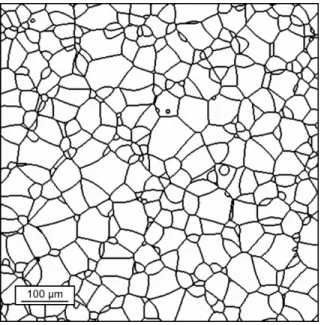
As optical microscopy provides quite complex pictures (see Fig. 1), a large SEM image is taken on a polished sample, after etching the surface by a suitable solvent of the binder to reveal grain bound-aries. This image is then binarized and segmented, as illustrated in Fig. 3.
As is often done to approximate polycrystalline microstructures, a 3D space tessellation model will be sought6, and its parameters will be identified by matching the 2D grain-size distribution measured in Fig. 3. The simplest one, namely the
Poisson-Fig. 3. Segmented image displaying the polycrys-talline microstructure.
Voronoi tessellation, considers a Poisson distribu-tion of seeds. The seeds appear simultaneously, and all grains grow from these seeds at the same isotropic growth rate. Any grain labeled k is defined as the set of voxels x for which:
d(x, ck) ≤ d(x, cj), j 6= k (1)
where d(x, cn) is the Euclidean distance between x
and the seed of grain n. This model has only one parameter, namely the intensity of the Poisson pro-cess, i.e. the (statistical) average density of seeds per unit volume. For a given value of this parame-ter, a tessellation is generated, from which 2D cuts are selected, and grain size distributions are deter-mined by morphological opening. The difference between such 2D grain size distributions and the one measured on the image of Fig. 3 is then min-imized by varying the parameter of the model. The result, displayed in Fig. 4, shows that the Poisson-Voronoi model is unable to reproduce the 2D gran-ulometry of the real material.
A more flexible model is therefore required. The Johnson-Mehl7one is characterized by a
non-simultaneous nucleation process. In its simplest version, nucleation times follow a Poisson process. In order to obtain a model reproducing the exper-imental 2D grain size distribution, the nucleation
Fig. 4. 2D grain size distributions. Black: mea-sured in Fig. 3. Light blue, green, red: Voronoi, Johnson-Mehl and modified Johnson-Mehl models respectively.
process must be further refined, by making the nu-cleation rate to increase linearly with time. An example of generated microstructure is given in Fig. 5. Notice that the Johnson-Mehl tessellation has the definitive advantage of providing curved grain boundaries over the Voronoi one.
Thermoelastic behavior for constituents
The TATB crystal lattice is triclinic8, with two
molecules per unit cell. The unit cell parameters are a = 9.01 ˚A, b = 9.028 ˚A, c = 6.812 ˚A, α = 108.59◦, β= 91.82◦and γ= 119.97◦. The crystal
is made of(a, b) plane layers of hydrogen-bonded TATB molecules, stacked together by weaker van der Waals bonds.
Bedrov et al9have calculated its 21 independent
elastic constants at room temperature and pressure using an atomistic approach. They are listed in Ta-ble 1, in a direct reference frame(e1, e2, e3) such
that e1 is aligned with a, and e2 lies in the(a, b)
plane. The 6 components of the thermal expansion tensor, listed in Table 2, are computed in the same reference frame from the X-ray diffraction data of Kolb et al5.
The grains will be assumed to be randomly ori-ented in the tessellation of Fig. 5. Each grain will therefore be associated with a rotation tensor R linking its crystallographic orientation to the fixed laboratory reference frame. Its elastic and thermal expansion tensors are then expressed in the latter by
Fig. 5. A 2D slice of the modified Johnson-Mehl tessellation (same scale as in Fig. 3).
Table 1. Elastic tensor components (from Bedrov et al.9, in GPa), standard Voigt notations.
C11 65.7 C13 4.0 C26 1.0 C22 62.0 C23 5.0 C34 0.2 C33 18.3 C14 -0.2 C35 -0.4 C44 1.4 C15 -1.0 C36 -0.4 C55 0.68 C16 1.0 C45 0.1 C66 21.6 C24 0.6 C46 0.3 C12 18.5 C25 -0.5 C56 0.4
the following expressions: CIJ KL=RTIiR
T
J jCijklRkKRlL
αIJ=RTIiαijRjJ
(2) where upper case indices are relative to the fixed laboratory frame, lower ones to the local crystal-lographic reference frame, and RT
Ii stands for the
transpose of RiI.
The FFT computational method
The homogenization tool developed here consists in applying a macroscopic load to a volume element representative of the studied microstructure, com-puting the local thermomechanical fields, and riving the overall response. Being relatively less
de-Table 2. Thermal expansion tensor components (computed from the data of Kolb et al.5, in K−1),
standard tensorial notations.
α11 8.28×10⁻⁶ α12 3.34×10⁻⁶
α13 0.41×10⁻⁶ α22 29.04×10⁻⁶
α23 -26.14×10⁻⁶ α33 264.28×10⁻⁶
manding than the finite element method and requir-ing no meshrequir-ing, the FFT-based numerical scheme is chosen. Its principle, first proposed by Moulinec and Suquet10for numerical homogenization under
periodic boundary conditions, will only be outlined here.
For periodic homogenization, it can be shown that the macroscopic strain (resp. stress) is the spa-tial average of the microscopic strain (resp. stress) field. Therefore, applying a macroscopic load is equivalent to prescribing its spatial average, and the method consists in determining the local field fluc-tuations. Uniform temperature fields will be as-sumed in the sequel.
The problem statement is the following: σij,j=0 εkl = 1 2(uk,l+ ul,k) σij(x) =Cijkl(x) [εkl(x) − αkl(x)∆T ] (3)
where σ is the stress tensor, ε the strain tensor, u the displacement vector, and C and α are the elastic and thermal expansion tensors defined in Tables 1 and 2 respectively. The set of equations (3) is com-plemented by periodic displacement fluctuations or anti-periodic traction fluctuations boundary condi-tions.
This problem can be replaced by the equivalent problem of a homogeneous elastic medium of stiff-ness tensor C0submitted to the same boundary
con-ditions, but pre-loaded by a "polarization" stress field τ , given by:
τij = σij− Cijkl0 : εkl (4)
The solution of this problem is given by the Lippman-Schwinger equation:
ε= ¯ε− G0⋆ τ (5) in which G0 is the Green operator associated with C0
(macroscopic strain tensor), and the symbol ⋆ stands for the convolution product.
This implicit equation is solved iteratively us-ing the high convergence rate scheme proposed by Eyre and Milton11, adapted to the thermoelastic
case. The strain field is initialized to the macro-scopic value. The stress field is then computed us-ing Eqn. (3)3, as well as polarization stresses using
Eqn. (4). Eqn. (5) is then evaluated in the Fourier space, which has the advantage of transforming the convolution product into a simple algebraic product, and yields a new evaluation of the strain field. This recursive loop ends up when the strain field attains a stationary value, within a prescribed accuracy. Results
The first aim of the method is to predict (linear thermoelastic) macroscopic properties.This is done by performing 7 computations, each one prescribing independent applied macroscopic strains and tem-perature. The elastic moduli and the components of the thermal expansion tensor are then calculated by averaging over the stress tensor fields.
However, these macroscopic moduli are neces-sarily evaluated on finite volumes, and are there-fore subject to statistical fluctuations. In order to evaluate the size of the representative volume ele-ment (RVE) needed to achieve a reasonable accu-racy for macroscopic moduli, the computations are performed on a relatively large volume of 10243 voxels (about 12,000 grains, 8043µm3). The aver-aging procedure is then conducted on non overlap-ping sub-volumes of decreasing sizes. From these data, the statistical variance (i.e. the accuracy) of the averages (and thus of the macroscopic proper-ties) can be related to the size of the sub-volumes.
The predicted behavior is very nearly isotropic, as expected, given the random nature of the mi-crostructure and crystallographic orientations. For the 10243voxel volume, we obtain a bulk modulus
of 17.2±0.1 GPa, a shear modulus of 7.4±0.04 GPa (Young’s modulus: 19.3 GPa, Poisson’s coefficient: 0.312), and a volumetric thermal expansion coeffi-cient of 2.50×10⁻⁴ ± 0.06×10⁻⁴ K−1. It appears
clearly that the thermal expansion coefficient is less accurately predicted than the elastic moduli.
Conversely, it could be determined that an accu-racy of 0.1% on the bulk and the shear moduli needs
a representative volume element of 2.53mm3(about 38,000 grains, 32503voxels), and of 6.23mm3for the thermal expansion coefficient. As a rule, it was shown that the linear size of the representative vol-ume element must be increased by a factor 4.6 to increase the accuracy of the macroscopic properties by an order of magnitude.
Local field fluctuations are illustrated by Figs. 6 and 7. In Fig. 6, a macroscopic temperature increase of 1 K is prescribed, all macroscopic strains being kept to zero. Therefore, Fig. 6 displays the local strains per degree.
Longitudinal strains fluctuate strongly. Since zero strains are prescribed, stresses must be pre-dominantly compressive. Despite this, tensile (in blue) strains develop. Very strong gradients are also noticed at most grain boundaries, suggesting that debonding might occur for sufficient thermal load-ing.
Fig. 6. Longitudinal strain field ε11. Applied
strain:ε¯ij = 0; applied temp. increase: ∆T = 1 K.
Min. (blue): -5.0×10⁻⁵. Max. (red): 4.7×10⁻⁵.
The1 direction is vertical on the map.
In Fig. 7, a macroscopic longitudinal strain of 1 is prescribed while maintaining the temperature constant. Therefore, Fig. 7 displays the local strain fields normalized with respect to the applied strain.
Val-ues as high as three times the mean strain are recorded. In this case, intra-granular fluctuations are larger than for thermal loading, while strain gra-dients appear somewhat weaker at grain boundaries. This might suggest intra-granular cracking rather than debonding under mechanical loads.
Fig. 7. Longitudinal strain field ε11. Applied
longi-tudinal strain:ε¯11 = 1, other components are zero;
applied temp. increase:∆T = 0. Min. (blue): 0.09. Max. (red): 2.96. The1 direction is vertical on the map.
Discussion
The macroscopic elastic properties predicted for the polycrystal are quite far from actual values mea-sured on the real material. Schapery12 has given theoretical bounds for the volumetric thermal ex-pansion coefficient of polycrystals (Fig. 8). It ap-pears that the value predicted by FFT computations lies within the bounds. This suggests that the com-putational method is not defective, and that the ori-gin of overestimations has to be sought elsewhere.
Fig. 2 shows that the volumetric thermal ex-pansion coefficient increases dramatically above the glass transition temperature, suggesting that the binder plays a strong role on internal stresses buildup and ultimately on the value of the volumet-ric thermal expansion coefficient. In order to
evalu-Fig. 8. Schapery12 theoretical bounds for the
vol-umetric thermal expansion coefficient of the poly-crystal. The vertical lines are Hill’s bounds13 for
the bulk modulus.
ate the potential role of the binder, the grain bound-aries were replaced by a 4 voxel wide interphase with isotropic thermoelastic properties (Young’s modulus: 1.77 GPa, Poisson’s coefficient: 0.32, volumetric thermal expansion coefficient: 0). The real binder properties being unknown at present, these properties are chosen to be of the magnitude order of that of usual amorphous polymers with comparable glass transition temperature.
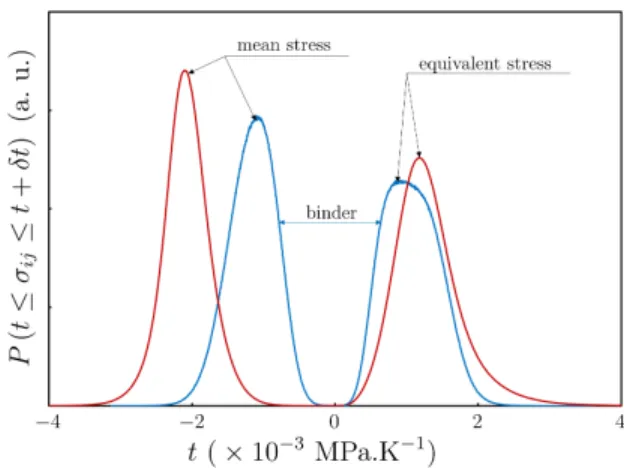
The role of the binder is illustrated in Fig. 9, to be compared to that of Fig. 6, relative to the case with-out binder. A more quantitative insight is provided by the field histograms given in Fig. 10. Globally, stresses are higher in the crystals than in the binder. This is especially true for the mean stress average, approximately twice as high in the crystals than in the binder.
The computations yield again an isotropic macro-scopic response, with a Young’s modulus of 8.46 GPa, a bulk modulus of 7.93 GPa, and a volumet-ric thermal expansion coefficient of 2.4×10⁻⁴K−1. Despite the crudeness of this computation, it ap-pears clearly that the binder plays a strong softening role on the macroscopic elastic properties, not so far from experimental data, which is promising. Notice that neither porosity nor microcracks are accounted for in the present state of modeling. However, its effect on the thermal expansion coefficient is only marginal. This is not understood at present.
Fig. 9. Longitudinal strain field ε11in polycrystal
with binder. Applied thermal loading: ∆T = 1; applied strain: εij = 0. Min. (blue): −8.7 × 10⁻⁴.
Max. (red):2.0 × 10⁻⁴. The1 direction is vertical
on the map.
Fig. 8 shows that for the polycrystal (i.e. neglect-ing the binder), the volumetric thermal expansion coefficient is quite sensitive to the value of the bulk modulus. To match the measured value, the bulk modulus should lie slightly above 20 GPa, which suggests that the elastic constants used in this work are somewhat underestimated.
In the recent experimental work of Stevens et al14, the pressure-volume response of TATB powder
is measured using a diamond anvil-cell apparatus, coupled with X-ray diffraction to record the evolu-tions of the triclinic unit-cell volume with pressure, up to 13 GPa.The authors indicate a room pressure bulk modulus above 15 GPa for the TATB single crystal, whereas the data of Bedrov et al.9used here
yield a bulk modulus below 12 GPa. Also notice the work of Valenzano et al.15, who obtained a partial
set of elastic constants for the TATB crysta by an atomistic approach. They indicate a value of C11,
one of the main contributions to the bulk modulus, 20% higher than that of Bedrov et al9. It is
there-fore likely that the values used here for the elastic constants are the main source of inaccuracies.
Fig. 10. Mean and equivalent stress histograms re-lated to Fig. 9. Each histogram is normalized such thatR−∞+∞P(t)dt = 1. Blue: in the binder; red: in the crystals.
Conclusion and future work
The work presented here has demonstrated that it is possible to build a numerical upscaling tool with a detailed, though not yet fully realistic, description of the microstructure. The first results have shown that input data are of the utmost importance, espe-cially the anisotropic elastic constants for the TATB crystal.
The next tasks will be to improve the virtual microstructure model, which should incorporate the elongated character of the grains, their (some-times strongly) non-convex forms, and ultimately the presence of vestigial prills.
The behavior of the binder is being characterized at present, at least in the glassy domain, i.e. be-low the glass transition temperature. An elastic-plastic constitutive model will be incorporated in the method. Besides it is planned to perform real-time observations at the microstructure level during a quasi-static compression experiment, in order to get data for validation purposes.
Future work should extend the method by ac-counting for grain microcracking and plasticity, and for grain-binder debonding, in order to evaluate the effects of each potential mesoscale irreversible phe-nomena on the macroscopic (quasi-static) response of the material.
Acknowledgments
The authors acknowledge the financial support of the French Commissariat á l’Energie Atom-ique. They also express their gratitude to Didier Picart and Jean-Luc Brigolle for providing macro-scopic elastic constants, and to Philippe Lambert and Patrick Rey for sample preparation, optical and SEM imaging and image segmentation.
References
1. Rizzo, H. F., Humphrey, J. R. and Kolb, J. R., “Growth of 1,3,5-triamino-2,4,6-trinitrobenzene (TATB). II. Control of growth by use of high Tg binders.” Prop. Expl.
Pyrotech., Vol. 6, pp. 27–36, 1981.
2. Maienschein, J. L. and Garcia, F., “Thermal ex-pansion of TATB-based explosives from 300 to 566 K.” Thermochimica Acta, Vol. 384, pp. 71– 83, 2002.
3. Demol, G., Lambert, P. and Trumel, H., “A study of the microstructure of pressed TATB and its evolution after several kinds of insults.” in “Proc. 11thSymp. Int. on Detonation,” 1998.
4. Skidmore, C. B., Phillips, D. S., Idar, D. J. and Son, S. F., “Characterizing the microstruc-ture of selected high explosives.” in “Proc. Eu-roPyro,” 1999.
5. Kolb, J. R. and Rizzo, H. F., “Growth of 1,3,5-triamino-2,4,6-trinitrobenzene (TATB). I. Anisotropic thermal expansion.” Prop. Expl., Vol. 4, pp. 10–16, 1979.
6. Jeulin, D., “Random texture models for ma-terial structures.” Statistics and Computing, Vol. 10, pp. 121–131, 2000.
7. Moller, J., “Random Johnson-Mehl tessella-tions.” Adv. Appl. Prob., Vol. 24, pp. 814–844, 1992.
8. Cady, H. H. and Larson, A. C., “The crystal structure of 1,3,5-triamino-2,4,6-trinitrobenzene.” Acta Cryst., Vol. 18, pp. 485–496, 1965.
9. Bedrov, D., Borodin, O., Smith, G. D., Sewell, T. D., Dattelbaum, D. M. and Stevens, L. L., “A molecular dynamics simulation study of crys-talline 1,3,5-triamino-2,4,6-trinitrobenzene as a function of pressure and temperature.” J. Chem. Phys., Vol. 131, p. 224703, 2009.
10. Moulinec, H. and Suquet, P., “A fast numerical-method for computing the linear and nonlinear mechanical properties of the composites.” C. R. Acad. Sci., Vol. II 318, pp. 1417–1423, 1994. 11. Eyre, D. and Milton, G., “A fast numerical
scheme for computing the response of compos-ites using grid refinement.” Eur. J. Appl. Phys., Vol. 6, pp. 41–47, 1999.
12. Schapery, R. A., “Thermal expansion coeffi-cients of composites materials based on energy principles.” Comp. Mat., Vol. 2, pp. 380–404, 1968.
13. Hill, R., “The elastic behaviour of a crystalline aggregate.” Proc. Phys. Soc., Vol. A65, pp. 349–354, 1952.
14. Stevens, L. L., Velisavljevic, N., Hooks, D. E. and Dattelbaum, D. M., “Hydrostatic Com-pression Curve for Triamino-Trinitrobenzene Determined to 13.0 GPa with Powder X-Ray Diffraction.” Prop. Expl. Pyrotech., Vol. 33, pp. 286–295, 2008.
15. Valenzano, L., Slough, W. J. and Perger, W., “Accurate prediction of second-order elastic constants from first principles: PETN and TATB.” AIP Conf. Proc., Vol. 1426, pp. 1191– 1194, 2012.