Publisher’s version / Version de l'éditeur:
Vous avez des questions? Nous pouvons vous aider. Pour communiquer directement avec un auteur, consultez la première page de la revue dans laquelle son article a été publié afin de trouver ses coordonnées. Si vous n’arrivez pas à les repérer, communiquez avec nous à [email protected].
Questions? Contact the NRC Publications Archive team at
[email protected]. If you wish to email the authors directly, please see the first page of the publication for their contact information.
https://publications-cnrc.canada.ca/fra/droits
L’accès à ce site Web et l’utilisation de son contenu sont assujettis aux conditions présentées dans le site LISEZ CES CONDITIONS ATTENTIVEMENT AVANT D’UTILISER CE SITE WEB.
SIF06, 4th International Workshop: Structures in Fire [Proceedings], 2, pp. 909-920, 2006-05-01
READ THESE TERMS AND CONDITIONS CAREFULLY BEFORE USING THIS WEBSITE.
https://nrc-publications.canada.ca/eng/copyright
NRC Publications Archive Record / Notice des Archives des publications du CNRC :
https://nrc-publications.canada.ca/eng/view/object/?id=1466701e-4e4c-46e4-8796-bae53011957e https://publications-cnrc.canada.ca/fra/voir/objet/?id=1466701e-4e4c-46e4-8796-bae53011957e
NRC Publications Archive
Archives des publications du CNRC
This publication could be one of several versions: author’s original, accepted manuscript or the publisher’s version. / La version de cette publication peut être l’une des suivantes : la version prépublication de l’auteur, la version acceptée du manuscrit ou la version de l’éditeur.
Access and use of this website and the material on it are subject to the Terms and Conditions set forth at Predicting the structural fire performance of solid wood-framed floor assemblies
http://irc.nrc-cnrc.gc.ca
Predicting the structural fire performance of solid
wood-framed floor assemblies
N R C C - 4 8 6 6 6
B é n i c h o u , N .
A version of this paper is published in / Une version de ce document se trouve dans: SIF06 – 4th International Workshop – Structures in Fire, Aveiro, Portugal, May 10-12, 2006, v. 2, pp. 909-920
PREDICTING THE STRUCTURAL FIRE PERFORMANCE OF SOLID
WOOD-FRAMED FLOOR ASSEMBLIES
NOUREDDINE BÉNICHOU1
ABSTRACT
An analytical model for predicting the fire resistance of gypsum protected, wood-joist floor assemblies is presented. The model is a structural response model that uses the temperature profile, inside the wood-joist floor, produced from experimental data. The structural model, based on bending theory and experimental observations, calculates the deflection of the wood joists and the predicted time to structural failure of the assembly. The model produces structural fire resistance failure time and deflection predictions that are comparable with the experimental data. This paper also presents future developments of the model and challenges associated with modelling wood-framed assemblies.
1 INTRODUCTION
Lightweight wood-framed assemblies, commonly used in the construction of walls and floors of residential buildings, are required to have adequate fire resistance so that the fire is contained within the compartment of fire origin for a specified duration of time. This containment delays fire spread to other compartments and provides for safe evacuation and rescue operations. Traditionally, fire resistance has been determined using:
• Test methods in accordance with procedures outlined in standards or • Reference to ready-to-use tables found in building codes or
• Design procedures, such as the component additive method, often found in building codes.
Alternatively, fire resistance can be evaluated using validated numerical models, which are becoming available with the application of more performance-based designs. In this case, to simulate the fire resistance behaviour of wood-frame assemblies, it is essential to evaluate their thermal and structural responses when exposed to fires. The thermal response gives estimates of the temperature distribution in the assembly. The structural response calculates the structural failure of an assembly, based on this temperature distribution.
1 Senior Research Officer, Fire Research Program, National Research Council of Canada, Ottawa, ON, Canada,
The National Research Council of Canada (NRC) has developed an analytical model to predict the structural fire response of lightweight wood-joist floor assemblies exposed to fires. This model is based on experimental observations from tests carried out at NRC over the past decade. It also uses the equations of strength of materials and the effects of temperatures on the mechanical properties.
First this paper describes briefly the test results that have led to the development of the fire resistance model. The paper then describes, in detail, the theoretical framework of the structural response model, which predicts the time to failure and deflection of floor assemblies. Finally, the paper presents a simulation displaying how good the agreement is between the experimental results and the model predictions.
2 EXPERIMENTAL STUDIES
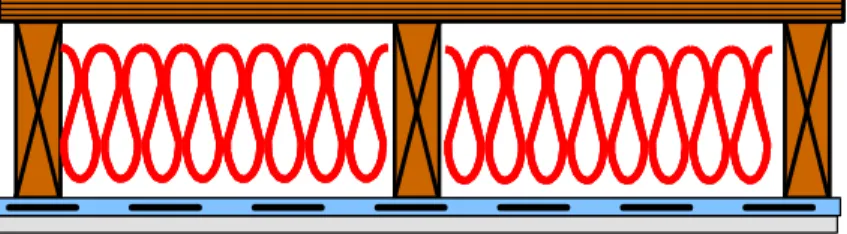
To determine the effects of various parameters on the fire resistance of wood-framed assemblies, a detailed experimental study was undertaken. The experimental program consisted of full-scale fire tests on 19 floors. The systems tested were replicates of floor assemblies commonly used in North America and listed in the National Building Code (NBC) of Canada1. As shown in Fig. 1, typical floor assemblies are constructed with materials that include:
• Wood joists representing the framing and spaced at 400 mm o.c. or 600 mm o.c.
• Layers of fire rated (Type X) gypsum board (GB), 12.7 or 15.9-mm thick, fixed to either resilient channels (RC) or joists using screws. RCs are usually used to improve the acoustic performance.
• Insulation within the cavities including glass fibre, rock fibre or cellulose fibre. • Subfloor attached to the framing from the top using screws or nails.
Fig. 1 - Typical wood-joist floor assembly
The full-scale floor tests were carried out by exposing one side of the assemblies to heat in a propane-fired horizontal furnace using gas fuel burners, in accordance with the CAN/ULC-S101-M89 standard2. The assemblies were sealed at the edges against the furnace using ceramic fibre blankets to minimize heat leakage. The furnaces can accommodate floor assemblies that are 4.8 m long by 3.9 m wide. Type K chromel-alumel thermocouples were used for measuring temperatures at a number of locations throughout an assembly. For the loading, the furnace has a loading device and the load is transmitted through hydraulic jacks to simulate vertical structural loads. Loads on the assemblies were calculated based on the
material characteristics of the assembly in accordance with CAN/ULC-S101-M892. The
furnace temperature was measured by nine shielded thermocouples in accordance with
CAN/ULC-S101-M892 and the average of the required nine-thermocouple temperatures was
used to control the furnace temperature. In addition, the deflection at the unexposed surface was measured at different locations. During the tests, the furnace and assembly temperatures, deflections and the gauge pressure of the loading system were recorded at 1-minute intervals. Complete details on the construction of the floor assemblies, instrumentation location test procedures and results are given in references3, 4 and 5. The time to failure is based on failure
criteria derived from CAN/ULC-S101-M892, i.e.: a) Thermal failure; b) Integrity failure; or c) Structural failure - loss of load-bearing capacity or excessive deflection of assemblies.
The results3, 4 and 5 have shown that the main factors that affected the performance of assemblies are the attachment of gypsum board, type of insulation, and the number of gypsum board layers. The results have also shown that key design trends can be summarized as follows:
• Assemblies with screws located further away from board edges (38 mm versus 10 mm) provide higher fire resistance.
• In assemblies with wood joists and a single-layer gypsum board ceiling finish, glass fibre insulation reduces the fire resistance while rock and cellulose fibre increased the fire resistance compared to a non-insulated assembly. In assemblies with a double-layer of gypsum board finish, the glass, rock and cellulose fibre all reduce the fire resistance compared to a non-insulated assembly.
• For floor assemblies with wood-I-joists and finished with a double-layer of gypsum board, the glass fibre reduces the fire resistance while rock fibre increases the fire resistance compared to a non-insulated assembly.
• Assemblies with two layers of gypsum board with staggered joints provide a significant increase in the fire resistance compared to an assembly with one layer of gypsum board. • For wood-I joist floor assemblies with glass fibre insulation and a double-layer of gypsum
board, the effects of joist spacing and resilient channel spacing (406 mm o.c. and 610 mm o.c.) are significant.
• An increase in structural load decreases fire resistance.
As fire design of floor assemblies is usually carried out by reference to standard fire tests, the results of this study were used as the basis for updating the tables of Appendix A of NBC1 including generic fire resistance ratings of hundreds of assemblies. Designers can use the table for their designs, but the user can also choose from any other acceptable source.
3 DEVELOPMENT OF FIRE RESISTANCE MODELS
Although very beneficial, fire resistance test methods have drawbacks, including high costs and time, limitations of specimen geometry and loading, and to a lesser degree repeatability. Calculation methods offer one way of overcoming some of these problems when attempting to assess the fire resistance of lightweight-framed assemblies. The calculation methods also aid in designing an experimental program, improve products manufacturing, and assist the industry in taking full advantage of the opportunities offered by performance-based codes, as these methods would facilitate a faster design process. In the following sections, a model for predicting the fire resistance of wood-framed floor assemblies is presented.
3.1 Behaviour of Wood-Joist Floors under Fire Exposure
In order to develop a fire resistance model for floor assemblies that replicate test results, the fire resistance behaviour from the experimental program must be carefully observed. Test results, carried out at NRC over the past years, have shown that the behaviour of wood-joist floors, when exposed to fire, depends on several key factors: the layers of gypsum board separating the wood joists from the flames, the insulation between the joists, the material properties of the wood joists, and the temperatures to which the assembly is subjected.
The test results have shown also that, when wood-joist floors are exposed to fire, the temperature will increase in the gypsum first, followed by an increase in the joists. At
temperature levels ranging between 280°C and 300°C, the wood will begin to char, causing deflection towards the fire. This will cause gaps in the gypsum board joints to form, allowing even more heat to reach the joists. As the wood chars further and the cross-section of the joists decreases, the deflection will increase until the overall assembly fails. Fig. 2 shows the behaviour and failure mode of a wood-joist floor assembly.
3.2 Description of the Wood-Joist Floor Fire Resistance Model
Following the same logic underlying the behaviour observed in the experimental studies, the fire resistance of a wood-joist floor assembly is determined by the thermal and structural performance of the floor when exposed to fire. In this model, the thermal response is predicted by input of the temperature profile as measured from experimental tests (no calculation yet). The structural response model determines the degradation of the mechanical properties of joists at elevated temperatures, cross-section reduction, the deflection of the joist, and the time to structural failure of the assembly. Structural failure, which usually governs failure of floor assemblies, occurs when the stresses caused by the applied load exceeds the physical resistance of the joist, or when the span/deflection ratio drops below a certain value (usually < 30). In the latter case, it is said that the joist has failed due to deflection.
a) Wood joist assembly at the end of a test
Failure
Furnace Side L
0.5 L
b) Schematic representation of the behaviour of a wood joist assembly Fig. 2 - Behaviour and failure mode of a wood-framed assembly
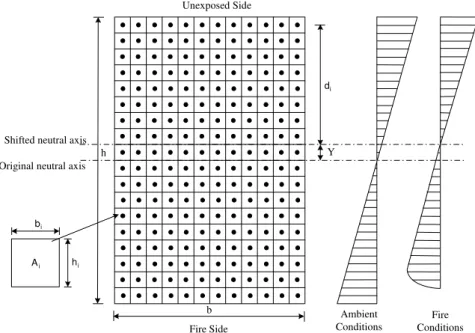
To perform the structural response calculation, the joist cross-section is divided into a number of elements in both directions (see Fig. 3). The calculation of mechanical properties, inertia, moments and deflection are described in the following sections.
Fire Side Unexposed Side
Original neutral axis Shifted neutral axis
Y i d i b i h i A b h Ambient
Conditions ConditionsFire
Fig. 3 - Cross-section division diagram and stress diagrams 3.3 Moment Applied on the Joist
Assuming that the joist is a simply supported member with a uniform distributed load, the bending moment applied to the joist can be calculated using the following equation:
2 2 ) ( 2 wx wLx x M = − (1)
Where M(x) is the applied moment, w is the uniform distributed load, L is the length of the joist, and x is the current position along the length. The midpoint on the joist is the weakest location because the applied moment is the greatest. At L/2:
8 2 max
wL
M = (2)
3.4 Resisting Moment of the Joist
The internal forces of the wood-joist allow it to resist an applied moment up to a certain value. The magnitude of the resisting moment is dependent on the yield stresses in both tension and compression. When loaded from above, the joist will be in tension below the neutral axis and in compression above the neutral axis. Since the corresponding yield stresses run in the axial direction of the joist, and in opposite directions, they create a couple around the neutral axis. The following equations govern the resisting moment relationship:
∑
= = m i i i Ti RT A d M 1 * * σ (3)∑
= = m i i i Ci RC A d M 1 * * σ (4) RC RT R M M M = + (5)Where MRT is the resisting moment due to tensile stresses, σTi is the element tensile yield
stress, MRC is the resisting moment due to compressive stresses, σCi is the element
compressive yield stress, Ai is the element area, and di is the distance from the centroid of the
element to the neutral axis. The value of di for each element changes with time and is
determined by computing the shift Y (distance from the original neutral axis to the current neutral axis) at every time step.
3.4.1 Yield stresses for the current time step
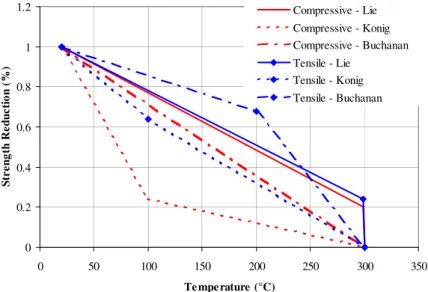
Wood-joist assemblies are commonly subjected to both tensile and compressive forces, and consequently there are tensile and compressive stresses that can be found internally in the joist. Yield stress is the point when the forces loading the member exceed the elastic range, and will cause permanent deformation. The tension and compression yield stresses are affected by temperature. Fig. 4 shows the curve describing both tensile and compressive yield stresses of wood as a function of temperature. These data were obtained from various sources6, 7, and 8. These properties are used in the model predictions.
0 0.2 0.4 0.6 0.8 1 1.2 0 50 100 150 200 250 300 350 Te mpe rature (°C) St r e ng th R e duc ti o n ( % ) Compressive - Lie Compressive - Konig Compressive - Buchanan Tensile - Lie Tensile - Konig Tensile - Buchanan
Fig. 4 - Yield stress of wood as a function of temperature 3.4.2 Position of the neutral axis for the current time step
Once wood elements begin to char, the neutral axis of the joist will change position (moves up provided that the exposure is from below). The new position of the centroid can be calculated with the following equation:
(6) 0 * ) ( 1 = +
∑
= m i i Ci Ti σ A σOnce the location of the neutral axis is found, the value of the distance Y (see Fig. 3) can be determined.
3.5 Deflection of the Joist
There are two main factors that affect the deflection of the beam (joist): loading and eccentricity of the surface of the joist.
3.5.1 Deflection due to load
For a typical joist, the overall deflection due to a uniform distributed load is:
(
x Lx L x)
EI w x y * 4 2 3 3 24 ) ( = − + − (7)Where y(x) is the deflection, w is the distributed load, E is the modulus of elasticity (defined below), I is the moment of inertia (defined below), x is the position on the joist and L is the length of the beam (joist). The midpoint on the joist is the location of the maximum deflection. At L/2: EI 384 5 4 max L w y = (8)
3.5.2 Modulus of elasticity for the current time step
The modulus of elasticity is a function of temperature, so in order to calculate the corresponding overall E value, the temperature-dependent value is taken for each remaining element of the cross-section of the joist.
∑
∑
= = = m i i m i i i A A E E 1 1 * (9)Where E is the average modulus of elasticity of the cross-section, Ai is the area of a single
element, and Ei is the modulus of elasticity of a single element at temperature T, as depicted
in Fig. 5. These properties will be used in the model predictions.
0 0.2 0.4 0.6 0.8 1 1.2 0 50 100 150 200 250 300 350 Te mpe rature (°C) M o ulus o f E la st ic it y R e d uc ti o n ( % ) E - Lie E - Konig E - Buchanan
3.5.3 Moment of inertia and rigidity for the current time step
The moment of inertia is dependent on the geometry of the cross-section of the joist. Once elements begin to char, the neutral axis of the joist will change position, affecting the value of the moment of inertia. The value of the moment of inertia can then be calculated using the following equation:
∑
= ⎟ ⎠ ⎞ ⎜ ⎝ ⎛ + = m i i i i i h d A b I 1 2 3 * * * 12 1 (10) Where I is the moment of inertia, bi is the width of each element, and hi is the height of eachelement. The distance di denotes the vertical distance from the element centroid to the neutral
axis, and Ai represents the area of each element. The model calculates the rigidity (product of
the modulus of elasticity and the moment of inertia), for each joist in the floor, as follows:
(
)( )
[
]
i m i i i i i m i i i h E b h d E b EI∑
∑
= = + = 1 2 1 3 * 12 * (11) Where bi is the element width, hi is the element depth, di is the distance from the elementcentroid to the neutral axis, and Ei is the temperature-dependent modulus of elasticity of the
element.
3.5.4 Deflection due to initial joist surface eccentricity
In addition to the deflection due to the loading, the eccentricity of the surface of the wood affects the deflection of the joist. In general, the eccentricity can be expressed with a sinusoidal equation: ⎟ ⎠ ⎞ ⎜ ⎝ ⎛ = L x e ye *sin π (12)
Where ye is the magnitude of the deflection due to eccentricity, e is the maximum
eccentricity, x is the position along the joist, and L is the length of the joist.
3.5.5 Overall deflection
The overall deflection of a joist can be described as the sum of the deflections due to load and eccentricity. If the downward direction is assumed to be positive, then the load and eccentricity will cause positive deflections. Consequently, the overall deflection Δ at any given point can be expressed as:
e maz y
y +
=
Δ (13)
4 MODEL PREDICTIONS AND COMPARISON WITH EXPERIMENTAL DATA
In order to verify the validity of the model, it is necessary to compare the predictions with experimental data. At this stage, one test was used to evaluate the predictions by the fire resistance model. Details of the wood-joist properties are shown in Table 1. Using these properties, the model will determine the time to failure and the deflection at each time step,
which can then be compared to the experimental results. For this test, temperatures on the unexposed sides did not reach the temperature failure criterion, as the assembly failed structurally at 41 min.
Table 1 - Wood joist properties
Property Assumed value
Width 38 mm
Height 235 mm
Length 3874 mm
Load (per joist) 2080 N/m
Charring Temperature 300°C
Initial Maximum Eccentricity 1 mm
Ambient Modulus of Elasticity 7000 MPa
Ambient Tensile Strength 25 MPa
Ambient Compressive Strength 25 MPa
4.1 Experimental Time-Temperature Data4
Fig. 6 shows the average time-temperature curves obtained from the experimental tests at different locations (as indicated on the figure). The temperatures start gradually increase and once they reach about 100°C a plateau is formed corresponding to the dehydration of the gypsum board. This lasts for about 15 min after which the temperatures start increasing again at a faster rate. At 40 min, the temperatures show a rapid increase at all points except on the unexposed side. This is an indication that gypsum board has completed fallen off and the flames are impinging directly on the wood. Temperatures on the unexposed sides did not reach the insulation failure criterion, as the assembly failed by structural instability at 41 min.
Time (min) 0 10 20 30 40 50 60 T em perat ure ( °C ) 0 200 400 600 800 1000 Furnace Temp GB-SL/WJ GB-SL/Cav Mid. Jst SF-SL/Cav SF-SL/WJ UnExp Legend
SL - Single Layer GB - Gypsum Board WJ - Solid Wood Joist Cav - Cavity Mid.Jst - Middle Joist UnExp - Unexposed Side SF - Subfloor
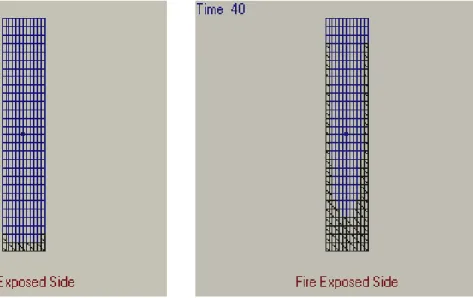
4.2 Charring of the Section of Different Time Steps
The joist begins charring as soon as a single element reaches the charring temperature. While there is still wood physically present in the element after charring occurs, the material properties are said to have reached a point where that element no longer adds to the strength of the joist, and can therefore be disregarded in calculations. Fig. 7 shows a diagram depicting typical charring in a cross-section of the joist at 29 and 40 min, respectively, based on the input temperatures from the experimental data.
a) Start of charring b) Charred section at the end of test
Fig. 7 - Charring diagram of the joist 4.3 Moment Resistance of Joist
To measure the performance of the structural response model, the predictions of the structural fire resistance and deflection at mid-length are evaluated. Fig. 8 illustrates the moment resistance versus time as predicted by the structural response model, based on the mechanical properties shown in Fig. 4 and Fig. 5. The fire resistance decreases with increasing time because the value of the mechanical properties decreases with time and the cross-section of the joists reduces after charring. The intersection of the horizontal line, at the level of the applied moment, with the moment resistant curve, represents the theoretical time to structural failure of the wall. The time-to-structural failure of the assembly is about 26, 36 and 37 minutes using the properties from Konig, Buchanan and Lie, respectively, while the time to structural failure measured experimentally is 41 min. As expected the definition of mechanical properties has a large effect on the model predictions. The difference between the analytical and experimental failure is 36 % to 10% on the conservative side.
4.4 Deflection of the Joist
Fig. 9 illustrates the maximum mid-length deflections plotted against the time for both the analytical predictions and the test results, and based on the mechanical properties shown in Fig. 4 and Fig. 5. As shown in the figure, the deflection is very small in the first 20 to 25 min. After this point, the model predictions and the test measurements start increasing at a faster rate (higher for Konig’s properties compared to the others due to the definition of the properties). In general the trend in the rate of increase in the model predictions is similar to that of the test results. The difference in the predictions may be due to the definition of change of mechanical properties with temperature and the nominal values of the mechanical
properties, which could be different than the actual value of the joists tested. The model also checks to see if the joist fails due to excessive deflection, which is set to occur when the span/deflection < 30 (L/y<30). For this test, the values for L/y before and after the joist fails are greater than 30. Consequently, this indicates that the joists failed due to load first, and not due to deflection. 0 2000 4000 6000 8000 10000 12000 14000 0 10 20 30 40 5 Time (min) R e s ist iv e M o men t ( N -m ) 0 Applied Moment
Moment - Lie Properties Moment - Konig Properties Moment - Buchanan Properties
Fig. 8 - Predicted resistive moments
0 20 40 60 80 100 120 140 160 180 0 5 10 15 20 25 30 35 40 45 Time (min) M a x . D e fl e c ti on (mm ) Experimental Data [4] Predictions - Lie Properties Predictions - Konig Properties Predictions - Buchanan Properties
Fig. 9 - Predicted and measured maximum deflection
5 CONCLUSIONS, FURTHER WORK AND CHALLENGES
This paper described a model for the prediction of the fire resistance of lightweight wood-frame floor assemblies exposed to standard fires. As this stage of the development, the model deals only with the structural response, while the temperature profiles are input using data obtained from experimental studies. The structural response model is based on experimental observations for tests carried out at NRC over the past decade and uses the bending equations to evaluate the moment resistant and deflection assuming the assembly as a simply supported beam. The model predicts the time to structural failure of assemblies, taking into account the reduction in mechanical properties with elevated temperatures, as well
as the shift of the neutral axis towards the cooler region of the cross section with time. It also calculates the deflection along the joists, taking into account the change in flexural rigidity with elevated temperatures. Comparison of the structural failure time and the deflection as predicted by the model, with the results of one experimental full-scale floor standard test exposed show that model predictions are conservative and depend greatly upon how the mechanical properties versus temperature are defined.
To improve the current model, a thermal response model will be developed to predict the temperatures instead of using temperatures obtained from experimental data. The thermal response model will be coupled with the structural response model, and will form the new fire resistance model. The predictions of the new fire resistance model (temperatures, deflections and time to failure) will be validated against an extensive set of standard fire test data obtained from experimental programs carried out at NRC. The model also requires validation in non-standard fires. An experimental program is planned to expose structural wood-framed assemblies to design fires (non-standards fires) likely to occur in residential occupancies. The material properties, as an important factor for predicting the fire performance, will be incorporated into the model using existing and new data. The new data will be obtained by carrying tests on the different component of wood-framed assemblies.
Although the current fire resistance model can provide some prediction and may be suitable to assess the time to failure of load-bearing wood-frame floor assemblies for practical applications, there are still some challenges with the modelling of floor assemblies. These include:
• The definition of non-standard fires, especially for the decay phase.
• How to move from modelling a single joist to a whole floor system and the issues of load redistribution.
• Accounting for the effect of continuity and restraint (isolated element vs. part of system). • The reliability of the data depicting the material properties.
REFERENCES
[1] Canadian Commission on Building and Fire Codes, National Building Code of Canada, IRC, NRC, Ottawa, Canada, 1995.
[2] CAN/ULC-S101-M89, Standard Methods of Fire Endurance Tests of Building Construction and Materials, Underwriters' Laboratories of Canada, Scarborough, Canada, 1989.
[3] Bénichou, N. and Sultan, M.A.; Design considerations for fire resistance performance of lightweight-framed assemblies; CSCE 2003 Annual Conference, Moncton, NB, pp. 567-1 - 567-10, 2003.
[4] Sultan, M.A., Séguin, Y.P., and Leroux; P., Results of Fire Resistance Tests on Full-Scale Floor Assemblies; Internal Report No. 764, Institute for Research in Construction, National Research Council of Canada, Ottawa, ON, Canada, 1998.
[5] Sultan, M.A. and Bénichou; N., Fire Resistance Performance of Lightweight Floor Assemblies; Designing Structures for Fire Conference, Baltimore, MD, U.S.A., pp. 203-214, 2003.
[6] Lie, T.T., (Editor), Structural Fire Protection, American Society of Civil Engineers, Manuals and Reports on Engineering Practice No. 78, 1992.
[7] Konig, J. and Walleij, L., Timber frame assemblies exposed to standard and parametric fires. Part 2: a design model for standard fire exposure, Report No. I 0001001. Tratek, Swedish Institute for Wood Technology Research, Stockholm, Sweden, 2000.