HAL Id: hal-00455515
https://hal.archives-ouvertes.fr/hal-00455515
Submitted on 10 Feb 2010
HAL is a multi-disciplinary open access
archive for the deposit and dissemination of sci-entific research documents, whether they are pub-lished or not. The documents may come from teaching and research institutions in France or abroad, or from public or private research centers.
L’archive ouverte pluridisciplinaire HAL, est destinée au dépôt et à la diffusion de documents scientifiques de niveau recherche, publiés ou non, émanant des établissements d’enseignement et de recherche français ou étrangers, des laboratoires publics ou privés.
Response of Pinus sylvestris L. to recent climatic events
in the French Mediterranean region
A. Thabeet, M. Vennetier, C. Gadbin-Henry, N. Denelle, M. Roux, Y.
Caraglio, B. Vila
To cite this version:
A. Thabeet, M. Vennetier, C. Gadbin-Henry, N. Denelle, M. Roux, et al.. Response of Pinus sylvestris L. to recent climatic events in the French Mediterranean region. Trees - Structure and Function, Springer Verlag, 2009, 23 (4), pp.843-853. �10.1007/s00468-009-0326-z�. �hal-00455515�
Response of Pinus sylvestris L. to recent climatic events in the
French Mediterranean region
Ali Thabeet
1+2+3, Michel Vennetier
2+5, Claude Gadbin-Henry
1, Nicole Denelle
1, Maurice
Roux
1, Yves Caraglio
4, and Bruno Vila*
1+51 Institut Méditerranéen d’Ecologie et Paléoécologie - UMR 6116, CNRS, France 2 Cemagref - Unité Ecosystèmes Méditerranéens et Risques, France
3 Alep University, Forest Ecology Department, Syria
4 CIRAD -UMR AMAP (botAnique et bioinforMatique de l'Architecture des Plantes), France 5 Fédération de recherche n° 3098 ECOREV
*Corresponding author:
e-mail: bruno.vila@univ-provence.fr
Such: 33 (0) 4 91 28 88 72 Fax: 33 (0) 4 91 28 86 68
Abstract Exceptional climatic events from 2003 to 2005 (scorching heat and drought) affected the
whole of the vegetation in the French Mediterranean region and in particular Scots pine (Pinus
sylvestris L.), one of the most important forest tree species in this area. To understand its response to
these extreme conditions, we investigated its radial growth, branch length growth, architectural development and reproduction for the period 1995-2005, and linked these variables to climatic parameters. We used four plots situated in southeastern France and presenting different levels of site quality and potential forest productivity. The results show that: (1) the climatic episode 2003-2005 was highly detrimental to the growth (bole and branches), crown development and cone production but favored the production of male flowers; (2) these variables depend on climatic factors of both the current and previous years; (3) the 2003 scorching heat impact was strong but was mainly apparent from 2004; it was part of a 6-year-long unfavorable cycle beginning in 2000 and characterized by high minimal and maximal temperatures and very dry springs; (4) in spite of a significant effect of site quality, Scots pine's response to extreme climatic conditions was homogeneous in the French Mediterranean area; (5) the stress induced by poor site conditions generally resulted in the same consequences for tree growth, architecture and reproduction as in unfavorable climatic conditions. Keywords ·Pinus sylvestris L;. Scorching heat; Drought; Growth; Reproduction; Architecture
1 - Introduction
The Mediterranean climate is characterized by strong summer water stress, linked to high temperatures combined with low rainfall (Le Houérou, 2005). In the French Mediterranean region, the 2003 summer scorching heat (Rebetez et al, 2006) is, however, considered as exceptional over the last five centuries, as in most of Europe (Luterbacher et al., 2004). The monthly maximum and minimum temperatures of May, June and August exceeded the normal values (1961-2002) by 4–6°C, those of July by 2°C, with very few rainfall during 4 months. The drought continued in 2004 and 2005, with a rainfall deficit reaching respectively 50 and 40 % for the first 6 months (Vennetier et al., 2009).
Because of the fast climate warming and the decreasing rainfall in spring and summer forecast for the 21st century in the Mediterranean basin (Hesselbjerg-Christiansen and Hewitson, 2007) and the related increase in climate variability (Schar and al., 2004), such extreme events and successions of dry years would become more frequent in the coming decades (Beniston and Diaz., 2004). These periods of low water availability and high temperatures that limit physiological processes will be of major importance limiting trees' photosynthetic activity and growth. As most of mediterranean soils are eroded (Butzer, 2005), their water holding capacity is often low what can extend periods of water limitation and increase drought events. Tree survival may be at stake in case of extreme soil water depletion (Landmann et al., 2003; Bréda et al., 2006). To observe and measure the consequences of
the 2003-2005 climate episode on the Mediterranean forest is thus useful to provide input for the debate regarding its future.
In the French Mediterranean hinterland, the Scots pine (Pinus sylvestris L.), favored by agricultural land abandonment since the end of the 19th century, is the most common conifer. But in this region, at the very limit of its distribution area (Price et al., 1998), summer water stress and high temperatures are the main factors limiting its geographic extension. These constraints exceeded vital thresholds in 2003, leading to the degradation of its health status: loss of a high proportion of needles, twig withering and partial crown dieback (Vennetier et al., 2007). Since 2005, extensive dieback of whole stands over several thousand hectares has been reported in the French Southern Alps (Pauly and Belrose, 2005), confirming the observations of Rebetez and Dobbertin (2004) in the Swiss Alps. But the impact of such climatic events may also depend on site conditions. High water availability in the soil can partly compensate for climate worsening. This is why it is necessary to take into account plot quality in such studies.
With climate change, the Scots pine may be at risk in the Mediterranean area. It is therefore urgent to assess its response to recent extreme climatic events.
Tree ring indices are known to be good indicators of tree health in the long-term (Fritts and Swetnam, 1989; Dobbertin, 2005). In a previous study on Scots pine located at Sainte-Baume Mountain, Vila et al. (2008) evidenced strong long-term trends on radial growth over the period 1900-2000. To better understand the growth pattern and potential response of this species to climate change, it was necessary to complete the previous study with several new, complementary parameters, and to analyse the impact of recent extreme climatic events.
Our goal in this study was to assess the impact of the 2003 heat wave and subsequent repeated drought (2004-2005) on Scots pine in the French Mediterranean region according to various site conditions. We analyzed not only branch architectural development and length growth, size and number of needles, and reproduction (flowering, fruiting) as indicators of tree health and stress status in the short-term, but also radial growth to relate findings to the previous study, linking all these variables to climatic factors.
2 - Material and methods
2.1 - Study sites
The study area includes two sites in Provence (southeastern France). They are characterized by a Mediterranean climate tempered by the altitude, with on average one to two dry months in summer, but up to 5 dry months once every 5–10 years. Four plots of Scots pine were sampled. Three are situated an altitude of 850 m on the north slope of the Sainte-Baume massif (Bouches-du-Rhône) close to the Mediterranean Sea, and the last at 1360 m in the hinterland near the village of Courchons (Table 1). In the Sainte-Baume massif and Courchons area, the annual rainfall is, respectively, 826 mm and 936 mm and the mean annual temperature 10.3°C and 9.7°C (data 1961-2005). The three Sainte-Baume plots are situated on a limestone substrate. They were chosen as representative of three levels of site quality according to the site index developed for the French Mediterranean area by Vennetier et
al. (2008), which proved to be closely related to forest productivity and water availability for plants.
This index is computed from 6 variables describing soil (depth, % of coarse fragments and rock, water holding capacity of fine earth), topography (at local and landscape scale) and geology (mother rock outcrops). According to this topo-edaphic site index (SI) the values values of which span the -80 to +80 interval (Ripert et al., 2002), we sampled plots characterized (Table 1) by highly contrasted site quality good (plot graded A, SI = 24; plot graded B, SI = -11;and plot graded C, SI = -40).. The soil at Courchons, graded B (SI=10) derives from a hard clayey limestone bedrock covered by colluvium.
2.2 - Measurements
To study radial growth, 3 cores per tree were collected from 15 dominant trees at each site at 1.3 m height. After sanding and crossdating, ring width was precisely measured by means of an Eklund
device (1/1000 mm) supplying core elementary series. The three elementary series of each tree were averaged to obtain individual chronologies. These were standardized (PPPhalos software, http://www.imep-cnrs.com/, window of 15 years) (Guiot et al., 1996) to keep only the inter-annual variations. A standardized average chronology was computed by site from the 15 trees. For every year, the radial growth index was noted Rw.
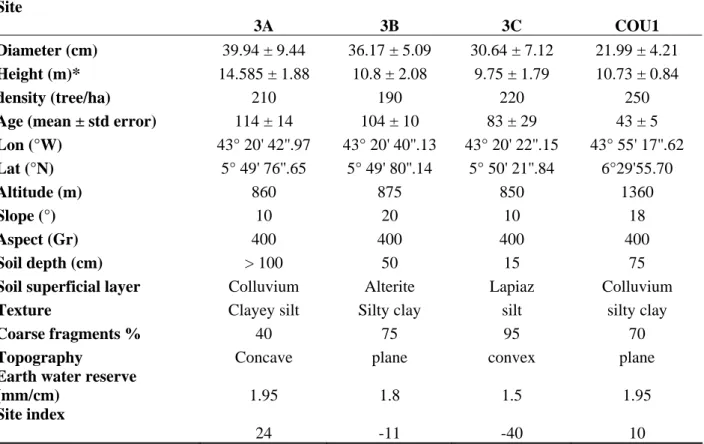
Table 1 Description of the plots
Site
3A 3B 3C COU1
Diameter (cm) 39.94 ± 9.44 36.17 ± 5.09 30.64 ± 7.12 21.99 ± 4.21
Height (m)* 14.585 ± 1.88 10.8 ± 2.08 9.75 ± 1.79 10.73 ± 0.84
density (tree/ha) 210 190 220 250
Age (mean ± std error) 114 ± 14 104 ± 10 83 ± 29 43 ± 5
Lon (°W) 43° 20' 42''.97 43° 20' 40''.13 43° 20' 22''.15 43° 55' 17''.62 Lat (°N) 5° 49' 76''.65 5° 49' 80''.14 5° 50' 21''.84 6°29'55.70 Altitude (m) 860 875 850 1360 Slope (°) 10 20 10 18 Aspect (Gr) 400 400 400 400 Soil depth (cm) > 100 50 15 75
Soil superficial layer Colluvium Alterite Lapiaz Colluvium
Texture Clayey silt Silty clay silt silty clay
Coarse fragments % 40 75 95 70
Topography Concave plane convex plane
Earth water reserve
(mm/cm) 1.95 1.8 1.5 1.95
Site index
24 -11 -40 10
* Due to several crown breaks in time due to snow, tree height is not a good index for site fertility.
To study all crown variables (architecture, growth, needles, reproduction), 6 branches at least 11 years old were harvested per tree between April and June 2006 from 5 trees per plot. These branches were chosen according to their position in the crown (two at the top, two in the middle, two
at the base) and orientation (sunny or shaded). The measurements were performed on 4 axes per branch: the main axis (A1), one secondary axis of the branch whorl from the base of the annual shoot of 1995 (A2) and two tertiary axes (A3) from the branch whorls at the base of the annual shoot of 2000 respectively on the main and the secondary axis. We measured, for every year from 1995 to 2005 and every axis (Fig
Nn Mf Lateral axes Sl Blg year (n) Blg year (n-1) Nl Buds Flower Nc Nn Mf Lateral axes Sl Blg year (n) Blg year (n-1) Nl Buds Flower Nc . 1):
Fig. 1: Variables measured on branches of Scots pine:
(1) Blg total length of the annual shoot; (2) Sl length of the basal sterile scales; (3) Nc number of cones, (4) Mf length of the area with male flowers; (5) Nn annual number of needles; (6) Nl needle length. The number of secondary axes in the branch whorl at the base of the annual shoot with cones (Nbc) and without cones (Nbx). Note that the last studied parameter, ring width (Rw), was measured at 1.3 m height, on the bole.
the total length of the annual shoot (Branch length growth = Blg), the length of the zone of the initial sterile scales at the base of the shoot (Scale length = Sl), the length of the zone carrying male flowers (Mf), the number of yearly secondary axes with cones (Nbc) and without cones (Nbx), and the total number of cones on yearly shoots, main and secondary axes (Nc). From these variables, we computed the total number of annual secondary axes (Nby=Nbc+Nbx), giving the branching rate of the main axis for given year, and the percentage of secondary axes with cones (%bc=Nbc / Nby). On plots 3A and 3C, the total number of needles (Nn), including living needles and the scars of fallen needles, was counted for the last 6 years (2000-2005) on all measured shoots. On all plots, the needle length (Nl) was measured on each of the annual shoots where needles remained, taking at random 10 needles by annual shoot when available, or else all the existing or remaining needles.
2.3 - Statistical analysis
A Principal Components Analysis (PCA) was first performed to provide an overall assessment of the role of time (year of measure) and the correlations between measured variables. It was computed with all the trees for which height variables (Blg, Sl, Mf, Nbc, Nby, Nc, Rw, %bc) were available for the period 1995-2005.
Then, the difference between years and between plots for all measured variables was tested with a two factor variance analysis and a Tukey test with a confidence interval of 95 %.
Finally, the relation between these variables and the climate was investigated with a Partial Least Square (PLS) regression. PLS regression was chosen because it makes handling many variables with relatively few observations possible (Cramer et al., 1998) and copes with correlated variables (Wold, 1995). The number of components was chosen by a permutation test (Good, 1994) with a 5 % threshold for the explained variance. Variables were tested with a 1,000-steps cross-validation test (Amato and Vinzi, 2003): variables were accepted only when the confidence interval (P<5%) for their partial correlation coefficient did not include 0. The development of tree organs during one year (n) depends on climatic conditions of the current year and on those of the previous year (n-1): the climatic parameters tested for the regression were the rainfall (P), the maximum temperature (Tmax) and the minimum temperatures (Tmin) from January of year (n-1) to June of year (n) over the period 1994-2005, according to the phenology of this species in Southeastern France (Orshan, 1989). A synthetic drought index (S = P-2Tmax) was also used when rain and temperature variables separately were not significant. Statistical analyses were computed with R software (R development core team, 2004)
3 - Results
3.1 - Discrimination of the years with tree development parameters
We finally used for the PCA a group of five non-redundant variables describing radial growth, crown development, male bloom and fruiting. Nbc, NC and Sl, redundant respectively with Nby, %bc and Blg, were eliminated after a first test with all variables, these correlations biasing the weight and direction of the main axes towards redundant variables. The PCA first axis (Fig. 2), strongly correlated with Nby and Blg, corresponded clearly to the crown development (branch growth, branching rate).
-0.8 -0.4 0 0.4 0.8 -0.8 -0.4 0 0.4 0.8 1.2 Mf %bc Rw Nby Blg 1996 1997 1999 1998 2000 2001 2004 2002 2003 2005 1995 ACP plan e Axis 1 A x is 2
Fig. 2: PCA main plane (axes 1 and
2), 1995–2005 period, for every tree and all plots, using five non-redundant variables (Rw, Blg, Nby, Mf, and %bc). The first two axes explained, respectively, 31 and 22% of the total inertia.
Axis 2 contrasted the male bloom (Mf) with abundant fruiting (%bc) associated with wide rings (Rw). The male bloom was generally contrasted with all variables related to a good growth (crown and rings).
In the PCA plane, years were represented as the barycenter of the observations concerned (one observation = one measure of all the parameters on one tree for a given year).
Three groups of years appeared:
- 1995-96 + 2000, characterized by good fruiting associated with wide rings but with weak development of the crown and few or no male flowers.
- 1997-98-99 characterized by a good development of the crown, intermediate radial growth and fruiting and no male flowers.
- 2001-03-04-05 characterized by a strong male bloom, no fruiting and very slow growth (rings and crown).
2002 was intermediate for most of the parameters, crown development being rather weak. 3.2 - Differences between plots and between years
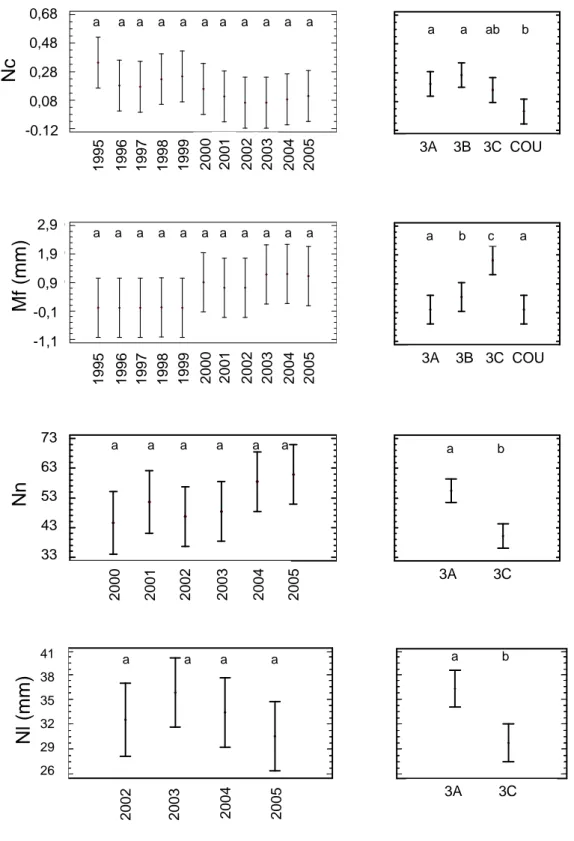
The variance analysis and Tukey test (Fig. 3) showed wide and often significant differences between plots for a majority of variables, due either to the Courchons plot (Blg, Nc, Nby), or to differences between the plots at Sainte-Baume (Blg, Mf, Nn, Nl). Within the Sainte-Baume massif, 3C plot differed from the two others for Blg and Mf, whereas the transition was progressive for Nl. Site quality was overall a discriminant factor.
With ANOVA tests, years differed mainly for Rw, Blg and Nby. Even if fruiting (Nc) seemed to be better from 1995 to 1999 and decreased to very low in the last years, and no male flowers (Mf) could be found before 2000, differences were not significant for these two parameters. This is probably due on one hand to a few outliers in data, increasing the variance, and on the other to a large number of null values. The trends observed for these variables in figure 3 confirm and explain clearly the groups of years differentiated by the PCA.
3.3 - Relations between tree parameters and climate
In the PLS regression, the low number of observations (16) and the high annual variability of the climate made grouping monthly climatic parameters necessary to obtain significant variables. We grouped the months having the same sign for their individual correlation coefficients.
Figure 4 shows the relations between tree variables and climate parameters. Overall, the climatic conditions of year (n-1), rainfall as well as temperature, seemed to play an important role in the growth, crown development and reproduction of Scots pine.
4 - Discussion
4.1 - Impact of climate and time on tree development and reproduction
In the PCA main plane, the crown development (Blg and Nby) seems to be independent of the radial growth (Rw). This independence is also clear in the relative weight of the explanatory variables highlighted by the PLS: radial growth is more sensitive to the climatic parameters of the current year (n) while crown development depends more on the climate of the previous year (n-1). Male blooming is in opposition to fruiting, and overall to good growth of the trees. These oppositions explain the distribution of the years in 3 groups in the PCA plane.
Fig. 3: Two ANOVA factors for all measured variables, average and confidence interval (95 %) for
years and plots.
Year LC 1995 1996 1997 1998 1999 2000 2001 2002 2003 2004 2005 0.62 0.82 1.02 1.22 1.42
Rw
1,42 1,22 1,02 0,82 0,62 19 95 1996 1997 1998 1999 2000 2001 2002 2003 20 04 200 5 a a a ab ab a c ab bc c c Plot LC 3A 3B 3C COU1 0.62 0.82 1.02 1.22 1.42 3A 3B 3C COU a a a a Year LP ( m m ) 1995 1996 1997 1998 1999 2000 2001 2002 2003 2004 2005 21 31 41 51 61 71Bl
g
(m
m)
61 41 21 1995 19 96 199 7 19 98 1 999 2000 2001 2002 2003 2004 2005a-d a-c ab a a-c b-e a-e de de cde e
Plot LP ( m m ) 3A 3B 3C COU1 21 31 41 51 61 71 3A 3B 3C COU a a b c Year Nb y 1995 1997 1999 2001 2003 2005 0.7 1.1 1.5 1.9 2.3 1995 1996 1997 1998 1999 2000 200 1 2002 2003 2004 2005 bd bd ad ac a bd bd bd bd bd bcd 2,3 1,9 1,5 1,1 0,7
Nby
Plot Nb y 3A 3B 3C COU1 0.7 1.1 1.5 1.9 2.3 3A 3B 3C COU a a a b Year _ b c 1995 1997 1999 2001 2003 2005 -0.01 0.04 0.09 0.14 0.19 0.24 0.29 0.34%bc
0,29 0,19 -0,09 -0,01 199 5 19 96 19 97 19 98 1999 2000 2001 2002 20 03 2004 2005 a a a a a a a a a a a Plot _ b c 3A 3B 3C COU1 -0.01 0.04 0.09 0.14 0.19 0.24 0.29 0.34 3A 3B 3C COU a a a b Year LC 1995 1996 1997 1998 1999 2000 2001 2002 2003 2004 2005 0.62 0.82 1.02 1.22 1.42Rw
1,42 1,22 1,02 0,82 0,62 19 95 1996 1997 1998 1999 2000 2001 2002 2003 20 04 200 5 a a a ab ab a c ab bc c c Plot LC 3A 3B 3C COU1 0.62 0.82 1.02 1.22 1.42 3A 3B 3C COU a a a a Year LC 1995 1996 1997 1998 1999 2000 2001 2002 2003 2004 2005 0.62 0.82 1.02 1.22 1.42Rw
1,42 1,22 1,02 0,82 0,62 19 95 1996 1997 1998 1999 2000 2001 2002 2003 20 04 200 5 a a a ab ab a c ab bc c c Year LC 1995 1996 1997 1998 1999 2000 2001 2002 2003 2004 2005 0.62 0.82 1.02 1.22 1.42Rw
1,42 1,22 1,02 0,82 0,62 19 95 1996 1997 1998 1999 2000 2001 2002 2003 20 04 200 5 19 95 1996 1997 1998 1999 2000 2001 2002 2003 20 04 200 5 a a a ab ab a c ab bc c c Plot LC 3A 3B 3C COU1 0.62 0.82 1.02 1.22 1.42 3A 3B 3C COU a a a a Plot LC 3A 3B 3C COU1 0.62 0.82 1.02 1.22 1.42 3A 3B 3C COU a a a a Year LP ( m m ) 1995 1996 1997 1998 1999 2000 2001 2002 2003 2004 2005 21 31 41 51 61 71Bl
g
(m
m)
61 41 21 1995 19 96 199 7 19 98 1 999 2000 2001 2002 2003 2004 2005a-d a-c ab a a-c b-e a-e de de cde e
Plot LP ( m m ) 3A 3B 3C COU1 21 31 41 51 61 71 3A 3B 3C COU a a b c Year LP ( m m ) 1995 1996 1997 1998 1999 2000 2001 2002 2003 2004 2005 21 31 41 51 61 71
Bl
g
(m
m)
61 41 21 1995 19 96 199 7 19 98 1 999 2000 2001 2002 2003 2004 2005a-d a-c ab a a-c b-e a-e de de cde e
Year LP ( m m ) 1995 1996 1997 1998 1999 2000 2001 2002 2003 2004 2005 21 31 41 51 61 71
Bl
g
(m
m)
61 41 21 1995 19 96 199 7 19 98 1 999 2000 2001 2002 2003 2004 2005 1995 19 96 199 7 19 98 1 999 2000 2001 2002 2003 2004 2005a-d a-c ab a a-c b-e a-e de de cde e
Plot LP ( m m ) 3A 3B 3C COU1 21 31 41 51 61 71 3A 3B 3C COU a a b c Plot LP ( m m ) 3A 3B 3C COU1 21 31 41 51 61 71 3A 3B 3C COU a a b c Year Nb y 1995 1997 1999 2001 2003 2005 0.7 1.1 1.5 1.9 2.3 1995 1996 1997 1998 1999 2000 200 1 2002 2003 2004 2005 bd bd ad ac a bd bd bd bd bd bcd 2,3 1,9 1,5 1,1 0,7
Nby
Plot Nb y 3A 3B 3C COU1 0.7 1.1 1.5 1.9 2.3 3A 3B 3C COU a a a b Year Nb y 1995 1997 1999 2001 2003 2005 0.7 1.1 1.5 1.9 2.3 1995 1996 1997 1998 1999 2000 200 1 2002 2003 2004 2005 bd bd ad ac a bd bd bd bd bd bcd 2,3 1,9 1,5 1,1 0,7Nby
Year Nb y 1995 1997 1999 2001 2003 2005 0.7 1.1 1.5 1.9 2.3 1995 1996 1997 1998 1999 2000 200 1 2002 2003 2004 2005 1995 1996 1997 1998 1999 2000 200 1 2002 2003 2004 2005 bd bd ad ac a bd bd bd bd bd bcd 2,3 1,9 1,5 1,1 0,7Nby
Plot Nb y 3A 3B 3C COU1 0.7 1.1 1.5 1.9 2.3 3A 3B 3C COU a a a b Year _ b c 1995 1997 1999 2001 2003 2005 -0.01 0.04 0.09 0.14 0.19 0.24 0.29 0.34%bc
0,29 0,19 -0,09 -0,01 199 5 19 96 19 97 19 98 1999 2000 2001 2002 20 03 2004 2005 a a a a a a a a a a a Plot _ b c 3A 3B 3C COU1 -0.01 0.04 0.09 0.14 0.19 0.24 0.29 0.34 3A 3B 3C COU a a a b Year _ b c 1995 1997 1999 2001 2003 2005 -0.01 0.04 0.09 0.14 0.19 0.24 0.29 0.34%bc
0,29 0,19 -0,09 -0,01 199 5 19 96 19 97 19 98 1999 2000 2001 2002 20 03 2004 2005 199 5 19 96 19 97 19 98 1999 2000 2001 2002 20 03 2004 2005 a a a a a a a a a a a Plot _ b c 3A 3B 3C COU1 -0.01 0.04 0.09 0.14 0.19 0.24 0.29 0.34 3A 3B 3C COU a a a bFig. 3: continued Year NC 1995 1997 1999 2001 2003 2005 -0.12 0.08 0.28 0.48 0.68 19 95 19 96 19 97 19 98 199 9 20 00 200 1 20 02 20 03 20 0 4 2 005
Nc
0,68 0,48 0,28 0,08 -0.12 a a a a a a a a a a a Plot NC 3A 3B 3C COU1 -0.12 0.08 0.28 0.48 0.68 3A 3B 3C COU a a ab b Year CH ( m m) 1995 1997 1999 2001 2003 2005 -1.1 -0.1 0.9 1.9 2.9 2,9 1,9 0,9 -0,1 -1,1Mf
(m
m)
1 995 19 96 19 97 19 98 199 9 20 00 200 1 20 02 20 03 2 004 2 005 a a a a a a a a a a a Plot C H ( mm) 3A 3B 3C COU1 -1.1 -0.1 0.9 1.9 2.9 3A 3B 3C COU a b c a Year Ng ai 2000 2001 2002 2003 2004 2005 33 43 53 63 73 73 63 53 43 33Nn
a a a a a a 20 01 20 02 20 03 20 04 20 05 20 00 Plot Ng a i 3A 3C 37 47 57 67 77 3A 3C a b N I ( mm) 2002 2003 2004 2005 Moyennes et 95,0% de Tukey HSD Années 26 29 32 35 38 41 N I ( mm) 3A 3C Moyennes et 95,0% de Tukey HSD Placettes 26 29 32 35 38 41 20 02 20 03 20 04 2 005 3A 3C a b 41 38 35 32 29 26Nl
(mm)
a a a a N I ( mm) 2002 2003 2004 2005 Moyennes et 95,0% de Tukey HSD Années 26 29 32 35 38 41 N I ( mm) 3A 3C Moyennes et 95,0% de Tukey HSD Placettes 26 29 32 35 38 41 20 02 20 03 20 04 2 005 20 02 20 03 20 04 2 005 3A 3C a b 41 38 35 32 29 26Nl
(mm)
a a a a Year NC 1995 1997 1999 2001 2003 2005 -0.12 0.08 0.28 0.48 0.68 19 95 19 96 19 97 19 98 199 9 20 00 200 1 20 02 20 03 20 0 4 2 005Nc
0,68 0,48 0,28 0,08 -0.12 a a a a a a a a a a a Plot NC 3A 3B 3C COU1 -0.12 0.08 0.28 0.48 0.68 3A 3B 3C COU a a ab b Year NC 1995 1997 1999 2001 2003 2005 -0.12 0.08 0.28 0.48 0.68 19 95 19 96 19 97 19 98 199 9 20 00 200 1 20 02 20 03 20 0 4 2 005Nc
0,68 0,48 0,28 0,08 -0.12 a a a a a a a a a a a Year NC 1995 1997 1999 2001 2003 2005 -0.12 0.08 0.28 0.48 0.68 19 95 19 96 19 97 19 98 199 9 20 00 200 1 20 02 20 03 20 0 4 2 005 19 95 19 96 19 97 19 98 199 9 20 00 200 1 20 02 20 03 20 0 4 2 005Nc
0,68 0,48 0,28 0,08 -0.12 a a a a a a a a a a a Plot NC 3A 3B 3C COU1 -0.12 0.08 0.28 0.48 0.68 3A 3B 3C COU a a ab b Plot NC 3A 3B 3C COU1 -0.12 0.08 0.28 0.48 0.68 3A 3B 3C COU a a ab b Year CH ( m m) 1995 1997 1999 2001 2003 2005 -1.1 -0.1 0.9 1.9 2.9 2,9 1,9 0,9 -0,1 -1,1Mf
(m
m)
1 995 19 96 19 97 19 98 199 9 20 00 200 1 20 02 20 03 2 004 2 005 a a a a a a a a a a a Plot C H ( mm) 3A 3B 3C COU1 -1.1 -0.1 0.9 1.9 2.9 3A 3B 3C COU a b c a Year CH ( m m) 1995 1997 1999 2001 2003 2005 -1.1 -0.1 0.9 1.9 2.9 2,9 1,9 0,9 -0,1 -1,1Mf
(m
m)
1 995 19 96 19 97 19 98 199 9 20 00 200 1 20 02 20 03 2 004 2 005 a a a a a a a a a a a Year CH ( m m) 1995 1997 1999 2001 2003 2005 -1.1 -0.1 0.9 1.9 2.9 2,9 1,9 0,9 -0,1 -1,1Mf
(m
m)
1 995 19 96 19 97 19 98 199 9 20 00 200 1 20 02 20 03 2 004 2 005 1 995 19 96 19 97 19 98 199 9 20 00 200 1 20 02 20 03 2 004 2 005 a a a a a a a a a a a Plot C H ( mm) 3A 3B 3C COU1 -1.1 -0.1 0.9 1.9 2.9 3A 3B 3C COU a b c a Plot C H ( mm) 3A 3B 3C COU1 -1.1 -0.1 0.9 1.9 2.9 3A 3B 3C COU a b c a Year Ng ai 2000 2001 2002 2003 2004 2005 33 43 53 63 73 73 63 53 43 33Nn
a a a a a a 20 01 20 02 20 03 20 04 20 05 20 00 Plot Ng a i 3A 3C 37 47 57 67 77 3A 3C a b Year Ng ai 2000 2001 2002 2003 2004 2005 33 43 53 63 73 73 63 53 43 33Nn
a a a a a a 20 01 20 02 20 03 20 04 20 05 20 00 Year Ng ai 2000 2001 2002 2003 2004 2005 33 43 53 63 73 73 63 53 43 33Nn
a a a a a a 20 01 20 02 20 03 20 04 20 05 20 00 20 01 20 02 20 03 20 04 20 05 20 00 Plot Ng a i 3A 3C 37 47 57 67 77 3A 3C a b Plot Ng a i 3A 3C 37 47 57 67 77 3A 3C a b N I ( mm) 2002 2003 2004 2005 Moyennes et 95,0% de Tukey HSD Années 26 29 32 35 38 41 N I ( mm) 3A 3C Moyennes et 95,0% de Tukey HSD Placettes 26 29 32 35 38 41 20 02 20 03 20 04 2 005 3A 3C a b 41 38 35 32 29 26Nl
(mm)
a a a a N I ( mm) 2002 2003 2004 2005 Moyennes et 95,0% de Tukey HSD Années 26 29 32 35 38 41 N I ( mm) 3A 3C Moyennes et 95,0% de Tukey HSD Placettes 26 29 32 35 38 41 20 02 20 03 20 04 2 005 20 02 20 03 20 04 2 005 3A 3C a b 41 38 35 32 29 26Nl
(mm)
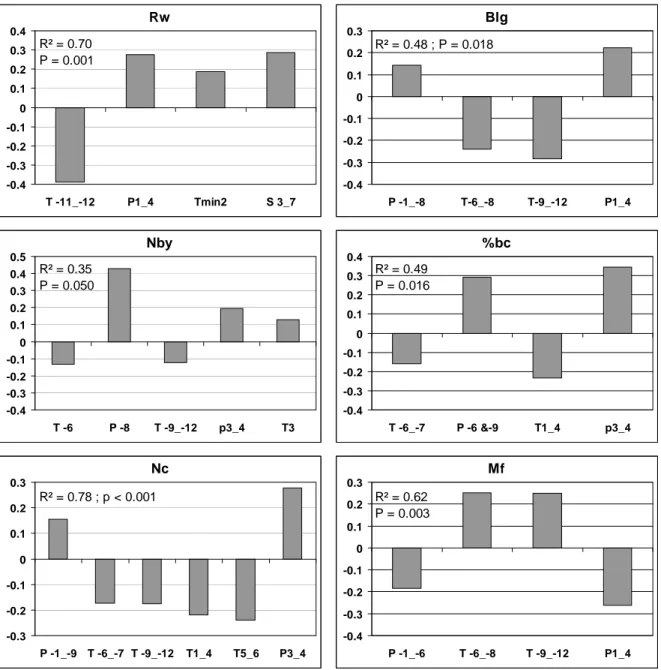
a a a aFig. 4: Significant climate parameters R2 and P values in PLS regression (one significant component)
for the main measured variables. P rainfall, T monthly mean maximum temperature, Tmin monthly mean minimum temperature, S = (P - 2T). 4 and -4 means, respectively, April of the current year (n) and of the previous year (n - 1). T-9_-12 and P1_4 means, respectively, the average (for the temperatures) or the sum (for rainfall) of monthly climatic parameters between September and December of year (n - 1) and from January to April of year (n). P-6 and -9 means the sum of the rains of June and September of year (n - 1)
Rw -0.4 -0.3 -0.2 -0.1 0 0.1 0.2 0.3 0.4 T -11_-12 P1_4 Tmin2 S 3_7 Blg -0.4 -0.3 -0.2 -0.1 0 0.1 0.2 0.3 P -1_-8 T-6_-8 T-9_-12 P1_4 Nby -0.4 -0.3 -0.2 -0.1 0 0.1 0.2 0.3 0.4 0.5 T -6 P -8 T -9_-12 p3_4 T3 %bc -0.4 -0.3 -0.2 -0.1 0 0.1 0.2 0.3 0.4 T -6_-7 P -6 &-9 T1_4 p3_4 Nc -0.3 -0.2 -0.1 0 0.1 0.2 0.3 P -1_-9 T -6_-7 T -9_-12 T1_4 T5_6 P3_4 Mf -0.4 -0.3 -0.2 -0.1 0 0.1 0.2 0.3 P -1_-6 T -6_-8 T -9_-12 P1_4 R² = 0.70 P = 0.001 R² = 0.48 ; P = 0.018 R² = 0.49 P = 0.016 R² = 0.35 P = 0.050 R² = 0.78 ; p < 0.001 R² = 0.62 P = 0.003
Fruiting potential (%bc) and branching (Nby) are assumed to be predetermined in the terminal buds formed in the previous year (n-1), and therefore linked to the climate of the months preceding and accompanying bud formation. Practically, each cone takes the place of one secondary axis in the branch whorl on the main axis. This is why good fruiting years showed a low or intermediate branching rate. Therefore fruiting and branching are independent in the PCA plane and partially explained by different climate parameters in the PLS regression. Climate conditions determining potential female flowers in the buds may be partly different from those inducing only potential secondary axis. Fruiting potential (%bc) is to some extent opposed to branch length growth (Blg), although PLS regression showed they partly depend on the same climate parameters. When cones develop, they use a large amount of the resources of the axis. The competition between fruit and
shoots seems to increase with increasing stress, as several main axes finally aborted on measured branches when cones developed at their base in the last 5 years.
Ring width index collapsed from 2003 to 2005, significantly below the levels of 1995-2000, confirming the response of Scots pine to the 2003 scorching heat in Austria (Pichler and Oberhuber, 2007). Earlier in our study area, Tessier (1984 and 1989) observed ring width reduction for previous severe droughts equivalent to that of 2003 or 2001 but trees recovered after one or two years. Confirming these results, after a very bad year in 2001, 2002 was favorable and allowed trees to recover. The impact of the 2003 scorching heat is clear but was less than in 2001. The small 2003 ring is mainly due to the very narrow latewood, tree radial growth having been halted suddenly by continuous extreme temperatures and water stress since the end of May, when most of the earlywood was already formed. At the end of summer 2003, only the needles of the current year remained on most of the trees. Repeated drought in 2004 and 2005 meant they where unable to restore their leaf area. The cumulative impact of years 2001 to 2005 explains the continuous decrease of Rw since 2003 as well as the same trend and very low values of Blg and Nby in the last 5 years.
As a result of the small number of observations (11 years), the sometimes wide seasonal grouping of monthly climatic parameters in the PLS regression varies from one studied variable to another, even when these variables are strongly correlated. The months of May have been rainy twice in the middle of the period of generally very dry springs and summers from 2000 to 2005. These two outliers in opposition to the seasonal overall water-balance (figure 5), rule out from using this parameter individually or from including it in a small group with the previous or following months. In previous studies on the same sites, May rainfall and temperature were considered as key parameters for Scots pine radial growth (Vila and al, 2008).
Nevertheless, groups of climate parameters selected by PLS regression can be considered as representative of five ecologically critical periods:
- (1) January to July, August or September of year (n-1): high total rainfalls preceding or
accompanying bud formation are favorable for all variables except Mf. This group is the most variable due to the high variation of rainfall data in May (see above).
- (2) June to August of year (n-1): high temperatures just before or during bud formation are unfavorable to crown development (Nby, Blg) and fruiting (Nc, %bc).
- (3) September to December of year (n-1): high temperatures in this period are unfavorable for all variables except Mf.
- (4) January to April of year (n): during this period, high rainfall improves growth and fruiting whereas high temperatures are unfavorable to crown development and fruiting.
- (5) April to June of year (n): in this last critical period, water stress (high temperatures or low rainfall) limits the radial growth and the number of surviving cones.
The first two periods determine tree vigor and the amount of available reserves at the time of bud formation, when all growth units and architecture for the next year are predetermined (Debazac, 1966; Junttila, 1986; Philippe et al., 2006). This is why their coefficients are high in PLS regression for crown development, fruiting and male bloom. Adverse conditions in the first half of year (n-1) limit the potential growth, branching and number of cones even in the case of good conditions during the current growing year. Unlike polycyclic pines, Scots pine being monocyclic has no possible compensation for this limitation with a second or third annual growth cycle (Serre, 1976). The trend to produce less cones and more male flowers is natural with branch ageing, at the base of the canopy and on shaded branches, that is to say as soon as the branches lose dominance or lack resources (Caraglio et al., 2007). Inside the complex bud of the main shoot, male flower meristems appear at the beginning of summer while female flower meristems form at the end of summer or the beginning of autumn, according to a set of complex interacting process (Philippe et al., 2006). With high temperature in the second period (summer n-1), or when their health status is poor overall, trees favor the production of male flowers in most of the crown, less resource-demanding than cones and ensuring long distance dissemination for their genes.
The third critical period is the end of year (n-1), mainly for temperature. Cruiziat et al. (2002) showed that a lack of cold in winter, (successions of warm and cold periods) leads to reversible cavitation in the vessels, decreasing their conductivity at budbreak. This is likely to happen in the Sainte-Baume where deep frosts alternating with hot periods are common in winter. Falusi et al. (1990) and Calamassi (1996) also showed that the lack of cold in winter delays budbreak. This delay is particularly detrimental to Scots pine in the Mediterranean region where its growth season is already very short. Finally, hot temperatures maintain significant physiological activity after the growth season, which wastes a lot of energy (Damesin, 2003). Holst et al (2008) have shown for Scots pine that CO2 net uptake could occurs in winter during mild weather conditions. Whereas this process can
partially compensate for the carbon loss in summer drought periods, the reserves used in this period are no longer available for spring growth and organ development. This could explain the decrease of Nc (abortion) without a decrease of %bc.
Abundant rainfall in the 4th period (first months of the year n) fill soil water reserves, limiting the stress at the beginning of the growth period and improving naturally all growth variables as well as helping cones to develop and survive. High temperatures during this period are detrimental to fruiting but, probably indirectly through limited competition with cones, improve branching rate (Nby).
In the last critical period (spring of year n), combined abundant rainfall and moderate temperature (good S index) are necessary for good radial growth. S index is significant up to July. High temperature in May and June (like in previous months) reduce fruiting success, leading probably to partial cone abortion.
If the number of cones which appear at the base of the main axis is predetermined in the summer of year (n-1), their successful development seems to depend broadly on the climate conditions at the beginning of their growth. Although floral initiation is not controlled by a single stimulus but a range of processes which interfere mutually, climate of the year (n-1) and of the year (n) respectively appear to have a considerable weight in governing the differentiation of the bud then as the factor determining the growth. However growth and flowering/fructification depend also largely on other factors which influence the initiation and the development of meristems, support their orientation in sexual buds or not and in some cases their male or female orientation (Philippe et al, 2006).
4.2 - Differences between plots
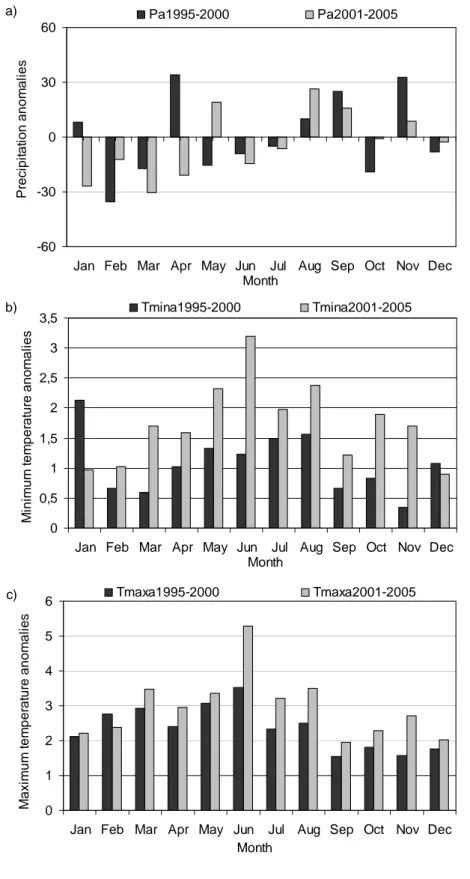
We observed a significant plot effect for several parameters. Crown development (Blg and Nby) was better at Courchons than at Sainte-Baume. The difference seems to be explained by the younger age of Courchons plot (Table 1), as branch length growth and branching rate decrease gradually with age Makela et al., 1998) and perhaps by a more favorable climate at Courchons. However, the collapse of Blg and Nby since 2000 cannot be explained by these natural and slow age trends. It is clearly related to the climate shift since 2000, with increasing minimum and maximum temperatures and decreasing rainfall between 1995-2000 and 2001-2005, and to extreme climate conditions since 2003 (Fig. 5).
Within the Sainte-Baume massif, lower Blg values in 3C plot are explained by unfavorable site conditions, water stress occurring early in spring (Fig. 5) limiting female flowers and secondary axis induction in the bud in year (n-1), and favoring cone and axis abortions in year (n). The same constraints gradient explains that Nn and Nl are higher in plots 3A compared to 3C in Sainte-Baume, as observed by Niinemets and Lukjanova (2003) on contrasted sites. No significant difference was found between years for Nn and Nl due to a high variability between trees and between plots.
Within the Sainte-Baume massif, male bloom is all the more intense since the site conditions are unfavorable, confirming the key role played by stress in this bloom (Philippe et al., 2006) as already shown by PLS analysis with climate parameters. The trend to produce more male flowers with increasing age (Peter et al., 1997, Caraglio et al., 2007) could explain the generally low production of male flowers at Courchons, where this production however increased in the last years as at Sainte-Baume.
Soil water reserve becomes smaller when grading from plot A to plot C (Table 1) with conditions progressively more adverse to growth and to survival. Water limitations probably occur earlier in the growth season and are higher during drought episodes in plot C. In plots A and B, soil water reserve probably becomes a limiting factor to physiological processes later in the growth season inducing
longer growth seasons and higher growth rates. In 2003–2005, water limitations occurred earlier in the growth season. This considerably limited the growth season, especially for the trees of plots A and B. At their limit of growth capacity, trees of plots C were no more affected than usual. Consequently, effects appeared weaker at the poor sites.
Results for short-term ring width trends complete those obtained by Vila et al. (2008) for the long term. They highlight the relation between crown development and radial growth through the delayed impact of previous years’ climatic parameters on tree health status and vigor in year (n). They confirm the role of drought and scorching heat and their repetition in the negative radial growth trend observed over the 1900–2000 period.
0 0,5 1 1,5 2 2,5 3 3,5
Jan Feb Mar Apr May Jun Jul Aug Sep Oct Nov Dec
Tmina1995-2000 Tmina2001-2005 M ini m um t em p er at ur e anom al ie s Month b) 0 1 2 3 4 5 6
Jan Feb Mar Apr May Jun Jul Aug Sep Oct Nov Dec
Tmaxa1995-2000 Tmaxa2001-2005 M a xi m u m t e m p er at ur e anom al ie s Month c) -60 -30 0 30 60
Jan Feb Mar Apr May Jun Jul Aug Sep Oct Nov Dec
Pa1995-2000 Pa2001-2005 P reci pi tat ion ano m al ies a) Month
Fig. 5: Shift of monthly
mean rainfall and
temperatures of 1995-2000
and 2001-2005 periods
compared to 1961-2005.
3a: Pa = precipitation
(rainfall); 3b: Tmina =
minimum temperature 3c:
Tmaxa = maximum
temperatures.
5 - Conclusion and prospects
The immediate impact of the 2003 scorching heat and drought was not exceptional but contributed to a series of unfavorable years beginning in 2000. Because of the delayed effects of water or thermic stress on crown development, the impact of 2003 was especially significant in 2004. Repeated drought in 2004 and 2005 increased and extended the impact of 2003, leading to a collapse of Scots pine radial growth and crown development, and extensive dieback in Southeastern France. It is difficult to assess the respective weight of 2003 direct impact and that of repeated droughts in forest die-back or poor growth. In other countries, occasional severe droughts caused middle term decline in productivity and delayed die-back up to 10 years later (Biggler, 2006) without repeated or exceptional stress in following years.
Our study enhances our knowledge on Scots pine. We have clarified the relative weight of climate parameters of the current and previous year in tree growth, morphological development and reproduction, and shown that the stress induced by poor site conditions leads generally to the same consequences for trees as unfavorable climate conditions.
The significant interaction between years and plots demonstrated the importance of the interaction between site conditions and climate in the response of trees to climate change.
Series of unfavorable years including extreme events such as 2003 should become common in the next decades and should be considered at least as important as the mean climate shift for the future of Scots pine in the Mediterranean region. With the forecast climate change, Scots pine appears to be at risk in these regions.
The reduction of leaf area and crown density after such repeated stress should be taken into account in tree growth models and in all models using tree canopy or leaf area characteristics as input to calculate gas, energy and water flows between vegetation and the atmosphere.
Bibliography
Amato S, Vinzi V (2003) Bootstrap-based Qkh² for the selection of components and variables in PLS regression. Chem intel Lab Syst 68:5-16
Beniston M, Diaz HF (2004) The 2003 heat wave as an example of summers in a greenhouse climate ? Observations and climate model simulations for Basel Switzerland. Glob planet change 44:73-81
Bigler C, Bräker O.U, Bugman H, Dobbertin M, Rigling A (2006) Drought as an Inciting Mortality Factor in Scots Pine Stands of the Valais, Schweizerland, Ecosystems, 9:330-343
Breda N, Huc R, Granier A, Dreyer E (2006) Temperate forest trees and stands under severe drought: a review of ecophysiological responses, adaptation processes and long-term consequences. Annals of Forest Science 63(6):625–644.
Butzer K.W. (2005) Environmental history in the Mediterranean world: cross-disciplinary investigation of cause-and-effect for degradation and soil erosion. Journal of Archaeological Science, 32(12): 1773-1800.
Calamassi, R. (1996) Geographic variation and bud dormancy in beech seedlings (Fagus sylvatica L). Annals of Forest Science 53(5):967-979
Caraglio, Y.; Pimont, F.; Rigolot, E. 2007. Pinus halepensis Mill. architectural analysis for fuel modelling. In: Lovreglio R, Leone V (eds) MEDPINE 3. Conservation, regeneration and restoration of Mediterranean pines and their ecosystems, pp. 43-60
Cramer RDI, Bunce JD, Paterson DE, Frank IE (1988) Crossvalidation, bootstrapping, and partial least square compared with multiple regression in conventional QSAR studies. Quantitative Structure-Activity Relationships 7:18-25
Cruiziat P, Cochard H, Ameglio T. (2002) Hydraulic architecture of trees: main concepts and results Annals of Forest Science 59(7):723-752
Damesin C. (2003) Respiration and photosynthesis characteristics of current-year stems of Fagus
Debazac EF (1966) Les modalités de la croissance en longueur chez les pins. In : Mémoires de la Société botanique de France, Colloque "Physiologie de l'arbre", pp 1-14
Dobbertin M (2005) Tree growth as indicator of tree vitality and of tree reaction to environmental stress: a review. European Journal of Forest Research 124:319-333
Falusi, M., Calamassi, R. (1990) Bud dormancy in beech (Fagus sylvatica L.). Effect of chilling and photoperiod on dormancy realease of beach seedlings. Tree physiology 6(4):429-438
Fritts HC, Swetnam TW (1989) Dendroecology: a tool for evaluating variations in past and present forest environments. Utility Air Regulatory Group, Acid Deposition Committee, Washington D.C, 61p
Good P (1994) Permutation tests. Springer-Verlag, New-York
Guiot, J. & Goeury, C. (1996) PPPBase, a software for statistical analysis of paleoecological and paleoclimatological data. Dendrochronologia 14:295-300
Hesselbjerg-Christiansen J, Hewitson B (2007) Regional Climate Projection. In: IPCC (2007) Climate Change 2007: The Physical Science Basis. Contribution of Working Group I to the Fourth Assessment Report of the Intergovernmental Panel on Climate Change. Solomon S Qin D, Manning M, Chen Z, Marquis M, Averyt KB Tignor M Miller HL (eds), Cambridge University Press, Cambridge, United Kingdom and New York, NY, USA
Holst J. Barnard R, Brandes E, Buchmann N, Gessler A, and Jaeger L. (2008), Impacts of summer water limitation on the carbon balance of a Scots pine forest in the southern upper Rhine plain, Agricultural and Forest Meteorology. 148:1815-1826
Junttila O (1986) Effects of temperature on shoot growth in northern provenances of Pinus sylvestris L. Tree Physiology 1:185-192
Landmann G, Bre´da N, Houllier F, Dreyer E, Flot JL (2003) Sècheresse et canicule de l’été 2003: quelles conséquences pour les forêts françaises? Revue Forestière Française (55) 4:299–308 Le Houe´rou HN (2005) The Isoclimatic Mediterranean Biomes: bioclimatology, diversity and
phytogeography. Copymania publication, Montpellier, 840 p.
Luterbacher J, Dietrich D, Xoplaki E, Grosjean M, Wanner H (2004) European Seasonal and Annual Temperature Variability, Trends, and Extremes Since 1500. Science 303:1499-1503
Makela A. ; Vanninen P. (1998) Impacts of size and competition on tree form and distribution of aboveground biomass in Scots pine. Canadian Journal of Forest Research-Revue Canadienne De Recherche Forestiere, vol. 28, n° 2, p. 216-227.
Niinemets Ü, Lukjanova A (2003) Needle longevity, shoot growth and branching frequency in relation to site fertility and within-canopy light condition in Pinus sylvestris. Annals of Forest Science 60(3):195-208
Orshan G (1989) Plant pheno-morphological studies in mediterranean type ecosystems. Kluwer Academic Publishers, Dordrecht, The Netherlands
Pauly H, Belrose V (2005) La santé des forêts françaises: actualités de l´année 2004 - Sécheresse et canicule de l'été 2003 : observation en 2004 des conséquences sur les peuplements forestiers adultes. Rapport Ministère de L'Agriculture, de l'Alimentation, de la Pêche et de la Ruralité, Département Santé des Forêts, Paris, 11 p
Peter G, Klinkhamer L, Jong DTJ (1997) Size-dependent allocation to male and female reproduction. In: J Plant resource allocation, Bazzaz F.A. (eds), San Diego, London, Boston, New York, Sydney, Tokyo, Toronto, Academic Press, pp 211-226
Philippe G, Baldet P, Héois B, Ginisty C (2006) Reproduction sexuée des conifères et production de semences en vergers à graines. Cemagref Collection Synthèse, Antony
Pichler P, Oberhuber W (2007) Radial growth response of coniferous forest trees in an inner Alpine environment to heat-wave in 2003. Forest Ecology and Management 242:688-699
Price RA, Liston A, Strauss SH (1998) Phylogeny and systematics of Pinus. In: Richardson D.M (eds) Ecology and biogeography of Pinus. Cambridge Univ. Press, Cambridge, pp 49-68
R_Development_Core_Team (2004) R: A language and environment for statistical computing. R Foundation for Statistical Computing.
Rebetez M, Dobbertin M (2004) Climate change may already threaten Scots pine stands in the Swiss Alps. Theoritical and Applied Climatology 79:1-9
Rebetez M, Mayer H, Dupont O, Schindler D, Gartner K, Kropp JP, Menzel A (2006) Heat and drought 2003 in Europe: a climate synthesis. Ann For Sci 63:569-577
Ripert C. ; Vennetier M. (2002) Guide Technique du Forestier Méditerranéen Français. Chapitre 2 bis : Evaluation des potentialités forestières. Cemagref Edition, Aix en Provence, 61 p.
Schar C, Vidale PL, Lûthi D, Frei C, Hâberli C, Liniger MA, Appenzeller C (2004) The role of increasing temperature variability for European summer heat waves. Nature 427:332-336 Serre F (1976) Les rapports de la croissance et du climat chez le Pin d'Alep (Pinus halepensis Mill.)
II. L'allongement des pousses et des aiguilles, et le climat. Discussion générale. Oecologia Plantarum 11:201-224
Tessier L (1984) Dendroclimatologie et Ecologie de Pinus sylvestris L. et Quercus pubescens Willd. dans le sud-est de la France. Université de Droit, d' Economie et des Sciences d' Aix-Marseille, Faculté des Sciences et Techniques de St-Jérôme, Laboratoire de Botanique historique et Palynologie, Thèse de Doctorat d' Etat mention Sciences
Tessier L (1989) Spatio-temporal analysis of climate-tree-ring relationships. New Phytologist 111:517-529
Vennetier M. ; Vila B. ; Liang E.Y. ; Guibal F. ; Thabeet A. ; Gadbin-Henry C. (2007) Impact of climate change on pine forest productivity and on the shift of a bioclimatic limit in a Mediterranean area. Options Méditerranéennes, Série A, vol. , n° 75, p. 189-197.
Vennetier M, Ripert C, Maille E, Blanc L, Torre F, Roche P, Tatoni T, Brun JJ (2008) A new bioclimatic model calibrated with flora for Mediterranean forest areas. Annals of Forest Science,
65 (711)
Vennetier M, Thabeet A, Gadbin-Henry C, Ripert C, Prevosto B, Borgniet L, Vila B, Guibal F, Ray R, Buron , Zanetti C (2009). Conséquences de la canicule et de la sécheresse 2003 sur les pins méditerranéens. In: Landman G Landeau S (eds) "Sécheresse et canicule 2003. Contribution des dispositifs de suivi et d’observation des forêts à la quantification des effets immédiats et à court terme", QUAE, Paris (in press)
Vila B, Vennetier M, Ripert C, Chandioux O, Liang E, Guibal F, Torre F (2008) Has global change induced opposite trends in radial growth of Pinus sylvestris and Pinus halepensis at their bioclimatic limit? The example of the Sainte-Baume forest (south-east France). Annals of Forest Science 65 (709)
Wold S (1995) PLS for multivariate linear modeling. In: Chemometric methods in Molecular Design. Waterbeemd VD (ed), Weinheim, Germany, pp 195-218