HAL Id: ird-01079243
https://hal.ird.fr/ird-01079243
Submitted on 31 Oct 2014
HAL is a multi-disciplinary open access
archive for the deposit and dissemination of
sci-entific research documents, whether they are
pub-lished or not. The documents may come from
teaching and research institutions in France or
abroad, or from public or private research centers.
L’archive ouverte pluridisciplinaire HAL, est
destinée au dépôt et à la diffusion de documents
scientifiques de niveau recherche, publiés ou non,
émanant des établissements d’enseignement et de
recherche français ou étrangers, des laboratoires
publics ou privés.
An Ecopath model of the Sine-Saloum Delta Biosphere
Reserve (Senegal)
Maria Concepcion Villanueva, Luis Tito de Morais, Jean-Yves Weigel, Jacques
Moreau
To cite this version:
Maria Concepcion Villanueva, Luis Tito de Morais, Jean-Yves Weigel, Jacques Moreau. An Ecopath
model of the Sine-Saloum Delta Biosphere Reserve (Senegal). Chavance Pierre; Ba Mamadou; Gascuel
Didier; Vakily Jan Michael; Pauly Daniel. Pêcheries maritimes, écosystèmes et sociétés en Afrique
de l’Ouest : un demi-siècle de changement : actes du symposium international = Marine fisheries,
ecosystems and societies in West Africa : half a century of change, Dakar (Sénégal), 24-28 juin 2002,
1 (15), Office des Publications Officielles des Communautés Européennes, pp.405-414, 2004, Rapport
de Recherche Halieutique ACP-UE, 92-894-7480-7. �ird-01079243�
An Ecopath Model
of the Sine-Saloum Delta Biosphere Reserve (Senegal)
-Note-Modèle Ecopath pour une réserve de la biosphère'
le delta du Siné-Saloum (Sénégal)
-
Note-Maria Concepcion VILLANUEVA
1,Luis TITO-OE-MoRAIS
2,Jean-Yves WEIGEL
3&
Jacques MOREAU
41. - Biologiste, thésarde, Institut national polytechnique de Toulouse
École nationale supérieure agronomique de Toulouse, Département des pêches continentales (I.N.P.T.-Ensat) [Nalional Po/l'/eehnie {nslilule of Toulouse, High National Agronomie Sehool of Toulouse,
Deparlmenl. of{n{and Fisheries],
B.P. 107, Auzeville-Tolosane 31326 Castanet-Tolosan, Toulouse (France). 2. - Biologiste, chercheur, Institut de recherche pour le développement (I.R.D.),
[Researeh {nslilule/or Del'elopmenl] B.P. 1386, Dakar (Sénégal).
3. - Économiste, chercheur, Institut de recherche pour le développement (I.R.D), [Researeh {nsliIUle/hr Del'e/opmenl]
B.P. 1386, Dakar (Sénégal).
4. - Biologiste, chercheur, Institut national polytechnique de Toulouse
École nationale supérieure agronomique de Toulouse (I.N.P.T.-Ensat), Département des pêches continentales [Nalional Po/l'/eehnie {llSlilule of Toulouse, High Nalional Agronomie Sehool orToulollse,
Departmenl.
0/
{nlund Fisheries],B.P. 107 , Auzeville-Tolosane 31326 Castanet-Tolosan, Toulouse (France).
406
VILLANUEVA (M.C.),L.Trro-DE-MoRAIS, J.-Y. WEIGEL& J. MOREAUABSTRACT
S
INE-SALOUM (Senegal), an inverse hyper saline estuG/Y, serves as an
im-portant resource offish for local populations. In the last 20 years, annual
catches have deereased (fi'om 30,000 to 15,000 t) as has the diversity ofspecies
in the catch.
Ethmalosa fimbriata, a pelagic C1upeid, is increasingly dominating
the estuCllY and, consequently, the fish landings. Ineffective fisheries
manage-ment has contributed significantly to these declines while environmanage-mental
degra-dation threatens the continued fi.l/1ct ioning of this ecosystem. The Ecopath \Vith
Ecosim programme has been used to characterise the clm'ent trophic state of
the ecosystem and explore ecological/y sustainable management.
Keywords
Ecopath -
Trophic status - Sine-Saloum -
Fisheries Management
RÉSUMÉ
L
E DELTAdu Sine-Saloum (Sénégal) présente un gradient de salinité inversé
avec hyper-salinité
à l'amont. Il offre une importante ressource piscicole
aux populations locales. En vingt ans, les captures totales sont passées de trente
mille
à quinze mille tonnes et la diversité des captures a également baissé.
Eth-malosafimbriata,
un Clupéidé pélagique, est devenu progressivement dominant.
Des pratiques et un aménagement des pêches inadaptés ont amené ces déclins,
également dus en partie à la dégradation de l'environnement qui fait courir à
l'écosystème des risques écologiques réels. Le logiciel Ecopath avec Ecosim a
été employé ici pour analyser les relations trophiques au sein de cet écosystème
et pour explorer les possibilités d'un aménagement écologiquement durable de
la ressource.
Mots clés
Sénégal -
Sîné-Saloum -
Structure trophique -
Ecopath
Aménagement
·'An Ecopalh Mode/ oflhe Sine-Sa/ol/111 De/la Biosphere Reserve (Senega/)·'
«Modèle Ecopath pour une réserve de la biosphère: le della du Siné Saloum (Sénégal)»
INTRODUCTION
407
W
EST Ati-ican estuaries, characterised by a high species diversity, are highly produc-tive (ALBARET & DIOUF, 1994). Sine-Saloum (fig. 1) is located about 100 km south of Dakar (Senegal) and covers an area of 543 km2• It is one
of the country's most populated regions, with 10
per cent of th is area inhabited by around 16 per cent of the country's total population man y de-pendent on the natural resources of the area. The inverse hyper salinity of the Sine-Saloum is an important factor affecting its biodiversity.
FIG. 1. - Map showing location of the studied area and the zone considered
as Biosphere reserve of the Delta of Sine-Saloum. (Sources: http://www.au-senegal.com_and Encarta). Localisalion du della du Siné-Saloum. au sud de Dakar el du parc nalional du Della
(réserve de la biosphère).
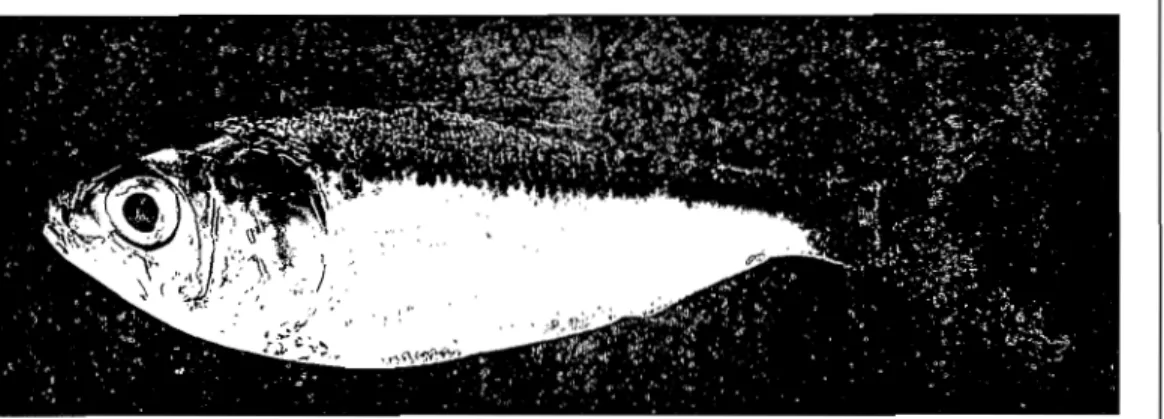
FIG.2. - Ethmalosa fimbriala, a pelagic Clupeid, is the principle resource exploited in the Sine-Saloum estuary (photo by Guy Vidy).
Ethmalosa timbriata : Clupéidé pélagique el principale ressource exploilée au Siné-Saloum.
408 VILLANUEVA (M.C.),L.TITO-DE-MORAIS,L-Y.WEIGEL&1.MOREAU
This, notably, has alTected the ecosystem and the catches of the fisheries (DIOUF el al., 1998;
Bousso, 1996; DIOUF, 1996). Ellimalosa jimbriala (fig. 2) now represents 80 per cent of the actual catch in 2000 (DEME el a!., 2000; 2001). Post-colonial fishing practices contributed significantly to the decl ine of catches both in numbers and
di-versity due to overexploitation, mostly by immi-grating fishers (DIOUFelal., 1998).
The aim of this contribution is to construct a pre-liminary food wcb model for the Sine-Saloum eco-system, to describe its complex trophic structure and dynamics, and how their variations can affect the tisheries.
MATERIALS
&
METHOOSE
COPATH with Ecosim (EwE), dcscribed by CHRISTENSEN elal. (2000), and several con-tributors in this volume, was used to identify the trophic relationships and community structure in the Sine-Saloum estuary. Groups were mainly based on data by ALBARET and DIOUF (1994). Existing data l'rom field samples and various pub-lications (UNESCO, 1982; 1985; Bousso, 1991; ALBARET & DIOUF, 1994; Bousso, 1994; DIOUF, 1996; DIOUF el a!., 1999; DEMEel a!., 2001) on this ecosystem were utilised in order to build the mode!. A total of 38 groups were created (table 1), based on species abundance and the structu rc ofthc trophic system (ALBARET & DIOUF, 1994; Bousso, 1996; DIOUF, 1996). Quantitative diet composition were not available, and thus qualita-tive information was used taken mainly from DIOUF (1996), Fishbase (FROESE & PAULY, 2000) and colleagues' personal communications. This preliminary Ecopath model was designed to inves-tigate possible consequences to ecosystem health of further changcs in fishing patterns and intensi-ties.
The data base used here, as weil as the sources of any inputs, is avai lable upon request from the first author (see also www.ecopath.org).
RESULTS
&
DISCUSSIONT
HE system's primary production/respiration ratio of 1.084 indicates that it is rich in or-ganic materials from demineralisation and other active microbial processes (DIOUF, 1996).The estimated biomass for each group (table 1) seem to be reasonable but it should be emphasised that further studies are needed to improve Ihe mode!. Estimated total annual biomass of tish groups considered is 37.7 l.km·' (table 1).
The low system omnivory index of 0.146, with a conneclanee index of 0.184, is due to feeding spe-eial isation by various fish groups. The tish assem-blages are dominated by groups preying mainly on zooplankton, especially during Ihe juvenile stages. Generally, estuarine food webs are driven by phy-toplankton or detrilal production (BLABER, 2000).
For Sine-Saloum, the latter seems ta be the case, due 10 Ihe low primary production. The low pri-mary productivity can be attributed to water tur-bidity, inefficienl nutrient cycling and environmental degradation leading10reduced
dis-solved oxygen concentrations in the estuary (UNESCO, 1985; BLASER, 2000).
The trophic chain is short and flows mainly from detritus to higher trophic levels. The relatively high transfèr efficiency (16 per cent) associated with these flows can be attributed to the low abun-dance of phytoplanklon and of organisms grazing il.
The transfer efficiencies increase at higher lrophic levels, which is related to the higher quality of the food being transferred.
"An Ecop(ilh Madel of/he Sine-Salollm Del/a Biosphere Reserve (Senegal) "
409
«Modèle Eeopath pour une réserve de la biosphère: le delta du Siné Saloum (Sénégal)»TABLE 1
Basic inpu/ and es/illla/ed parame/ers of the Ecopath model for Sine-Salollm. TL is the /rophic level. Habita/ area/or each group is /heji-ac/ion of/he /otal area where biomass ofspecies are concen/ra/ed.
Biomass A pertains/0biomass in /his habita/ area and B/0biomass in /otal area. PIB is the produc/ionlbiomass ratio, QIB the consllmp/ionlbiomass ratio
Basic estimates calculated bv the mode! are indica/ed in italics
Structure trophique du delta du Sine-Saloum telle qu'analysée par Ecopath : TL est le niveau trophique;
«Habitat area»désigne la fraction de la surface totale où le groupe considéré est concentré, la biomasse A est celle pour cet habitat et B celle comme une moyenne pour tout l'écosystème.
P/B est le rappon Production/Biomasse, et Q/B est le rappon consommation/biomasse. Seules les valeurs en italiques ont été calculées par le logiciel
TL HABITAT BIOMASS A BIOMASS B P/B Q/B EE GE GROUP NAME
AREA (T. Ktvr') (T.KM·') (yi) (yi)
Scomberomorus IrilOr 3.4 0.50 0.009 0.004 2.520 12.60 0.950 0.200 2 Elaps spp. 3.3 0.50 OJJ21 0.010 1.990 9.95 0.950 0.200 3 Spftyraena spp. 3.3 0.25 8.688 2.172 1.700 8.50 0.176 0200 4 Arills spp. 3.2 0.50 2.544 1.272 2.655 17.70 0.312 0.150 5 Polvdac/yllis qlladrifilis 3.5 1.00 1.272 1.272 1.540
no
0.079 0.200 6 Pselld%lilhlls elongallis 3.3 1.00 1.800 1.800 1.680 840 0.026 0.200 7 Olher Sciaenidae 3.3 1.00 0.089 0.089 J.650 8.25 0.950 0.200 8 PsellodeslCilharichlhys 3.3 0.50 0.166 0.0166 1.980 Il.00 0.950 0329 9 Caleoides decadaClyllis 3.2 0.50 2.150 2.150 1.515 10.10 0.950 0.150 10 Dosl'{lIis spp. 31 0.50 0.075 0.037 1.650 8.25 0.950 0.100Il Brachydelllerus al/rilliS 2.7 0.50 0019 OJJl 0 2.870 28.70 0.950 0.150
12 PleclorhinchllslPomodasvs 3.2 0.75 1.558 1.168 1.270 847 0.950 0.150
13 lIisha ofricano 2.9 0.50 2.444 1222 2445 16.30 0.950 0.150
14 Cynoglosslls spp. 3.1 0.50 9.224 4.612 1 .200 8.00 0.950 0180
15 ChloroscombrllslHemicaranx 33 0.25 0.066 0.016 3.3 12 1740 0.935 0150
16 Carongidae (ben tho-pelagie) 3.3 0.50 0.718 0.359 1.335 8.90 0.950 0.150
17 Cerreidae 2.9 0.50 0.128 OJJ64 3.075 20.50 0.950 0.180 18 OtherCorangidae 3.2 0.50 0.224 0.112 2407 13.3 7 0.440 0.150 19 Ephippidae 3.0 0.75 OJJ13 0.010 2.130 14.20 0.950 0.150 20 Elhmolosafimbriolo 2.7 0.75 23.543 17.657 2.685 17.90 0.543 0100 21 Sordillello moderensis 2.8 0.50 0.203 0.102 3.390 33.90 0.950 0.050 22 Mligilidae 2.4 0.50 2.750 1.3 75 1.386 27.72 0692 0.051 23 Sorolheradon melonOlheron 2.3 0.60 2.100 1.260 1.275 25.20 0.856 0050 24 Tilopio gl/ineensis 2.3 0.50 1.800 0.900 1.030 20.60 0.613 0.250 25 Pelagie Shrimps 2.3 0.75 4.674 3.505 4.500 18.00 0.950 0.250 26 Litloral shrimps 2.3 0.25 26.853 6.713 4.500 18.00 0.950 0312 27 Pelagie erabs 2.7 0.75 7.409 5.557 2.500 8.00 0.950 0.312 28 Littoral erabs 2.1 0.25 3.576 0.894 2.500 8.00 0.950 0.312 29 Cephalopods 3.0 0.50 29.892 14.946 2.500 8.00 0.950 0.333
30 Bivalves and Gastropods 2.0 0.50 21320 10.600 3.000 9.00 0.950 0.320
31 Annelids and Polyehaets 2.0 0.25 26.530 6.633 8.000 25.00 0.950 0.314
32 Zoobenthos 2.1 0.25 32.853 8.213 22.000 70.00 0.950 0.333 33 Pelagie zooplanklOn 2.1 0.50 7.221 3.611 50.000 150.00 0.950 0.333 34 Littoral zooplankton 2.1 0.50 4.104 2.052 50.000 150.00 0.950 0.333 35 Benth ie algae 1.0 0.25 50.000 12.500 36.798 0.950 36 Pelagie phytoplanklOn 1.0 0.50 6.810 3.405200.000 0.950 37 Litloral phytoplankton 1.0 0.50 1.968 0.984365.000 0.950 38 Detritus /.0 1.000 1.000 0.863
TABLEIl
Estimated catch (t.km-2)pel' group/in each geaI'. Total annual catch estimated was32.34(t.km-2),operating at atrophie level0(2.63
Captures annuelles (l.km-2) estimées par groupe pour chaque engin. Le total est estiméà32,34t.km-2 Le niveau trophique moyen des captures est de2.63
GROUP\ CATCH DUGOUT BI:ACH SEINE ENCIRCUNG CAST NETS FIXED GILL DERIVED TRAWL SIIRIMP TRAI'S OTHER TOTAL
GILLNETS NETS GILL NETS UNES NETS GEARS CATCH
1 Scomberolllorolls tritor 0.005 0.005 0.01 2 Elopsspp. 0.010 0.01 3 SphyroelJaspp. 0.200 0.100 0.070 0.260 0.63 4 Ariusspp. 0.1la 0.120 0.010 0.140 0.140 0.040 0.56 5 Polydac/ylus qlladrijilis 0.060 0.015 0.010 0.050 0.005 0.14 6 Pseud%li/hlls elolJga/lIs 0.010 0.010 0.050 0.07 7 OtherSciaelJidaespp. 0.030 0.025 0.070 0.005 0.13 8 Psel/odes/Ci/haric:h/hys 0.010 0.01 9 Ga/eoides decadac/yllls 0.009 0.001 0.01 la Dm)'a/isspp. 0.010 0.01 Il Brachydell/erlls auri/liS 0.010 0.01 12 Plec/orhinelllls/Pomada,)'s 0.005 0.003 0.002 0.01
13 Ilisho ofi'iC:OlJa O.OIIJ 0.01
14 (l'noglos.l·usspp. 0,005 0.003 0.001 0.001 0.01 15 Clllomscombl'1ls//-Iemic:aranxspp. 0.020 0.02 16 CaralJgidae (ben/ho-pelagic) 0.010 0.060 0.07 17 Gerreidaespp. 0.010 0.01 18 OtherCaralJgidaespp. 0.015 0.005 0.02 19 Ephippidaespp. 0.010 0.01 20 Ethmalosafimbria/a 0.560 22.250 0.015 0.300 0.050 0.005 0.010 23.19 21 SardilJella maderelJsis 0.006 0.002 0.002 0.01 22 Mugilidaespp. 0.375 0.010 0.150 0.040 0.005 0.010 0.59 23 Saro/herodon lIIelanotherolJ 0.180 0.030 0.030 0.010 0.090 0.34 24 Tilapia guilJeensis 0,070 0.020 0.030 0.005 0.005 0.010 0.14 25 Pelagie Shrimps 1.050 \.05 26 Lilloral shrimps 0.350 0.35 27 Pelagie erabs 0.010 0.01 28 Littoral erabs 0.100 0.10 29 Cepha lopods 0.010 0.01
30 Bivalves and Gaslropods 4.800 4.80
31 TOTAL CATCH 0.110 1.651 22.427 0.222 0.630 0.740 0.040 1.439 5.021 0.060 32.340
"An Ecopalh Model oflhe Sine-Sa/oum De/ta Biosphere Reserve (Senega/) "
«Modèle Eeopath pour une réserve de la biosphère: le delta du Siné Saloum (Sénégal)»
411
Various fishing gears, though mostly non-specilic, are uscd to exploit faunal resources in the estuary, Sphyrael1a spp., Arills spp.. Ethmalosa jimbri(({a, Sardil1ella maderel1sis. Sarotherodol1 melal1otherol1, shrimps and crabs (table II). As a whole, the fish-ery is operating at a trophic level of about 2.63. Total annual catch is 32.34 t.km" (17,560 t) which
is slightly higher than what has been observed (15,370 t) by DEMEet al. (2001). This may be due to unreported capturcs of less economically impor-tant animais or discards of non-marketable species not included in annual catches, as weil as unre-corded cxport of substantial amounts to neighbour-ing countries su ch as Gambia.
TABLE"1
Evollltiol1 of biomass of a[fected grollps lvhenfishing ef/àrt is il1creased by a factor of1lI'0,
ail gears combined
Évolution de la biomasse des groupes dont l'abondance est affectée par un doublement généralisé (sur 10 ans) de l'activité de pêche, tous engins confondus
GROUP Nt\ME Scomberomorous Irilor E/opsspp. Sphyrael1aspp. Ariusspp. Po/vdacly/us q/ladrijilis Pseudololi/hus e/ongallls OtherSciaenidae Psellodes/Cilarichl!J.vs Ga/eoides decadaclylus Dasyalisspp. Brachydelllerus aurilllS Pleclorhinchus/Pomadasys llisha afi'icana Cvnog/ossusspp. Ch/oroscombrus/Hemical'(Jnx Caral1gidae(ben tho-pelagie) Gerreidae OlherCalYlngidae Ephippidae Elhma/osa jimbriata Sardillella maderensis Mugi/idae Sarolherodon melanolheron Ti/apia guineel1sis Pelagie shrimps Liuoral shrimps Pelagie erabs Littoral erabs Cephalopods
Bivalves and Gastropods
Biomass (Start) 0.004 0.010 2.150 1.256 1.268 1.797 0.085 0.083 1.076 0.037 0.009 1.167 1.222 4.614 0.016 0.357 0.064 0.112 0.010 17.021 0.\02 1.356 1249 0.896 3.48 , 6.710 5.593 0.892 15.047 10.528 Biomass (End) 0.000 0.002 1.683 1.13 1 1.341 1.681 0.001 0.102 1584 0.022 0.02! 1.010 1.356 4.973 0.012 0.531 0.067 0.148 0.011 10.685 0.150 0.740 1.062 0.809 3.511 6984 Il.210 0.909 23.919 8.532 13iomass (SIE) 0.00 0.22 0.78 0.90 106 0.94 0.01 1.23 1.47 0.60 2.22 0.87 1.1 1 1.08 0.73 1.49 1.05 1.33 1.12 0.63 1.48 0.55 0.85 0.90 1.01 1.04 2.00 1.02 1.59 0.81 Catch (Start) 0.011 0.011 0.714 0.633 0.160 0.080 0.142 0.011 0.011 (J.OI! (l.O Il 0.011 O.(JII 0.011 0.022 (J.(J80 (J.OII (J.(J23 0.011 25.58(J 0.0\1 0.666 0.386 0.160 1.194 0.401 0.012 0.114 0.012 5.427 Catch (End) 0.000 0.004 0.916 0.934 0.277 0.123 0.002 0.023 0.028 0.011 0.041 0.016 0.021 0.020 0.026 0.194 0.020 0.050 0.020 26.314 0028 0.595 0.537 0.236 1.972 0.683 Om8 0.191 0.030 7.205 Catch (SIE) 0.00 0.36 1.28 1.47 1.73 1.53 0.02 2.01 2.41 0.99 3.63 1.42 1.82 1.76 1.19 2.24 1.72 2.17 1.84 1.03 2.42 0.89 1.39 1.48 1.65 1.70 328 1.67 2.60 1.33 Value (Start) 0.006 0.002 0.750 0.253 0.271 0.015 0.027 0.002 0.002 0.002 0.002 0.002 0.002 0.002 0.004 0.015 0.002 2.068 0.002 2.068 0.002 0.173 0.145 0.060 1.492 0.501 0.002 0.022 0.002 1.03 , Value (End) 0.000 0.001 0.961 0.373 0.470 0.023 0.000 0.004 0.005 0.002 O.OOS 0.003 0.004 0.004 0.005 0.037 0.004 0.009 0.004 2.127 0.005 0.155 0.202 0.089 2.465 0.854 0.007 0.036 0.006 1.369 Value (SIE) 0.00 0.36 1.28 1.47 1.73 1.53 0.02 2.01 2.41 0.99 3.63 1.42 1.82 1.76 1.19 2.44 1.72 2.17 1.84 1.03 2.42 0.89 1.39 1.48 1.65 1.70 3.28 1.67 2.60 133
ln most simulation runs \Vith Ecosim, increascd fishing pressure using cast nets cause a marked dc-cline of the MIIgilidae. Increasing fishing activity using any gill or shrimp nets showed negative ef-fects to the biomass ofSciaenidae exccpt for P elollgatlls(table Ill). Increasing fishing pressure by a factor of 2 led to a dramatic decrease in the bio-mass ofPseudotolithllsspp., Elops spp. andS.
tri-tor. Olher groups such as Sphvraena spp., Arius spp., Dasvatis spp., Chloroscombrus and Hell7ica-rallx spp.E. jill/brio/a, as weil as the bivalve and gastropod group showed progressive decrease in thcir biomass. The biomasses of Brac17vdeuterlls ol/ritlls, Galeoides decadoctyllls, Sardillella lI1od-erensis, Psettodes and Citharvclllhys spp., Ili.l'ha olricallaas wcll as the cephalopods increased due
412 VILLANUEVA (M.C.),L.TITO-DE-MORAIS, J.-Y. WEIGEL&J. MOREAU
tadecrease of predation pressure and inter-specifie competition among these groups.
Fish groups specialised in consuming molluscs, shrimp and other invertebrates showed negative responses in biomass only when the effort of gears capturing their preferred preys was increased. Various scenarios were simulated using the fishing policy routine of Ecosim. Criteria considered were
based on requirements outlined by DIOUF el al.
(1998) regarding sustainable management strate-gies in agreement with the current tisheries legisla-tion. The policy search routine, when set to favour ecosystem structure and net economic value sug-gestcd that tishing with gill nets heavily exploiting clupeid spccies, as weil as targeting of shrimps and molluscs would lead to the best compromise.
CONCLUSION
T
HEtrophic structure in the Sine-Saloum estuaryis changing mainly from decline of l'ish stocks due to intensification of fishing activity and envi-ronmental degradation. Depletion of some groups due to increased catch and predation rates may al-low consequential increasc of biomass among other groups but will eventually lead to threats to ecosys-tem stability and resources sustainability.
Future management policies should consider re-source conservation as such system serve as nursery
grounds for many commercially exploited
re-sources.
It should be noted that this is only a preliminary
study, and that fùrther investigations will bc con-ducted in the near rùture. However comments will be grcatly appreciated.
"An Ecopath Mode/ of/he Sine-Sa/Olllll De//a Biosphere Reserve (Senega/) "
«Modèle Ecopath pour une réserve de la hiosphère : le delta du Siné Saloum (Sénégal)»
ACKNOWLEDGEMENTS
413
T
HE authors wish to thank Jean-Jacques ALBARET, Jean-Marc ECOUTIN and Guy VIDY (ail with IRD, Dakar, Senegal), especially for sci-entific comments and suggestions and the rest of the staff involved in the project Rap (Réponsesadaptives des poissons), spearheaded by Raymond LAi:. We also thank Moustapha DEME (Researcher-CRODT), Omar SARR and Papa Samba DIOUF (Head-WWF, Senegal) for supplementary informa-tion.
BIBLIOGRAPHY OF SOURCES CITED
ALBARET (J. J.) & P. S. DIOUF,
1994.-«Diversité des poissons des lagunes et des estuaires Ouest-A l'ricains », in TEUGELS et al. (éd., 1994): pp. 165-177.
BLABER (S.), 2000. - Tropica/ ESlllarine Fishes : Ec%gy, Exp/oitation and Conservation, London, Blackwell Science, 372 p. Bousso (T.), 1991. - Exp/oitation des Stocks
dans «L'estuaire)) et les B%ngs du Sine-Sa/oum Evo/Ulion depuis 20 ans, document scientifique, C.R.O.D.T.-Isra, Sénégal,29p.
Bousso (T.), 1994. - Ressource halieutique et système d'exploitation dans l 'esilia ire du Sine-Saloum (Sénégal), rapport scienti-fique chercheur associé, Isra-C.R.O.D.T., Sénégal, 24 p.
Bousso (T.), J996. - La pêche artisanale dans l'estuaire du Sine-Saloum (Sénégal): Ap-proches typologiques des systèmes d'exploitation, th. doc!., univers. Montpel-lier-li (France),293p.
CHRISTENSEN (V.), C. J. WALTERS & D. PAULY,. 2000. - Ecopath with Ecosim: A User'.1'
Cu ide, Fisheries Centre, University of British Columbia, Vancouver, Canada and ICLARM, Penang Malaysia, 130 p. (see also: www.ecopath.org)
DEME (M.), H. M. DIAOHIOU & D. THIAM, 2001. - Effort de pêche, captures spéci-fiques et valeurs économiques des débar-quements de la pêche continentale dans le neuve Sénégal et au Sine Saloum, rapport scientifique, Isra-C.R.O.D.T.-U.I.C.N. (Un-ion mondiale pour la conservat(Un-ion de la na-ture), Sénégal, 42 p.
DEME (M.), H. M. DIAOHIOU & D. THIAM, 2000. - Recensement des unités de pêche dans les zones géographiques du fleuve Sénégal et du complexe deltaïque du Sine Saloum en 1999, rapport scientifique, Isra-C.R.O.D.T.-U.I.C.N., Sénégal, 131 p. DIOUF (P. S.), 1996. - Les peuplements de
pois-sons des milieux estuariens de l 'AFique de l'Ouest: l'exemple de l'estuaire hyper-halin du Sine Saloum, th. doc!., univers. Montpellier, 267 p.
DIOUF (P. S.), D. THIAM, C. SENE, A. DIA, M. LY, N. NOIAYE, F. NGOM, K. SANE & M. FA YE, 1999. - Combining Traditional and Modern Practices in Fisheries: Sine Saloum, Senegal. Contribution During the Wise Coastal Practices jor Sustaùwble Human Development Forum, July 1999. (available online at:
http://www .csiwisepracti ces.org).
DIOUF (P. S.), M. D. BARRY & S. COL Y,
1998.-La réserve de la biosphère du delta du
414 VILLANUEVA (M.C.),L.TITO-DE-MORAIS, J.-Y. WEIGEL&1.MOREAU
loum: L'environnement aquatique. Les ressources haliel/tiques et leur e.\ploita-tian, Union mondiale pour la conservation de la nature (U.I.C.N.), 107 p.
FROESE (R.) & D. PAULY (ed.), 2000. - Fishbase 2000: Concepts. Design and Data Sources, Los Banos, Philippines, ICLARM, 344 p. TEUGELS et al. (ed.), 1994. - "Biological
Diver-sity in African Fresh- and Brackish, Water
Fishes", Ann. Mus. R. Afr. Centr.. Zool., 275.
UNESCO, 1982. - Atelier d'étude des mangroves et de l'estuaire du Saloul11, Sénégal, rap-port final. Unesco, Sénégal, 175 p. UNESCO, 1985. - L'estuaire et la mangrove du
Sine Saloum: Résultats d'un Atelier ré-gional Unesco-Comar tenu àDakar, Séné-gal, Unesco, SénéSéné-gal, 139 p.
La recherche européenne vous intéresse?
Notre magazine ROTinfo vous tient au courant des principaux développements dans ce domaine
(résultats, programmes, événements, etc.).
ROT info est disponible gratuitement en allemand, en anglais et en français, sur simple demandeà: Commission européenne
Direction générale de la recherche Unité «Information et communication» B-1049 Bruxelles
Fax (32-2) 29-58220 E-mail: research@cec.eu.int
Internet: http://europa.eu.int/comm/research/rtdinfo/index_fr. html
Lecture-correction et révision des textes:
Textes en français: Charles H. A. Masson, assisté de Ousmane Camara & de Habib Gassama Textes en anglais: Alain Damiano, Venceslas Goudiaby & Amy Karafin
Secrétariat des actes: Oumy Ba Réalisation éditoriale: mise en pages:
Charles Masson Édition B.P. 23751 Dakar-Ponty Dakar (Sénégal)
Téléphone: (221) 835 59 89 - 87911 55 - 87911 51 Télécopie: (221) 87911 52
Adresse électronique: cha.edition@sentoo.sn
Photos en couverture: Pêcheurs de poulpe sur une pirogue©IRD
Boops boops©Robert Patzner
IRD
IRD - Institut de recherche pour le développement 213, rue La Fayette
F - 75480 Paris Cedex 10 Téléphone: (33-1) 48 03 77 77 Fax: (33-1) 48 03 08 29 Site web: http://www.ird.fr/
COMMISSION EUROPEENNE
Direction Générale de la Recherche
Direction N - Coopération scientifique internationale Unité 2 - Activités communautaires de coopération B-1049 Bruxelles
Fax: (32-2) 29-66252 E-mail: inco@cec.eu.int
Europe Direct est un service destiné
à
vous aider
à
trouver des réponses
aux questions que vous vous posez sur J'Union européenne.
Un numéro unique gratuit (*):
00 800 6 7 8 9 10 11
(*)Certains opérateurs de téléphonie mobile ne permettent pas l'accès aux numéros 00 800 ou peuvent facturer ces appels.
De nombreuses autres informations sur l'Union européenne sont disponibles sur l'internet via le serveur Europa (http://europa.eu.int).
Une fiche bibliographique figure
à
la fin de l'ouvrage.Luxembourg: Office des publications officielles des Communautés européennes, 2005 ISBN92-894-7480-7
©Communautés européennes, 2005
Reproduction autorisée, moyennant mention de la source
Printed in Belgium
PÊCHERIES MARITIMES, ÉCOSYSTÈMES
&
SOCIÉTÉS EN AFRIQUE DE L'OUEST:
Un demi-siècle de changement
Actes du symposium international
Dakar -
Sénégal -
24-28 juin 2002
Pierre CHAVANCE, Moctar
8Â,
Didier GASCUEL,
Jan Michael VAKILY
&
Daniel PAULY
Éditeurs scientifiques