Thermoelectric properties of n-type Ca
1-xDy
xMn
1-yNb
yO
3-δcompounds (x =
0, 0.02, 0.1 and y = 0, 0.02) prepared by spray-drying method
H. Muguerraa, B. Rivas-Muriasa, M. Traianidisb, C. Marchalc, Ph. Vanderbemdenc, B. Vertruyena, C. Henrista, R. Clootsa
a Laboratory of Structural Inorganic Chemistry and the Group of Research in Energy and Environment from Materials (LCIS-GreenMat),
Dept. of Chemistry, University of Liège, 4000 Liège, Belgium
b
Belgian Ceramic Research Centre, 7000 Mons, Belgium
c Montefiore Institute, Dept. of Electrical Engineering and Computer Science, 4000 Liège, Belgium
ABSTRACT
We report the high temperature thermoelectric properties of Ca1-xDyxMn1-yNbyO3-δ (x = 0, 0.02, 0.1 and y = 0, 0.02 ) synthesized by spray-drying method. A maximum power factor (PF) value of 2.65 µW K-2 cm-1 is obtained at 1100 K for CaMn0.98Nb0.02O3-δ. This represents an improvement of about 75% with respect to undoped CaMnO3-δ sample at the same temperature. We also provide a complete structural characterization of the samples.
Keywords : Oxide ; Manganate ; Spray-drying ; Thermoelectric properties
1. Introduction
One of the most important challenges for today's society is to develop green and renewable energy sources to maintain our living standards at a reduced environmental cost. Efficient thermoelectric (TE) energy harvesting could be an important step forward in this direction, recycling part of the heat waste in some form of usable energy. The efficiency of TE materials is determined by the figure of merit ZT = S2T/ρκ, where S, T, ρ and κare the Seebeck coefficient, the temperature, the electrical resistivity and the thermal conductivity, respectively. The product S2σ (where σ is the electrical conductivity) is called power factor.
In the last decades, several TE alloys have been identified as promising candidates for efficient commercial devices (competitive thermoelectric devices ZT ≥ 1) [1,2]. Nevertheless, their manufacture is still limited by their low chemical stability in air particularly at high temperature. Consequently, an ideal TE material must show a large ZT value, be composed of nontoxic and available elements and have high chemical stability in air even at temperatures of 800-1000 K.
Compared with TE alloys, metal oxides are more suitable for high temperature applications due to their structural and chemical stability, oxidation resistance, ease of manufacture, and low cost. Different cobalt oxides have been identified as good p-type or potential n-type candidates, such as NaCo2O4 [3], Ca3Co4O9 [4], etc. However, the TE efficiency of n-type oxides is still low compared with p-type. Consequently, further investigations are needed to improve the TE properties of n-type materials.
CaMnO3-δ (hereafter labeled CMO) has been studied intensively due to its rich physical properties such as colossal magnetore-sistance, charge and orbital ordering, magnetic properties [5,6]. Recently, the TE properties of electron-doped CMO have also attracted much attention [7-11]. These properties can be tuned by changing the nature and concentration of trivalent rare-earth or divalent alkaline-earth cations. These dopants induce a structural distortion and affect the concentration of eg electrons at Mn sites [12].
Niobium and dysprosium are interesting candidates to replace calcium and manganese cations. Firstly, the ionic radii of Nb5+ and Dy3+ cations are close to those of Mn4+ and Ca2+ (r[Mn4+] = 0.53 Å, r[Nb5+] = 0.64 Å and r[Ca2+] = 1.18 Å, r[Dy3+] = 1.08 Å [13]).Secondly, doping with higher valences states elements results in n-type doping which enhances the thermoelectric properties of n-type materials [7-11]. Moreover, different studies reported that 10% of Dy [6,7] or 2% of Nb [9] can improve the TE properties of CMO.
In the present work, we report the synthesis of Ca1-xDyxMn1-yNbyO3-δ (x = 0, 0.02, 0.1 and y = 0, 0.02) by spray-drying method [14]. This "chimie douce" method presents different advantages compared to the classic solid state method. The precursors are previously dissolved in water and this step allows a more homogeneous dispersion of the dopants into the material. The spray-dried powders are more reactive, which reduces the sintering temperature compared to solid state method (1573 K for CMO [8,9]). Finally, powders with a narrow particle distribution can be obtained. In fact, Motohashi et al. [15] reported that modifying the microstructure by spray-drying synthesis of [(Bi,Pb)2Ba2O4±w]0.5CoO2 cobaltite can greatly enhance its electrical conductivity. As we will discuss, there is a great influence of the microstructure on the TE properties.
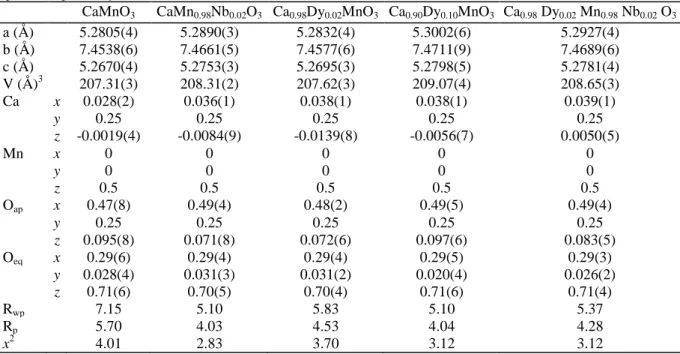
Table 1 Structural parameters and atomic positions for CMO and CMO-doped; eq and ap mean equatorial and
apical, respectively.
CaMnO3 CaMn0.98Nb0.02O3 Ca0.98Dy0.02MnO3 Ca0.90Dy0.10MnO3 Ca0.98 Dy0.02 Mn0.98 Nb0.02 O3
a (Å) 5.2805(4) 5.2890(3) 5.2832(4) 5.3002(6) 5.2927(4) b (Å) 7.4538(6) 7.4661(5) 7.4577(6) 7.4711(9) 7.4689(6) c (Å) 5.2670(4) 5.2753(3) 5.2695(3) 5.2798(5) 5.2781(4) V (Å)3 207.31(3) 208.31(2) 207.62(3) 209.07(4) 208.65(3) Ca x 0.028(2) 0.036(1) 0.038(1) 0.038(1) 0.039(1) y 0.25 0.25 0.25 0.25 0.25 z -0.0019(4) -0.0084(9) -0.0139(8) -0.0056(7) 0.0050(5) Mn x 0 0 0 0 0 y 0 0 0 0 0 z 0.5 0.5 0.5 0.5 0.5 Oap x 0.47(8) 0.49(4) 0.48(2) 0.49(5) 0.49(4) y 0.25 0.25 0.25 0.25 0.25 z 0.095(8) 0.071(8) 0.072(6) 0.097(6) 0.083(5) Oeq x 0.29(6) 0.29(4) 0.29(4) 0.29(5) 0.29(3) y 0.028(4) 0.031(3) 0.031(2) 0.020(4) 0.026(2) z 0.71(6) 0.70(5) 0.70(4) 0.71(6) 0.71(4) Rwp 7.15 5.10 5.83 5.10 5.37 Rp 5.70 4.03 4.53 4.04 4.28 x2 4.01 2.83 3.70 3.12 3.12
Table 2 Tolerance factor (t), bond distances (Å), angles (°), and Mn valence (theo = theoretical) for CMO and
CMO-doped; eq and ap mean equatorial and apical, respectively.
t Mn-Oap Mn-Oeq Mn-Oap-Mn Mn-Oeq-Mn V(Mn)/Vtheo(M)
CaMnO3 1.004 1.936(11) 1.89(4) 148.6(5) 158.3(16) 3.97/4 1.91(4) CaMn0.98Nb0.02O3 1.002 1.918(7) 1.90(2) 153.4(3) 157.3(9) 3.96/3.98 1.91(2) Ca0.98Dy0.02MnO3 1.001 1.906(7) 1.90(3) 156.1(3) 155.4(11) 3.97/3.98 1.92(3) Ca0.90Dy0.10MnO3 0.989 1.937(8) 1.90(3) 149.3(4) 157.9(13) 3.88/3.9 1.91(3) Ca0.98 Dy0.02 Mn0.98 Nb0.02 O3 0.999 1.906(8) 1.90(3) 156.9(4) 155.5(11) 3.92/3.96 1.92(3) 2. Experimental procedures
Ca1-xDyxMn1-yNbyO3-δ with x = 0, 0.02, 0.1 and y = 0, 0.02, hereafter labeled Nb2 (Ca1Mn0.98Nb0.02O3-δ), Dy2 (Ca0.98Dy0.02MnO3-δ), Dy10 (Ca0.90Dy0.10MnO3-δ) and Dy2Nb2 (Ca0.98Dy0.02Mn0.98Nb0.02O3-δ), were prepared by spray-drying method. Stoichiometric amounts of CaCO3, Mn(CH3CO2)2 4H2O, Dy(CH3CO2)3 4H2O were dissolved in aqueous acetic acid solution at 373 K and NbCl5 in absolute ethanol at room temperature. Citric acid
was used as chelating agent and was added with a citric acid/metal cation molar ratio of 2:1. The different solutions are mixed together and stirred. The final cation concentration in the feedstock solution was ~0.12 mol/L (pH ~5, suitable to avoid damaging the metallic parts ofthe spray-drying apparatus).
The solution was sprayed by a co-current Büchi Mini Spray Dryer B191, using a 0.7 mm nozzle. The inlet and outlet temperatures were 473 K and 418-423 K, respectively. Air was used as the carrier gas with a flow rate of 700 NL/h. The liquid feed rate was 1.4 mL/min.
Afterspray-drying, the precursor was calcined at 873 K for 2 h. Then the powders were ground, pressed uniaxially into pellets and sintered at 1173 K for 10 h. Finally, the products were reground and pressed again, followed by sintering at 1273 K for 10 h.
The X-ray powder diffraction measurements were carried out using a Siemens D5000 diffractometer equipped with a Cu Kα source at room temperature in air. The diffraction intensities were measured in the 2θ range from 15° to 80° with a step width of 0.020°.
Environmental scanning electron microscope (FEG-ESEM, Philips XL30) was used to determine the morphology of the particles.
The average valence of manganese, V(Mn), was determined by titration. Each sample (50 mg) was dissolved in 4 mol/L HCl solution (100 mL) and subsequently reduced by an excess of C2O42- (C2H2O4∙2H2O, 100mg). The unreacted C2O4
was titrated with KMnO4 solution (0.02 mol/L). Several experiments (three) confirmed reproducibility ofthe results.
The density of the samples was measured by Archimedes method in 1-butanol, using theoretical X-ray density values of ~4.3 g/cm3 for CMO.
Samples for physical characterization were cut out as rectangular bars from the sintered pellets using a wire saw. Thermoelectric measurements were carried out using the P670 Thermal Transport Option (TTO) of a Physical Property Measurement System (PPMS Quantum Design). The TTO system was used to measure thermal conductivity, from 20 to 300 K, Seebeck coefficient and electrical resistivity from 100 to 300 K. At high temperature, from 400 to 1100 K, the electrical resistivity and thermoelectric power were measured in air in a commercial RZ2001i device (Ozawa Science).
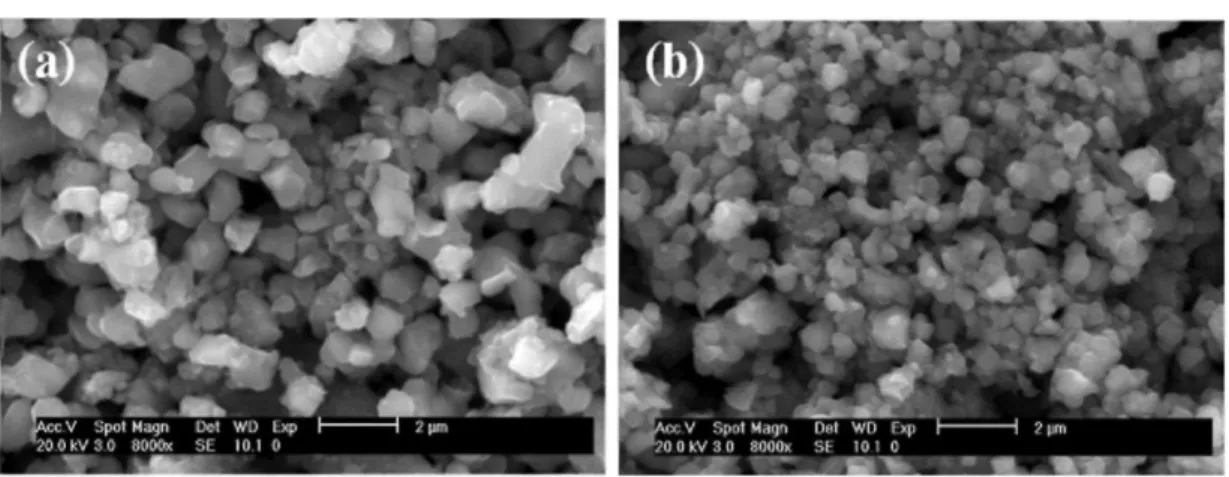
Fig. 2. SEM images of Nb2 obtained (a) without and (b) with citric acid.
3. Results and discussion
3.1. Structural and microstructural characterization
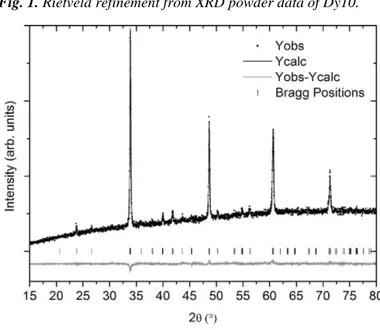
Single-phase compounds are obtained for the Ca1-xDyxMn1-yNbyO3-δ compounds (x = 0, 0.02, 0.1 and y = 0, 0.02) (Fig. 1 ). The solubility limit for Nb is estimated <5%, because impurities are invariably observed for the 5% Nb-doped sample. The different phases are well crystallized at 1273 K, which represents a reduction of 300 K in sintering temperature compared to solid state method [8,9].
The crystal structure of pure CaMnC3-δ was considered as an initial model for the refinement of the parameters of the doped compounds. All reflections are indexed in an orthorhom-bic structure (Pnma space group, n° 62). The lattice parameters ~ 2 aP × 2aP × 2aP correspond to the a+b-b- type tilting (aP ~3.74 Å refers to the lattice parameter for the ideal cubic perovskite structure). The lattice parameters and atomic positions are determined by Rietveld refinement method, using FULLPROF [16]. Agood agreement between the observed and calculated XRD patterns is obtained for the different samples (Fig. 1 and Table 1).
The tolerance factor t = (rA + rO)/ 2(rB+rO)[17] is calculated for the different phases in order to determine the structural distortions of the ABO3 perovskite structure (in our case A = Ca/Dy and B = Mn/Nb) (Table 2). The values of t decrease with increasing doping level below t = 1 (ideal perovskite) which shows an increase of global distortions.
The lattice volumes slightly increase for each doped sample (Table 1). This behavior is independent of the ionic radius of the element (r[Dy3+] < r[Ca2+] but r[Nb5+] > r[Mn4+] [13]). Indeed for CMO phases, the electron doping (elements with higher valences states) induces the presence of Mn3+ within the Mn4+ matrix [18]; and its ionic radius is larger than that of Mn4+ (r[Mn4+] = 0.53 Å and r[Mn3+] = 0.64 Å [13]).
The structure of CaMnC3-δ is formed by distorted MnO6 octahedra (Table 2), with apical Mn-0 distances longer than the equatorial ones, and Mn-O-Mn angles considerably smaller than 180°. These features are characteristic
of Jahn-Teller and orthorhombic distortions, respectively.
In general, Mn-Oapical-Mn angles increase, Mn-Oequatorial-Mn angles decrease, and Mn-O distances do not change significantly. This behavior is not present in Ca0.90Dy0.10MnO3-δ (Dy10), where Mn-Oapical distances and Mn-O-Mn angles remain close to those of CMO and with small t factor. This sample is the highest-doped sample and we could expect that it would present the most distorted structure. Its unexpected structural behavior can be explained taking into account that the structural distortions are not only function of the doping ratio, but also of the Mn4+/Mn3+ ratio: r[Mn3+] > r[Mn4+] but r[Dy3+] < r[Ca2+]. Consequently, the Mn-O distances and Mn-O-Mn angles are less distorted.
The titrations to determine the manganese valence are carried out for the different samples and the results are shown in Table 2. The theoretical manganese valences are determined assuming Ca2+, Dy3+, Nb5+, O2- valences (Nb valence has been obtained previously by XPS analysis by Bocher et al. [9]). The calculated and theoretical values are in agreement; no oxygen vacancies or oxygen intercalations are observed.
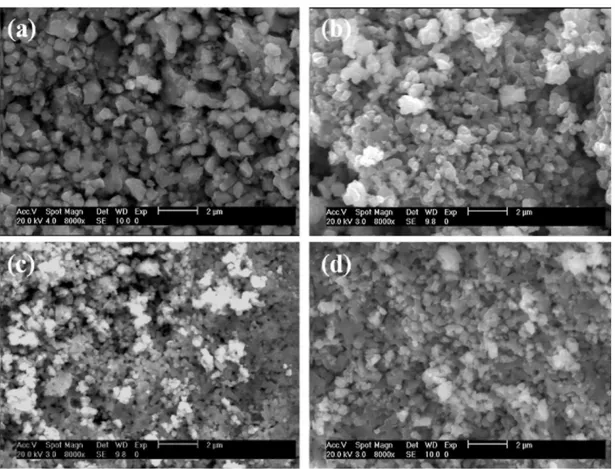
The microstructure of Ca1-xDyxMn1-yNbyO3-δ compounds is investigated by scanning electron microscope (Figs. 2 and 3). All samples show small sintered grains with the same particle morphology. Moreover, a narrow particle size distribution is observed for all compounds. The density of the different phases remains close to 70%. These values are in agreement with those typically reported for manganate oxides [9].
The particle size of the spray-drying samples is smaller than the values observed for bulk samples synthesized by solid state reaction (3-10 µm in diameter [9]). Indeed, in our samples, the largest particles are between 0.5 and 1.25 µm (CMO sample). Moreover, the particle size decreases to 0.25-0.80 µm for the 2% Nb and/or 2% Dy samples, and to 0.15-0.30 µm for Dy10 sample (Fig. 2).
It is interesting to highlight that the particle size of spray-drying Nb samples is even smaller than the one of sol-gel Nb samples (500-900 nm for CaMn1-yNbyO3-δ y = 0.02-0.08 [9]).
The citric acid used as a chelating agent also has a great impact on the final particle size. For example, particles of CaMn0.98Nb0.02O3-δ (Nb2) with citric acid are half-sized than those obtained without citric acid (Fig. 3). So, the spray-drying method allows to obtain a narrow particle size distribution, with the mean particle size roughly controlled by the addition of citric acid during the dissolution of precursors.
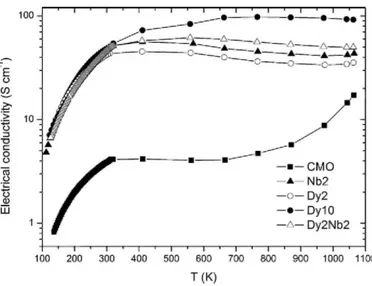
Fig. 4. Temperature dependence of the electrical conductivity (100-1100 K) for the different samples, measured
by PPMS and RZ2001 i devices below and above 400 K, respectively.
3.2. Thermoelectric properties
Fig. 4 shows the temperature dependence of the electrical conductivity (σ) between 100 and 1100 K. Below 400 K, all samples display a semiconducting behavior in agreement with the literature [9,19,20]. Above 330 K, a semimetallic domain is observed for CMO, Dy2, Nb2 and Dy2Nb2 samples. This feature is a consequence of the weak Jahn Teller effect in these samples; thus the distortion of the [MnO3] framework is small which promotes only a weak electron-phonon coupling [21 ]. Bocher et al. [9] have reported the same behavior for CaMn
1-yNbyO3-δ (0.02 < y < 0.08) and Maignan et al. [21] for Ca1-xSmxMnO3 (0 < x < 0.12).
The electronic transport in semiconducting manganites is generally well described by the adiabatic small polaron hopping mechanism [19-24], according to the equation [25]:
where kBis the Boltzmann constant and Ea is the activation energy.
The conductivity of our samples fits nicely to this model in the range 200-320 K (Fig. 5). The Ea is around 55 meV for CMO, Nb2 and Dy2, and 64 meV for Dy10 and Dy2Nb2. These values are in agreement with those reported in the literature [5,8].
CMO sample displays the lowest electrical conductivity. Doping at A or/and B site (A = Ca/Dy and B = Mn/Nb) modifies the number of charge carriers and activates the conduction processes.
Dy10 sample shows the maximum value of electrical conductivity (σ(1100 K) ~98 S cm-1 ). This σ value is smaller than the one reported in Ref. [7] by solid state method (σ ~ 140 S cm-1 at 1100 K). The difference between these two samples is mainly the particle size, since their density remains similar. Dy10 shows nano and micrograins for spray-drying and solid state method, respectively. In the former case, the contribution from grain boundaries seems to be important and leads to a relatively higher resistivity.
Above 400 K, the electrical conductivity of CaMn0.98Nb0.02C3-δ is higher than the value obtained by solid state and sol-gel methods (range between 60-40, 50-25 and 44-28 S cm-1, respectively [9]). Taking into account that the synthesis does not modify appreciably the density of the samples, the narrower particle size distribution of the spray-drying method should explain this feature [26]. Indeed, homogeneous small grains allow a better electrical connectivity between grains and more homogeneous grain boundaries [27].
Finally, the results obtained for Dy2Nb2 sample are interesting. Indeed, this co-doped phase shows higher electrical conductivity than Nb2 and Dy2 samples (at 550 K, 61, 54 and 44 S cm-1, respectively).
Fig. 5. Relation between log σT and 1000/T at low temperature, below 400 K.
Fig. 6. Seebeck coefficient as a function of temperature (100-1100 K) for the different samples, measured by
PPMS and RZ2001i devices below and above 400 K, respectively.
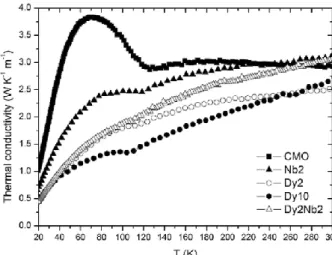
Fig. 7. Thermal conductivity as a function of temperature (20-300 K) for the different samples, measured by
Fig. 6 shows the Seebeck coefficient (S) as a function of temperature (100-1100 K). All samples present negative values of the thermopower, which indicate that the electrons are the predominant charge carriers (n-type conduction). Furthermore, we observe linear temperature dependence in the range 200-300 K, as reported in Ref. [23]. This behavior confirms the polaron hopping conduction mechanism proposed to explain the electrical conductivity. This model has previously been employed to describe other perovskite compounds, such as LaCrO3 [28] and Ca1-xSmxMnO3 (0 < x < 0.12) [23].
The Seebeck coefficient of Nb2 and Dy10 samples are in agreement with the values reported in the literature [7,9]. For doped-samples, the absolute value of thermopower decreases as temperature does. The samples with higher doping ratios present smaller |S| values, in agreement with the increase in the electrical conductivity. Fig. 7 shows the thermal conductivity (κ)as a function of temperature below 400 K, which is the operating temperature range of PPMS device. Thermal conductivity can be expressed by the sum of phonon component (κph) and charge-carrier component (κcar). The κcar can be calculated from the Wiedemann-Franz's equation [29]:
where T is the absolute temperature and L0 = (kB/e)2 η0 is the Lorentz number (the Sommerfeld's value for semiconductors is L0 = 2). This contribution represents less than 1% of the total thermal conductivity, so the phonon component is the major contribution in our samples.
The thermal conductivity of pure CMO shows the expected behavior for a crystalline material with a prominent phonon peak at low temperatures, where the spin ordered arrangement (AFM state) occurs [30]. This shows that the connectivity between grains is comparable to those reported for solid state samples [23].
On the other hand, the random ionic doping suppresses the phonon peak of the thermal conductivity by a mechanism of phonon-scattering at point defects [31].
At 300 K, the Dy-doped samples show the lowest thermal conductivities. Different reasons can explain this result. Firstly, the grain size of these samples is the smallest and the grain boundaries can act as a strong phonon scattering center. Secondly, Dy atoms are much heavier than Ca atoms [32]. Consequently, the vibrations of Dy atoms can be independent of the other atoms, which increase the lattice anharmonicity and the phonon-phonon interactions.
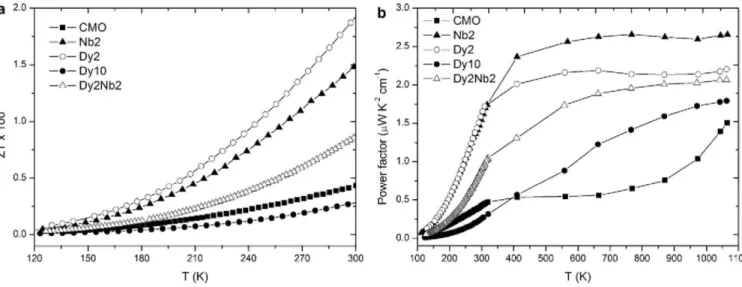
Finally, we discuss about the thermoelectric efficiency of the different samples (Fig. 8). The efficiency at low and high temperatures is described by ZT and power factor, respectively. Indeed, thermal conductivity is not available in the high temperature range with TTO system.
Fig. 8. (a) ZT at low temperature (120-300 K) and (b) power factor (PF) below 400 K as a function of
Below 400 K, ZT values increase monotonically with temperature (Fig. 8a). The best performance is obtained for Dy2 (ZT ~ 0.019 at 300 K). This value is five times higher than the ZT of CMO (ZT ~ 0.004). Below 400 K, the major contribution to the ZT originates from the Seebeck coefficient and the electrical conductivity, i.e., the power factor of the samples (Fig. 8).
Above 500 K, the power factor of CMO, Dy10 and Dy2Nb2 increases monotonically with temperature (Fig. 8b). Meanwhile, PF of Nb2 and Dy2 remain almost constant. The best PF is observed for Nb2 sample (-2.65 µW K-2 cm-1 between 400 and 1100 °C), which represents a 75% increase compared to CMO sample. This value is slightly higher than the PF obtained for sol-gel sample [9]. However, at low temperature, κ (spray-drying) is higher than κ (sol-gel). Consequently at high temperature, we could expect than ZT values of spray-drying samples would be lower than those of sol-gel samples.
In conclusion, spray-drying improve the electrical conductivity of these manganates. Nevertheless, their thermal conductivities remain equal to the values of solid state samples. As a result, the combination of the spray-drying and other technique to reduce the thermal conductivity should be greatly desirable to obtain an important enhancement of ZT.
4. Conclusions
Orthorhombic perovskites Ca1-xDyxMn1-yNbyO3-δ (x = 0, 0.02, 0.1 and y = 0, 0.02) compounds have been obtained by spray-drying technique. All samples show small particle grains with a narrow particle size dispersion. Different parameters modify the particle size: the presence of citric acid during the dissolution phase of precursors and the Dy doping ratio.
Their thermoelectric properties have been investigated. The spray-drying method improves their electrical conductivity, but their thermal conductivity is not affected. Below 400 K, the best ZT is obtained for Ca0.98Dy0.02MnO3-δ. This value is five-times higher than the ZT value for CaMnO3-δ (i.e., ZT ~ 0.019 and ~0.004 at 300 K, respectively). Above 400 K, the best PF is observed for CaMn0.98Nb0.02O3-δ, which represents a 75% increase compared to CaMnO3-δ sample (i.e., PF ~ 2.65 and 1.51 µW K-2 cm-1 at 1100K, respectively).
Spray-drying is an interesting technique for manganate synthesis. Nevertheless, the density of the samples is still low (70%). The thermoforging or spark plasma sintering of these powders could be investigated to solve this problem.
Acknowledgments
The authors are grateful to F. Rivadulla for helpful comments on this work. Part of this work was supported by the Belgian Science Policy under the Technology Attraction Pole Program (CHEMAT TAP2/03). The authors thank the FRS-FNRS for a cryofluid and equipment grant (CR.CH.09-10-1.5.212.10). H. Muguerra would like to thank the University of Liège for a postdoctoral fellowship.
References
[1] M.G. Kanatzidis, Chem. Mater. 22 (2010) 648. [2] H. Kleinke, Chem. Mater. 22 (2010) 604.
[3] I. Terasaki, Y. Sasago, K. Uchinokura, Phys. Rev. B 56 (1997) R12685.
[4] T. Yin, D. Liu, Y. Ou, F. Ma, S. Xie, J.-F. Li, J. Li, J. Phys. Chem. C 114 (2010) 10061. [5] Z. Zeng, M. Greenblatt, M. Croft, Phys. Rev. B 59 (1999) 8784.
[6] C.R. Wiebe, J.E. Greedan, Phys. Rev. B 64 (2001) 064421.
[7] Y. Wang, Y. Sui, H. Fan, X. Wang, Y. Su, X. Liu, Chem. Mater. 21 (2009) 4653. [8] Y. Wang, Y. Sui, W. Su, J. Appl. Phys. 104 (2008) 093703.
[9] L. Bocher, M.H. Aguirre, D. Logvinovich, A. Shkabko, R. Robert, M. Trottmann, A. Weidenkaff, Inorg. Chem. 47 (2008) 8077. [10] T. Okuda, Y. Fujii, J. Appl. Phys. 108 (2010) 103702.
[11] F.P. Zhang, X. Zhang, Q.M. Lu, J.X. Zhang, Y.Ci Liu, J. Alloys Compd. 509 (2011) 4171.
[12] M. Respaud, J.M. Broto, H. Rakoto, J. Vanacken, P. Wagner, C. Martin, A. Maignan, B. Raveau, Phys. Rev. B 63 (2001) 144426. [13] R.D. Shannon, Acta Cryst. A 32 (1976) 751.
[14] S.R. Percy, US Patent 125 406, 1872.
[15] T. Motohashi.Y. Nonaka, K. Sakai, M. Karppinen, H. Yamauchi, J. Appl. Phys. 103 (2008) 033705. [16] J∙ Rodriguez-Carvajal, Physica B 192 (1993) 55.
[17] V.M. Goldschmidt, T. Barth, G. Lunde, W. Zachariasen: Skrifter Norske Videnskaps-Akad. Oslo, Mat. -Naturv. Kl 2(1926) 117. [18] M.E. Melo Jorge, M.R. Nunes, R. Silva Maria, D. Sousa, Chem. Mater. 17 (2005) 2069.
[19] H. Taguchi, Physica B 304 (2001 ) 38.
[20] L. Bocher, R. Robert, M.H. Aguirre, S. Malo, S. Hébert, A. Maignan, A.Weidenkaff, Solid State Sci. 10 (2008) 496. [21] A. Maignan, C. Martin, F. Damay, B. Raveau. J. Hejtmanek, Phys. Rev. B 58 (1998) 2758.
[23] J. Hejtmánek, Z. Jirák, M. Marysko, C. Martin, A. Maignan, M. Hervieu, B. Raveau, Phys. Rev. B 60 (1999) 14057. [24] M. Ohtaki, H. Koga, T. Tokunaga, K. Eguchi, H. Arai, J. Solid State Chem. 120 (1995) 105.
[25] N.F. Mott, Conduction in Non-Crystalline Materials, Oxford University Press, New York, 1993.
[26] H. Muguerra, B. Rivas-Murias, M. Traianidis, C. Henrist, B. Vertruyen, R. Cloots, J. Solid State Chem. 183 (2010) 1252. [27] A. de Andrés, M. García-Hernández, J.L. Martínez, Phys. Rev. B 60 (1999) 7328.
[28] W.J. Weber, C.W. Griffin, J.L. Bates, J. Am. Ceram. Soc. 70 (1987) 265.
[29] N.W. Aschcroft, N.D. Mermin, Solid State Physics, Holt Saunders, Philadelphia, PA, 1976. [30] Y. Wang, Y. Sui, X. Wang, W. Su, X. Liu, H.J. Fan, Acta Mater. 58 (2010) 6306.
[31] T.M. Tritt (Ed.), Thermal Conductivity. Theory, Properties and Applications, Kluwer Academic/Plenum Publishers, New York, 2004. [32] D. Flahaut, T. Mihara, R. Funahashi, N. Nabeshima, K. Lee, H. Ohta, K. Koumoto, J. Appl. Phys. 100 (2006) 084911.